GoNoGo Charts do not forecast the markets. They help investors respond to change.
The S&P 500 and Nasdaq Composite both declined 0.3% last week, but the midweek rally was flanked by sharp selling to start and end the trading week. The heaviest activity was happening under the surface of the indices as rotation continued out of growth equities and into cyclical sectors of the market. The indices are not sustaining heavy losses, but this is a frustrating environment for trend-following investors.
It is not the strongest of the species that survives, nor the most intelligent, but the one most responsive to change."
- Charles Darwin, 1809
On an absolute basis, 9 of the 11 S&P 500 sectors finished lower, but in terms of relative strength trends against the index, we can look at the GoNoGo RelMap® below to quickly see leaders and laggards:
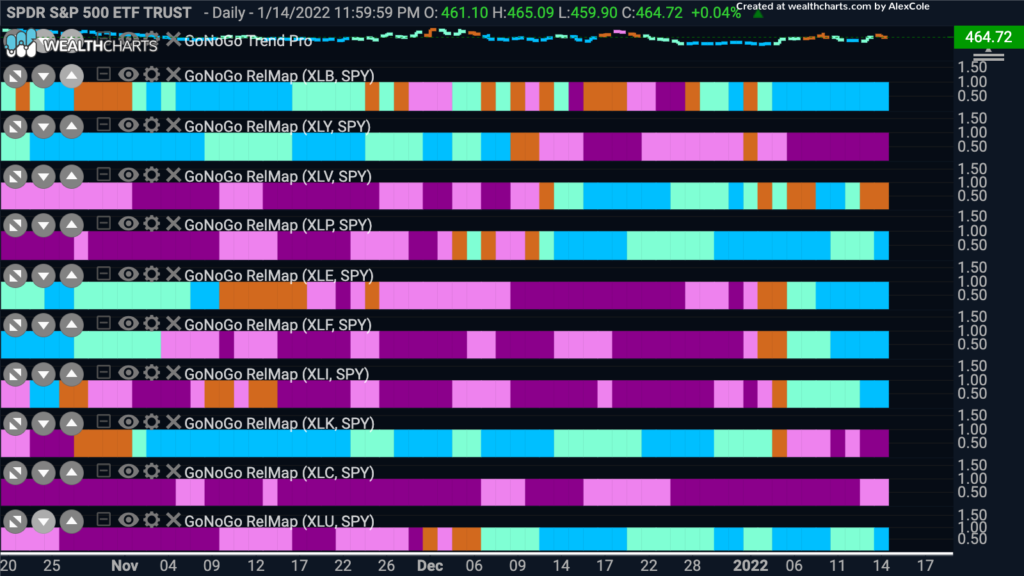
- Six sectors outperformed the broad S&P 500 Index this week favoring cyclical/value stocks: Materials $XLB, Staples $XLP, Energy $XLE, Financials $XLF, Industrials $XLI, and Utilities $XLU
- $XLY, $XLK, and $XLC are painting firm “NoGo” bars as growth equities lose favor
- Healthcare is struggling to hold bullish conditions with more amber bars this week indicating neutrality relative to the index
Energy stocks followed oil prices much higher and roundly outperformed. The $XLE was up over 6% last week. U.S. crude oil prices climbed to more than $84 per barrel on Friday and posted the fourth weekly gain in a row. After briefly tumbling below $66 per barrel in early December following the emergence of the Omicron variant, the price of oil is back near a recent high reached in late October.
Growth vs Value
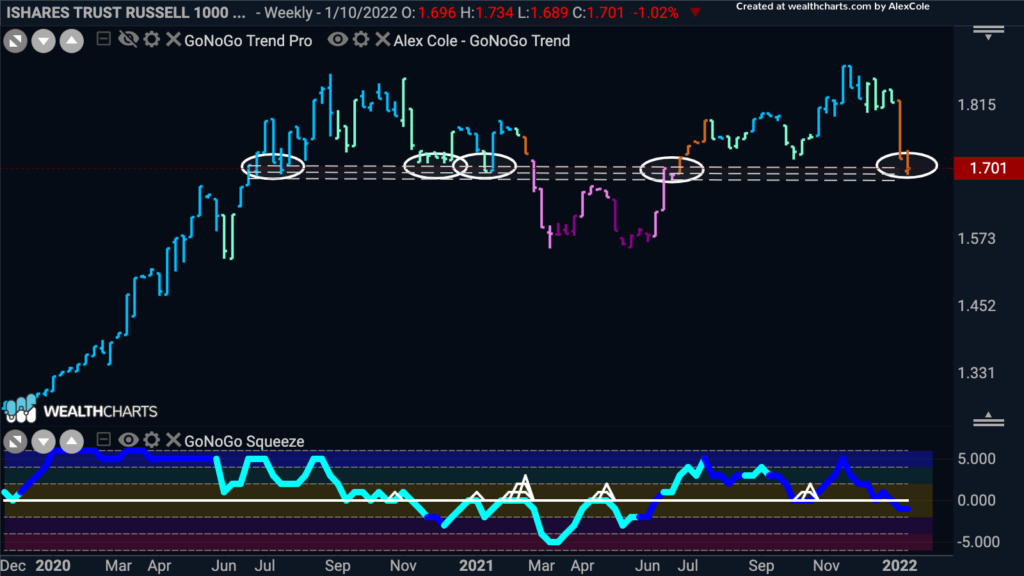
U.S. large-cap growth lagged its value-oriented counterpart for the second week in a row. So far in 2022, the growth benchmark – the Russell 1000 Growth ETF, $IWF – has fallen 6.36%; its value peer – the Russell 1000 Value ETF, $IWD – is up just under 1%.
The weekly ratio of $IWF to $IWD is pictured below. Starting the year off with the glide path of a brick helped this ratio reach 6-month lows in just the first two trading weeks of the new year. We have annotated that this is the 6th time since mid-2020 that we have been at this critical level. The concept of polarity tells us that as investors anchor to key levels what was resistance in May 2020 became support July-Jan 2021, only to be a level of resistance or supply pressure in April 2021. Will this key level act as support this week? The chart below shows strong negative momentum in GoNoGo Oscillator® on heavy volume. Last week’s bar closed right near the low as well.
To see developments at this support level faster, we can look to the daily period of the same chart. GoNoGo Trend® is a strong purple “NoGo,” GoNoGo Oscillator® is at -4 on heavy volume.
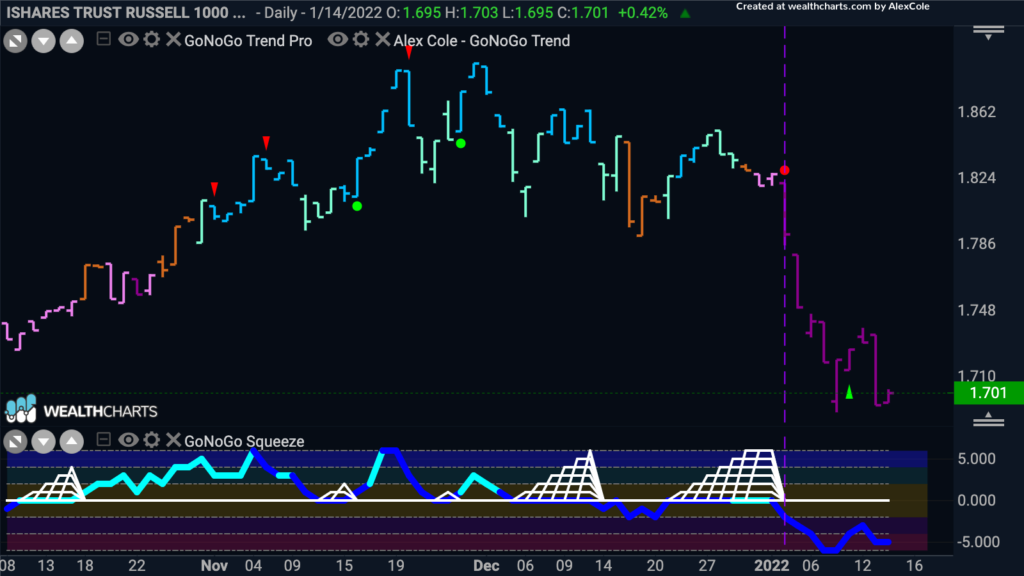
This is a great example of the GoNoGo Squeeze® showing investors what follows compressed volatility. When momentum broke decisively to the downside on Jan 4 out of the max squeeze grid, Value won the tug-of-war and Growth plummeted in this ratio. If this price level provides support, we may first see a response in GoNoGo Oscillator – rallying back to neutral.
Tech Sector (not Cathie Wood) in the Spotlight
The recent underperformance of technology stocks has made it a rough start for growth equities in 2022. Below is a weekly chart of the S&P 500 information technology sector, $XLK. Trend conditions are in a weak aqua “Go” and right at long-term trendline support. GoNoGo Oscillator has cascaded down to the zero line on heavy volume.
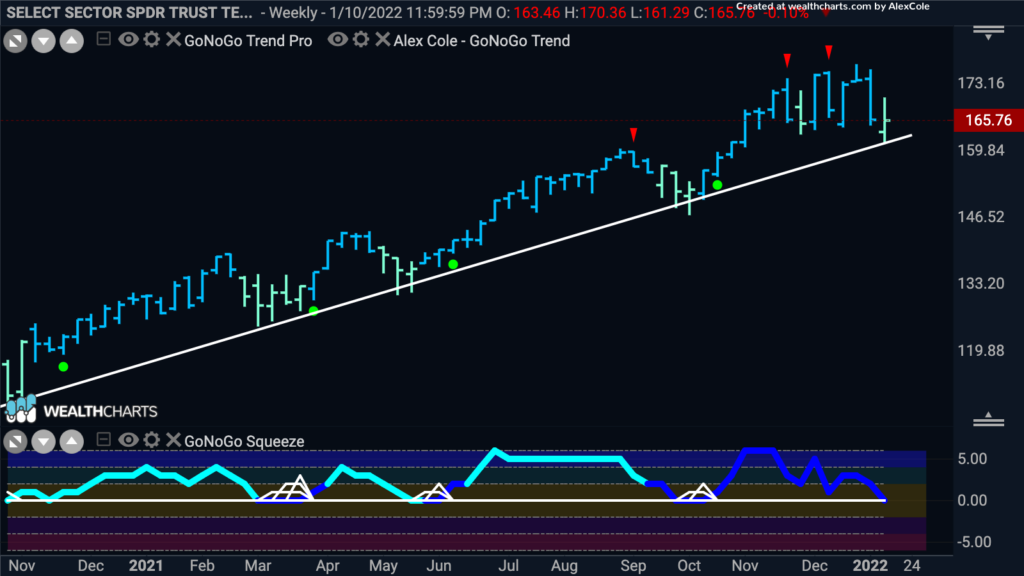
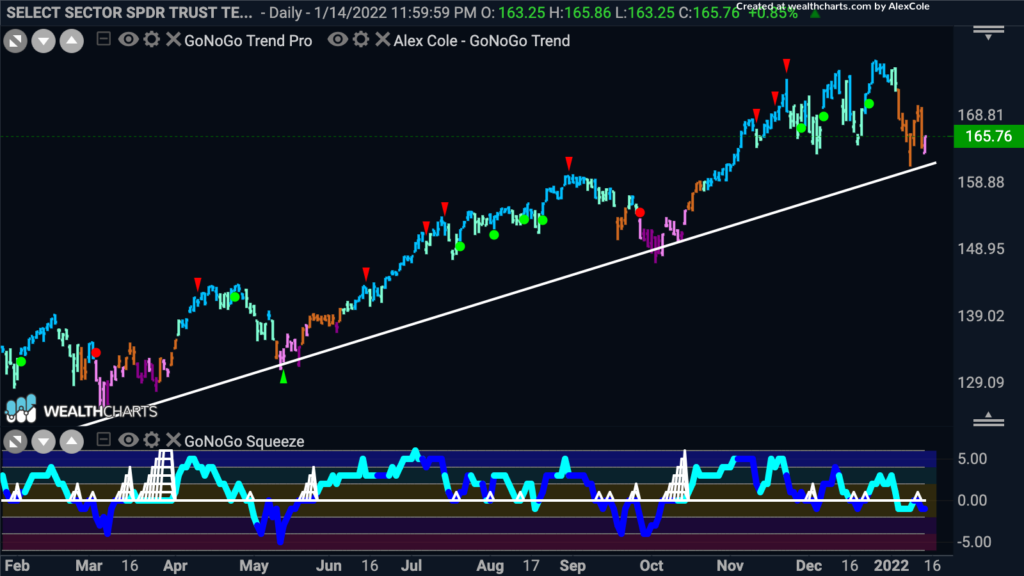
Here is the same chart with a bit more detail on the daily timeframe. The same trendline has shaken out investors at each break. Interestingly, Friday closed on a “NoGo” bar just above trendline support.
Rising Rates? Not last week…
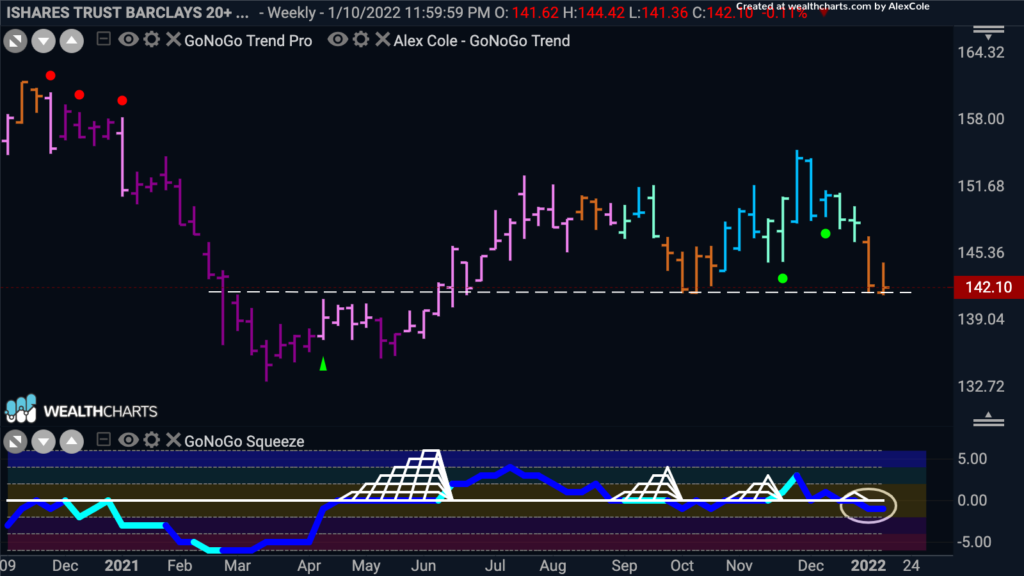
The 10-yr yield wasn’t the problem this week since it was unchanged at 1.77%. But we are watching the trend of Treasuries with the potential for further selloff. On the weekly chart below, $TLT is at prior support under amber neutral trend conditions. However, GoNoGo Oscillator is in negative territory. If prices break down through support, and/or downside momentum picks up, we could see bonds sell off sharply sending yields higher. but, if $TLT catches a bid at support, we would expect to see GoNoGo Oscillator back in neutral or even move positive which would take pressure off the rising rate environment everyone is watching. GoNoGo Charts does not forecast but can help investors respond.
Commodities Trending Higher
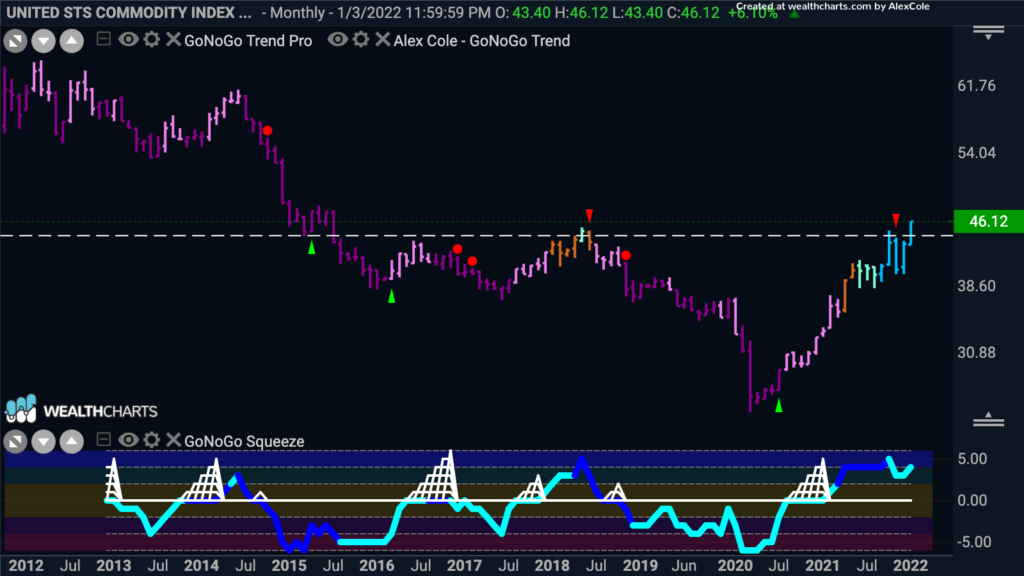
Below is a Monthly GoNoGo Chart of the past decade in the US Commodities Index. The rally off covid lows in March of 2020 was remarkable, but consistent with other markets retracing to pre-pandemic levels. Importantly, $USCI has closed well above this area of resistance. Trend conditions are a strong “Go” while GoNoGo Oscillator is positive, but not overbought. The next resistance level is at $55.
Investors in a Globalized Marketplace
With the US Dollar finally succumbing to the pressure of inflation and prolonged accommodative monetary policy and fiscal spending policies, we see some of the emerging markets catching the bid and showing breakouts worth a view from global investors. These new trends do not apply consistently to all emerging markets countries. In fact, the MSCI emerging markets index fund has drifted steadily lower for a year. Rather, what jumps off the charts the leadership of non-US markets which are commodity-rich.
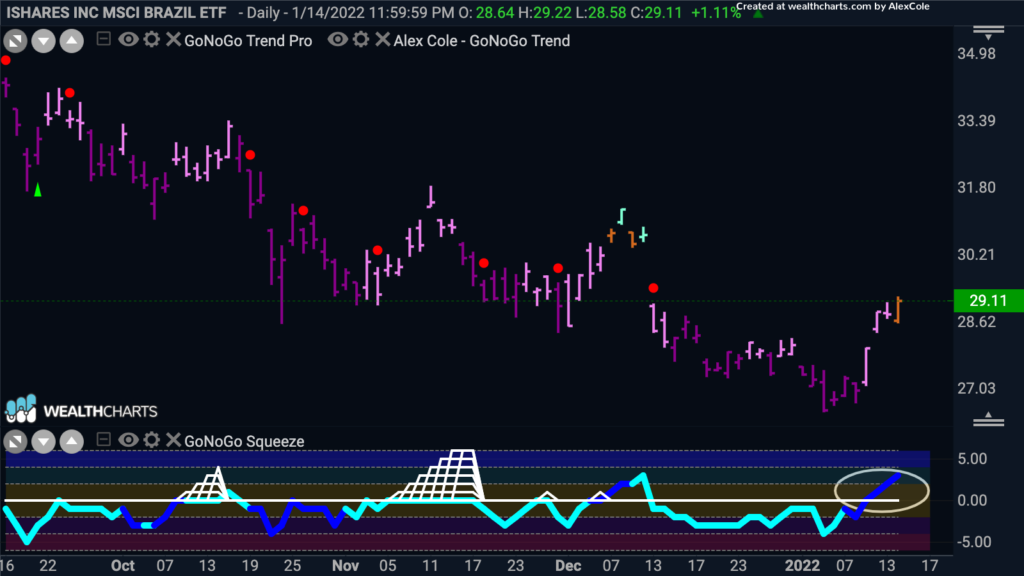
Take a look at Brazil $EWZ which is in a clearly defined downtrend, but showing GoNoGo Oscillator ripping positive last week on heavy volume. The composite blend of all trend indicators has left the bearish pink and purple to strike a neutral amber bar on Friday. We’ll be watching GoNoGo Charts to see if this move will be sustained:
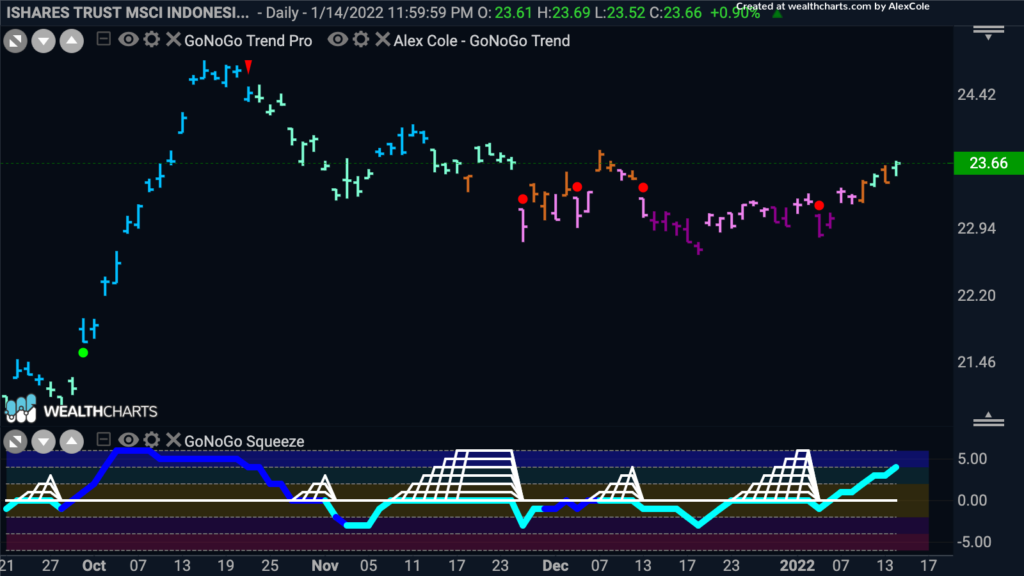
Another to consider is Indonesia showing a large base off the October highs and signaling a fresh “Go” with the first positive momentum in months:
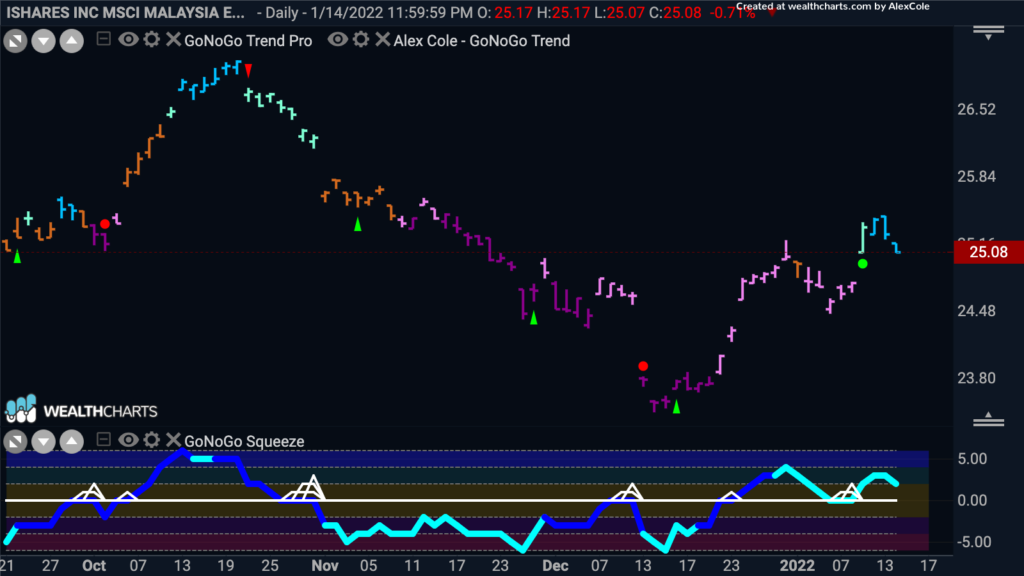
Malaysian Equities retesting a breakout this week into the “Go” trend:
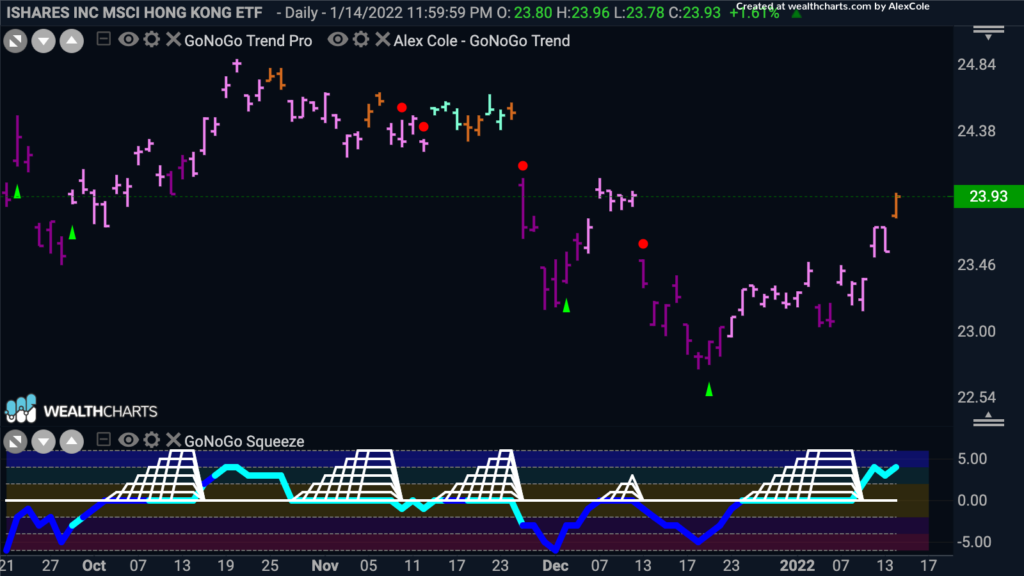
Even Hong Kong is showing positive momentum for the first time in months as GoNoGo Oscillator rallies to overbought on heavy volume. GoNoGo Trend painted a neutral bar on Friday
Equities are not the only investment vehicle and the US is not the only economy covered by GoNoGo Charts. In the next chapter of this cycle, there may be opportunities in other areas of the global market landscape to put capital to work. Our job is to be responsive to those changes as they appear in price.

