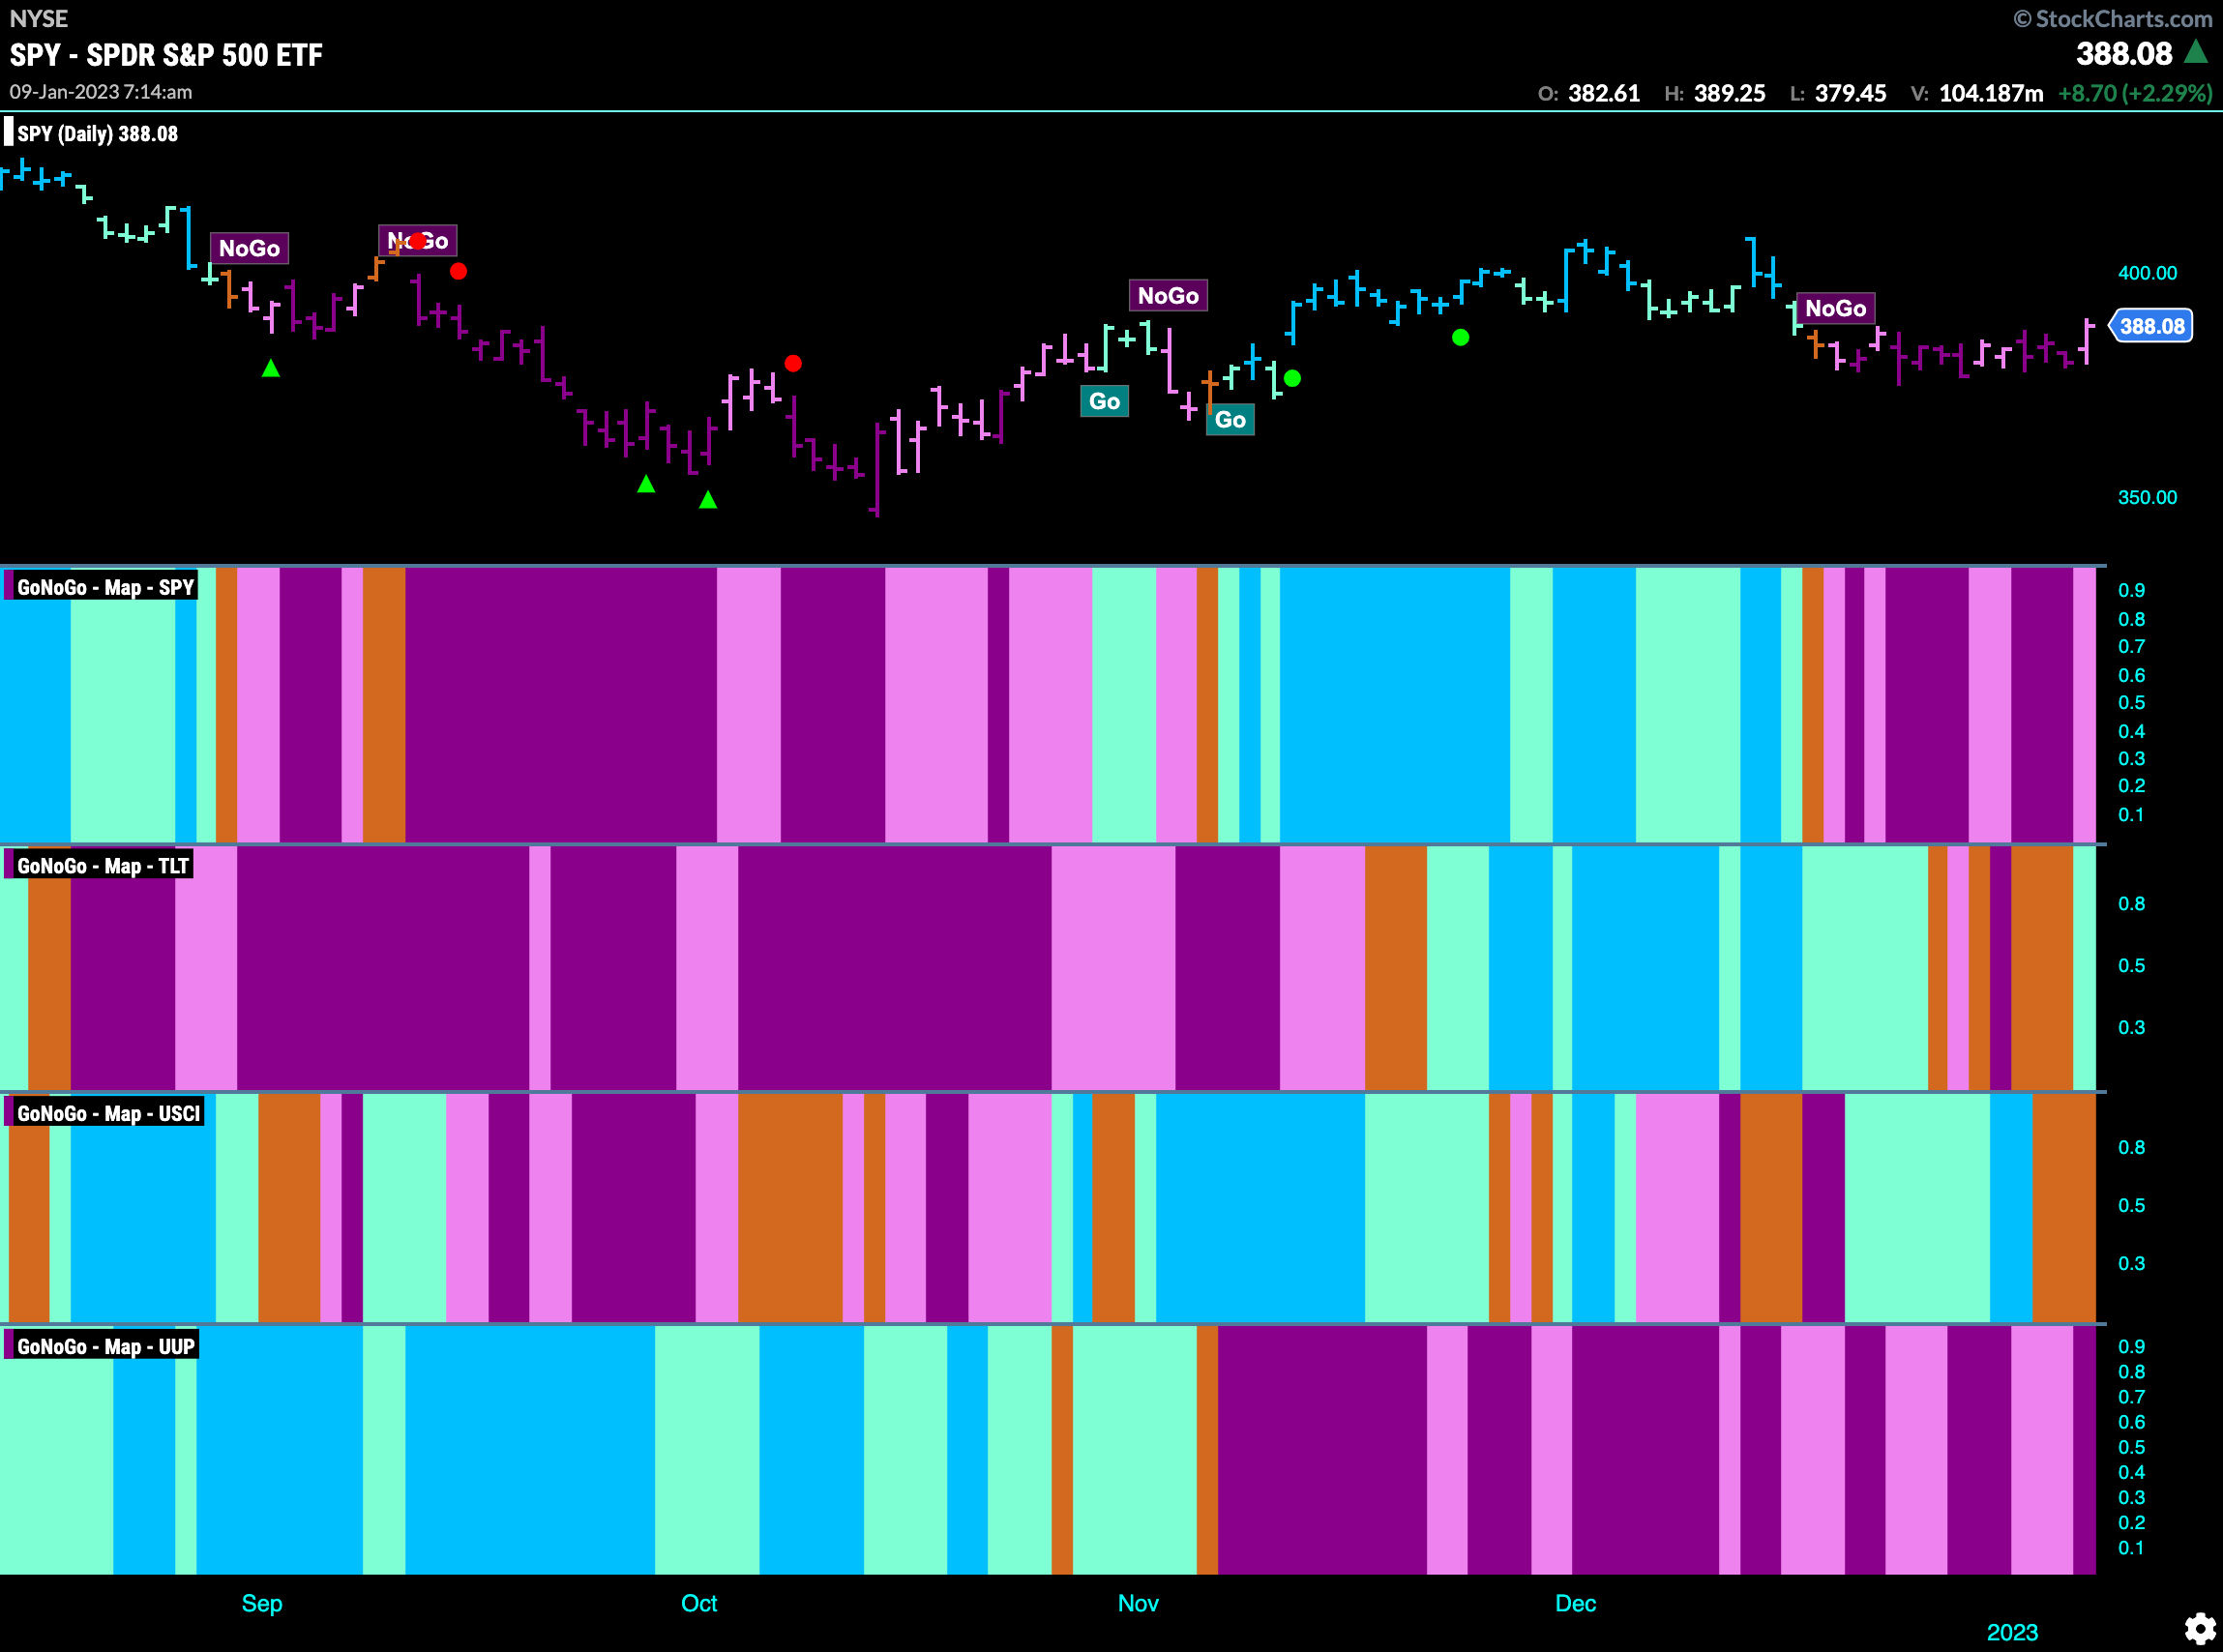
Good morning and welcome to this week’s Flight Path. Let’s take a look at the GoNoGo Asset map below. The “NoGo” continues is U.S. equities but the week ended with a strong day that saw a return to a pink bar. Treasury bond prices fluctuate showing some uncertainty in the form of amber “Go Fish” bars and now end the week with an aqua “Go” bar. Commodities struggle again to hold onto the “Go” trend and painted a couple of “Go Fish” bars to end the week. The dollar, fell again painting strong purple “NoGo” bars.
Inflection point in U.S. Equities?
The “NoGo” is being threatened as we see the strong price action on Friday pushed price up against horizontal resistance. We also see that the GoNoGo Oscillator is testing the zero line from below where we will look to see if it finds resistance or if it can break through into positive territory. If the oscillator gets rejected here, we can expect to see further downside pressure.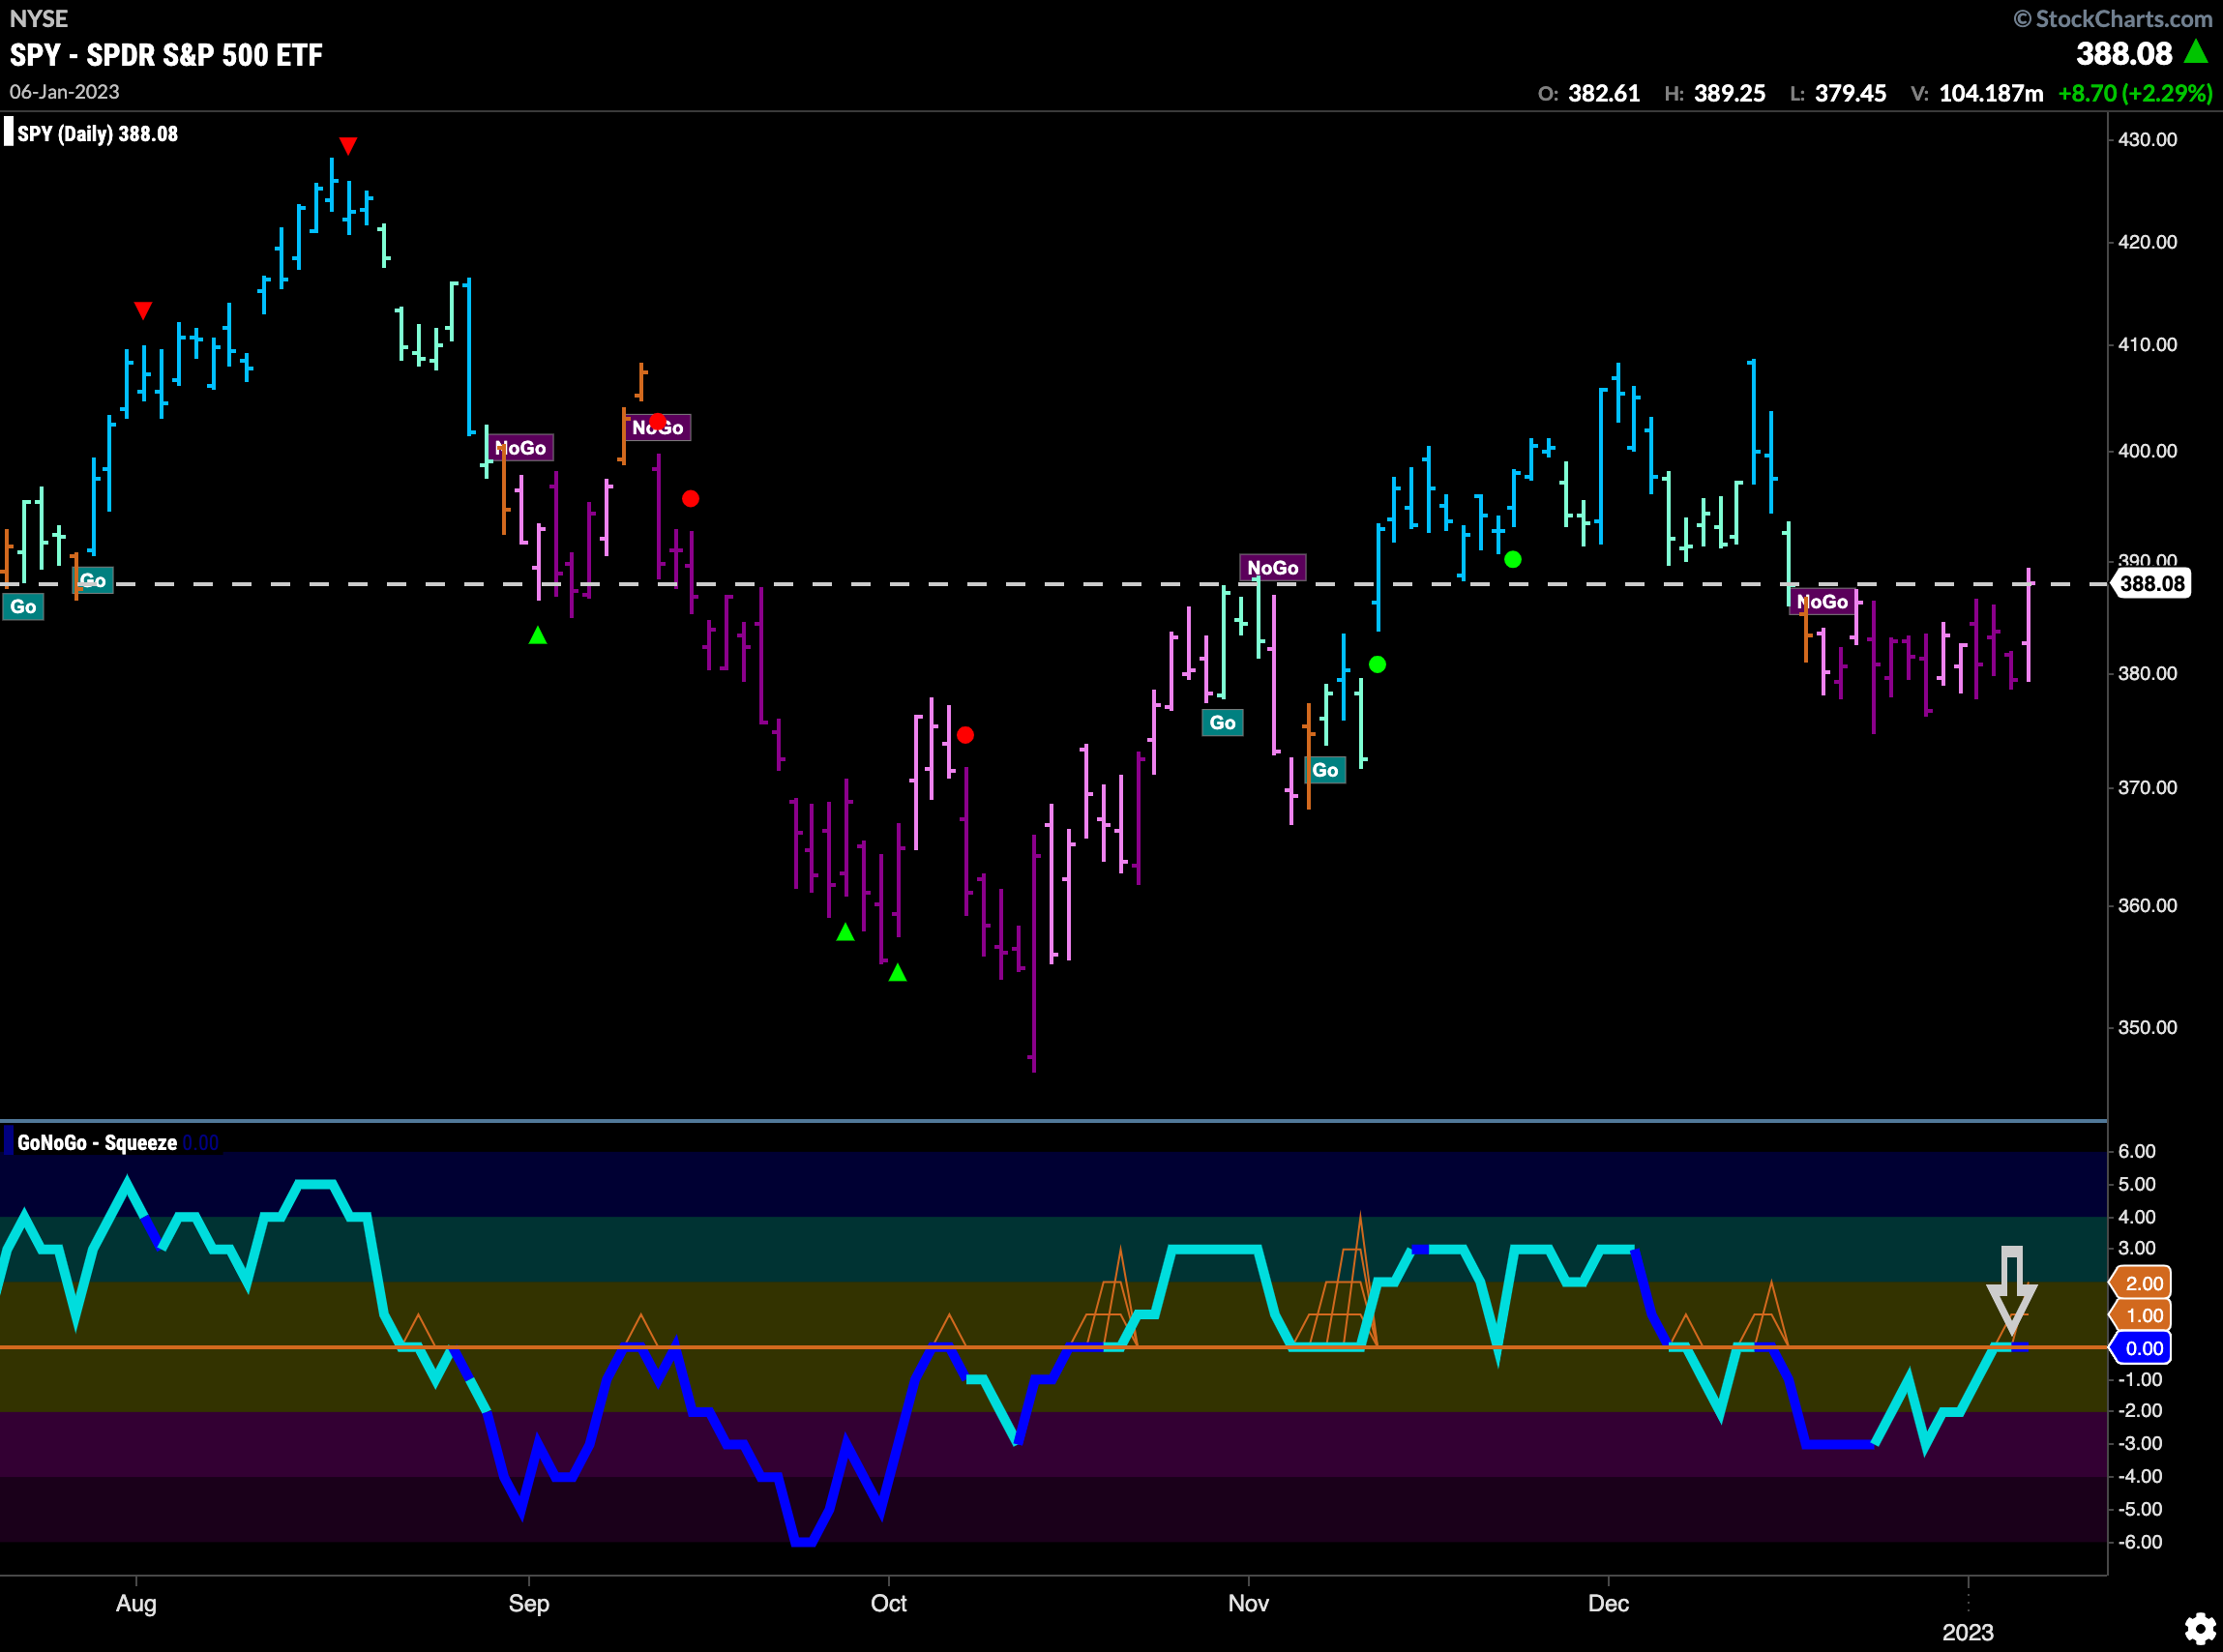
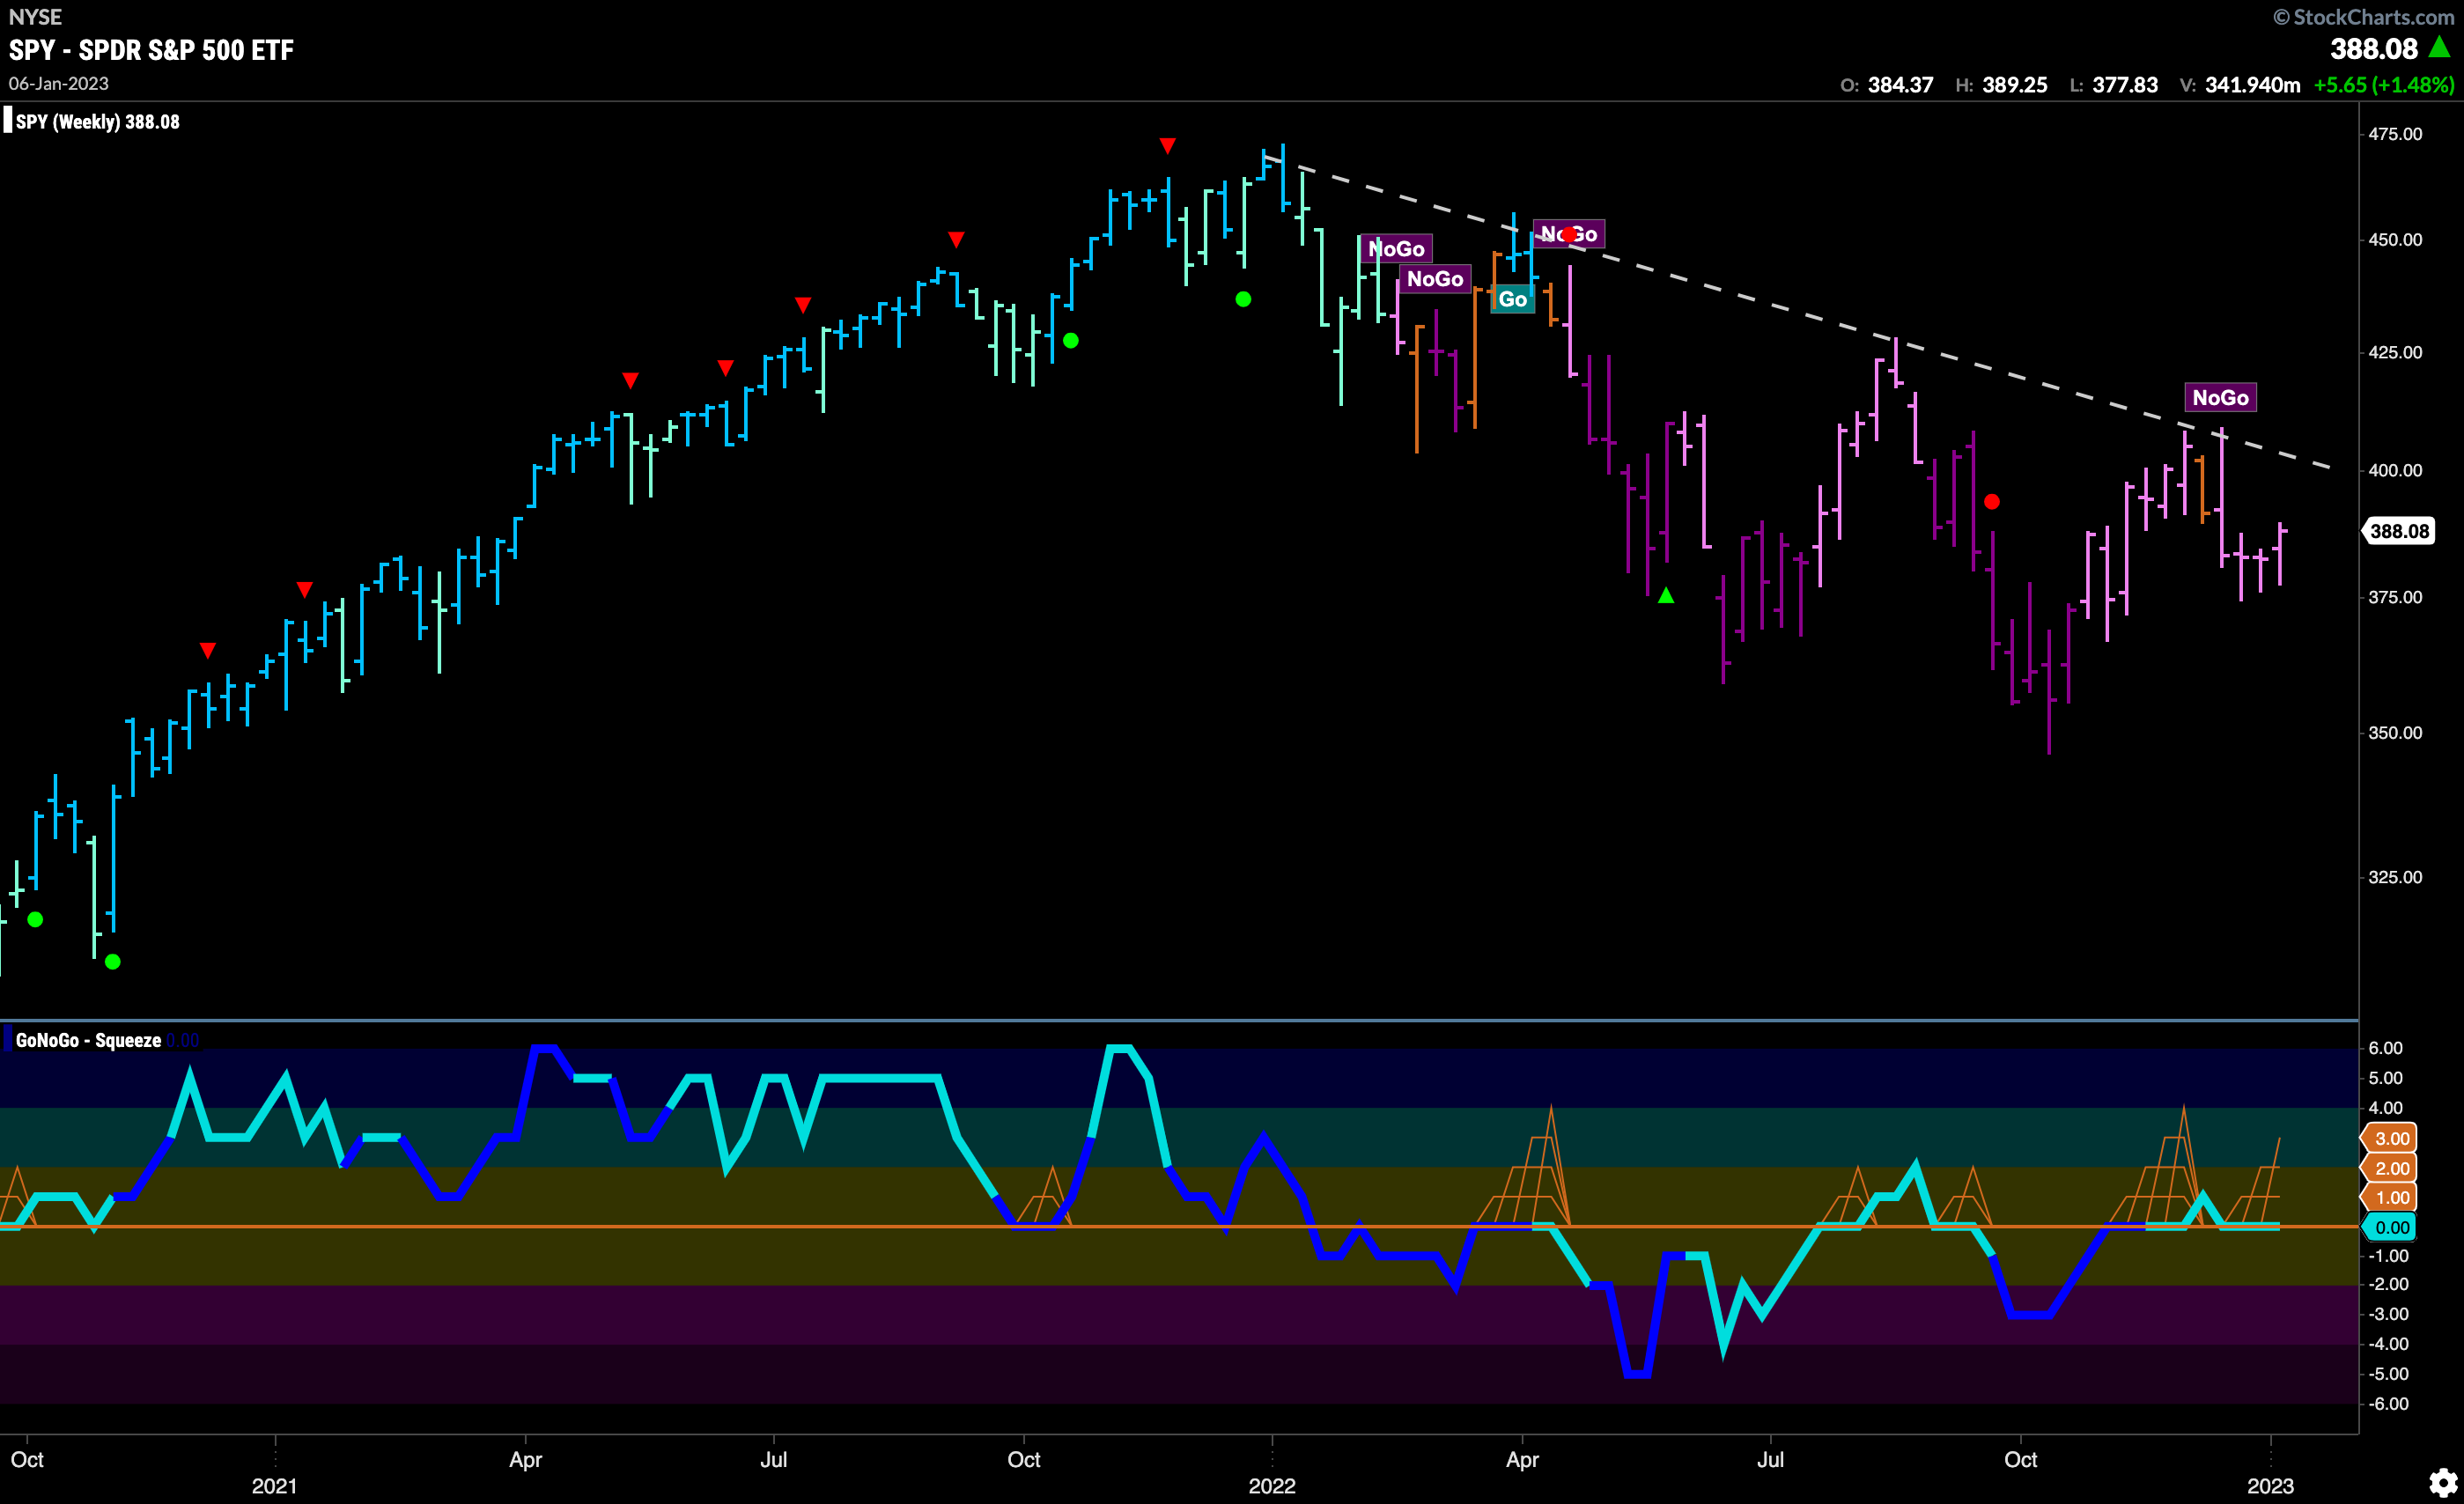
The longer term weekly chart shows that the “NoGo” remains in place. After making a series of lower lows and lower highs we see GoNoGo Trend painting mostly pink bars. GoNoGo Oscillator is also at the zero line having threatened to break into positive territory. We will watch to see in which direction momentum turns.
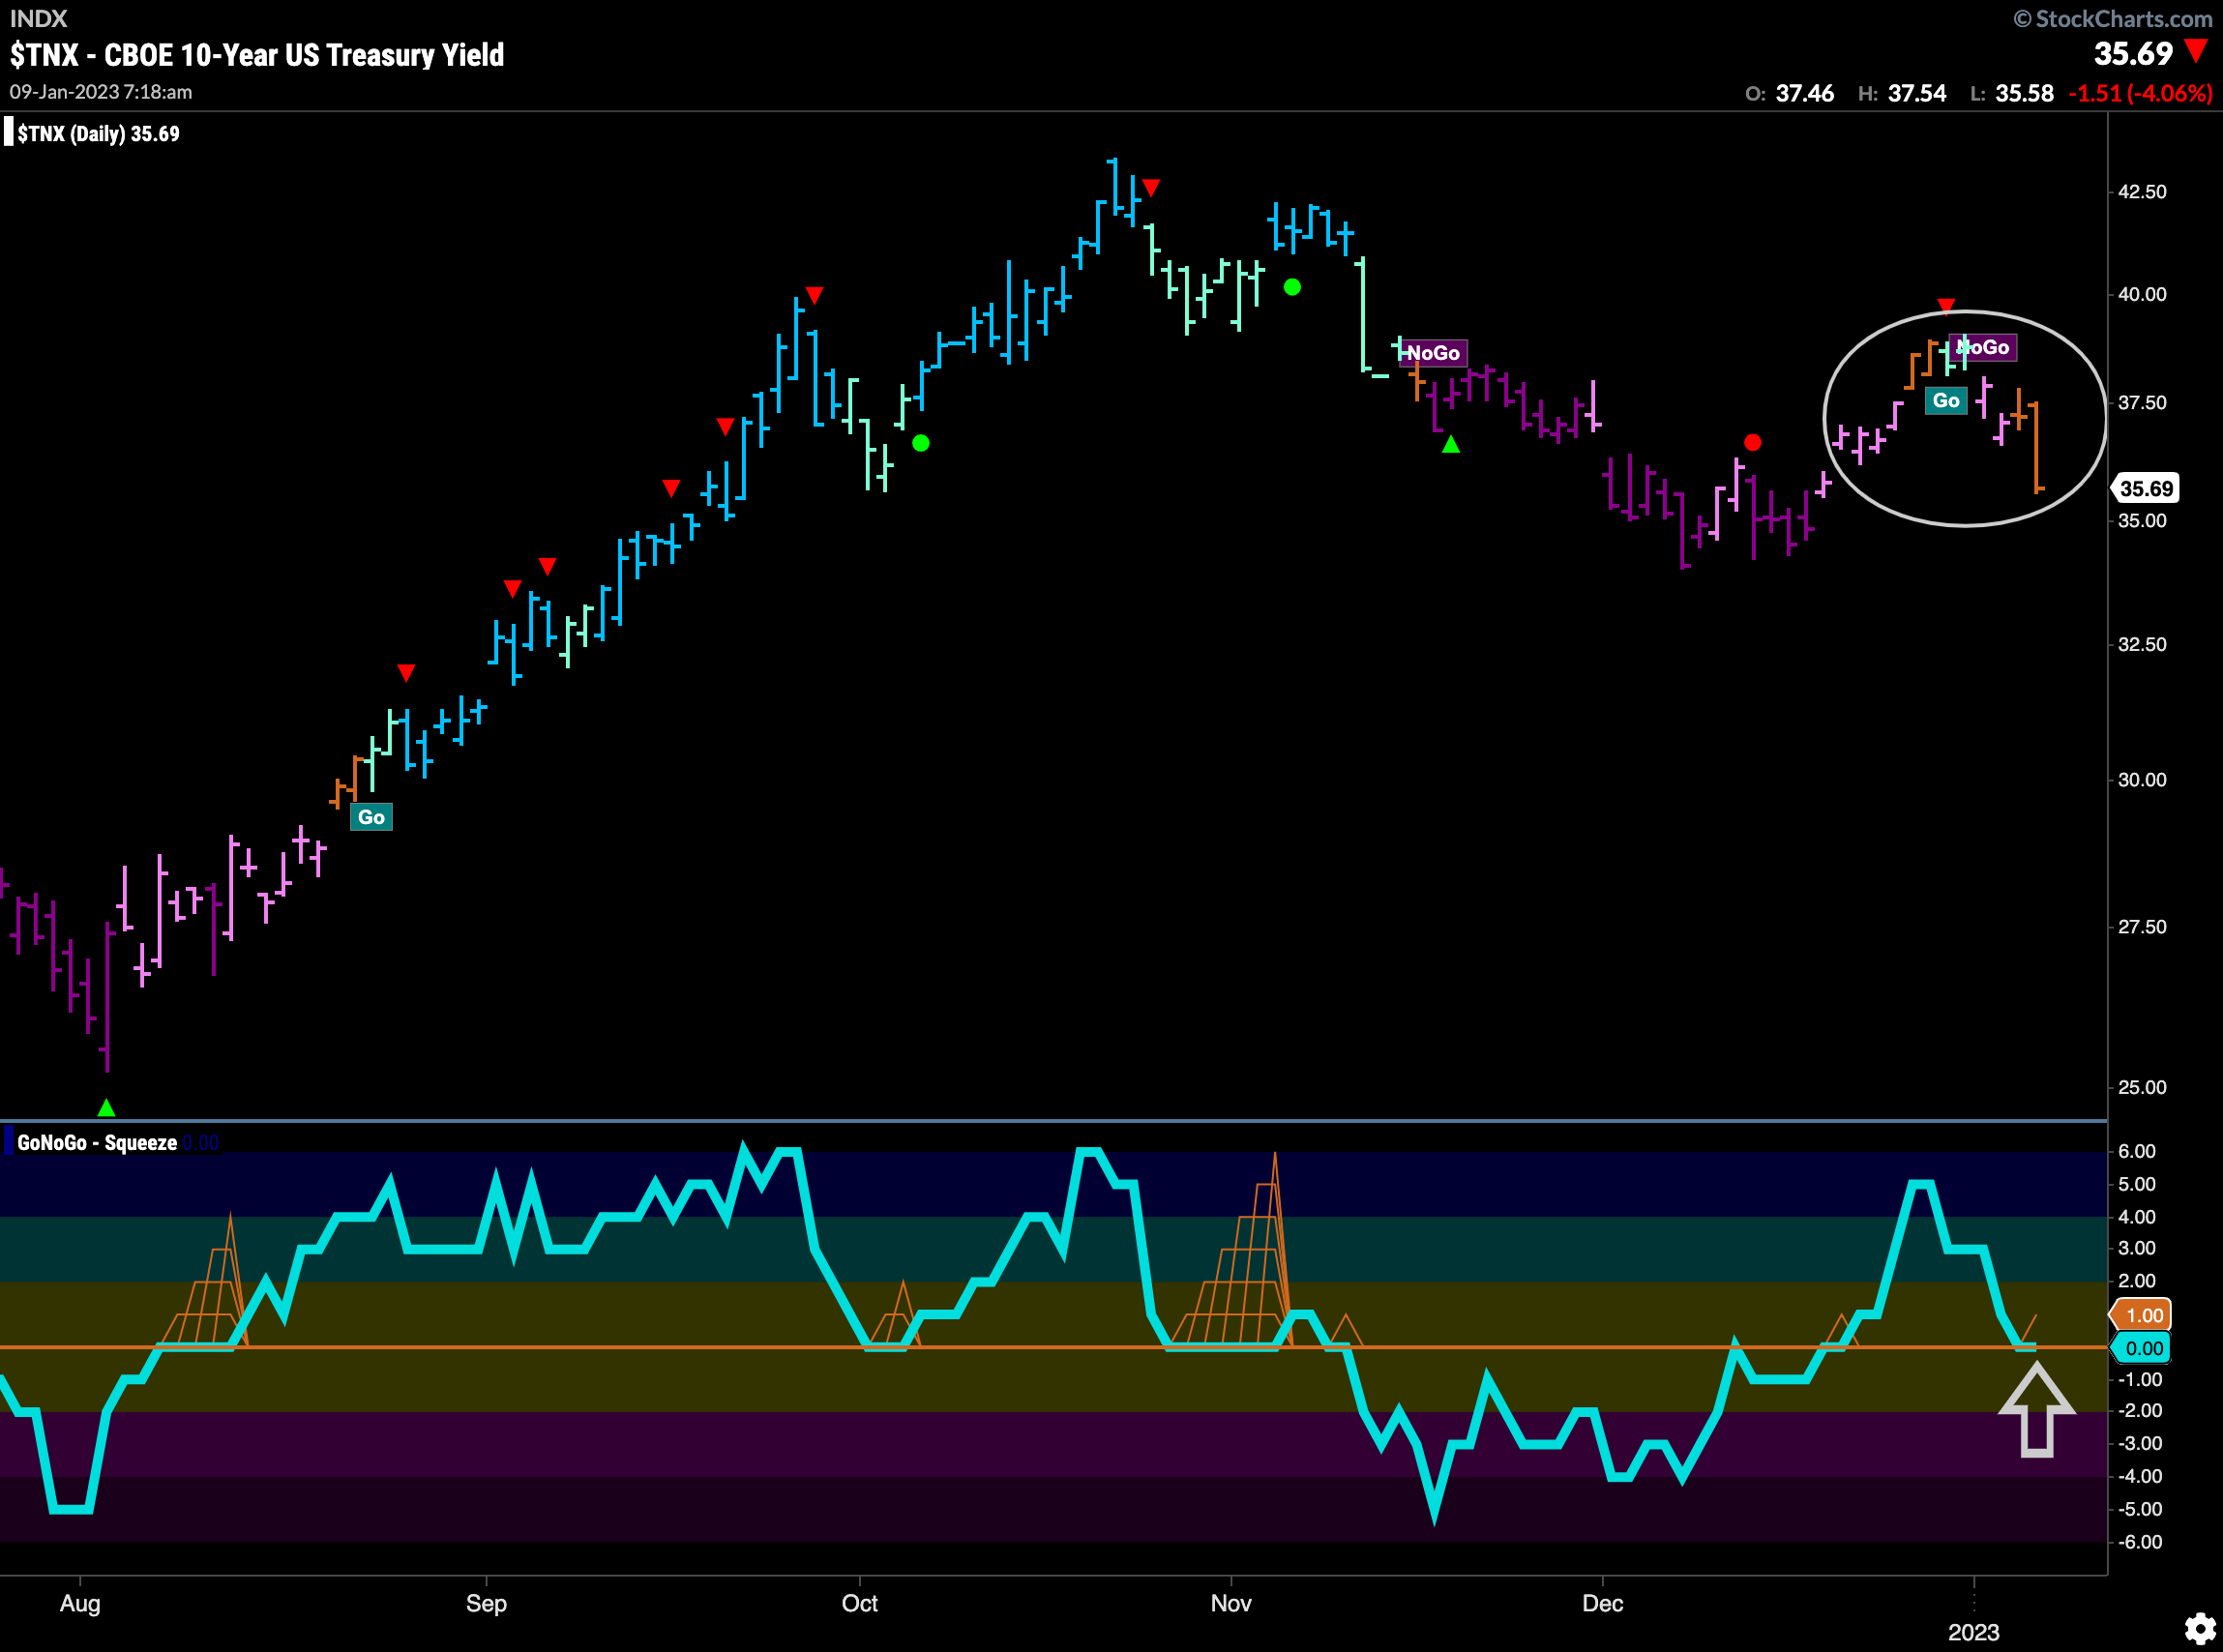
Treasury Rates Fall Again
Friday saw price fall sharply and another amber “Go Fish” bar. With this, GoNoGo Oscillator is back at zero after a foray into positive territory. It seems another crucial moment as we wait to see how this resolves.
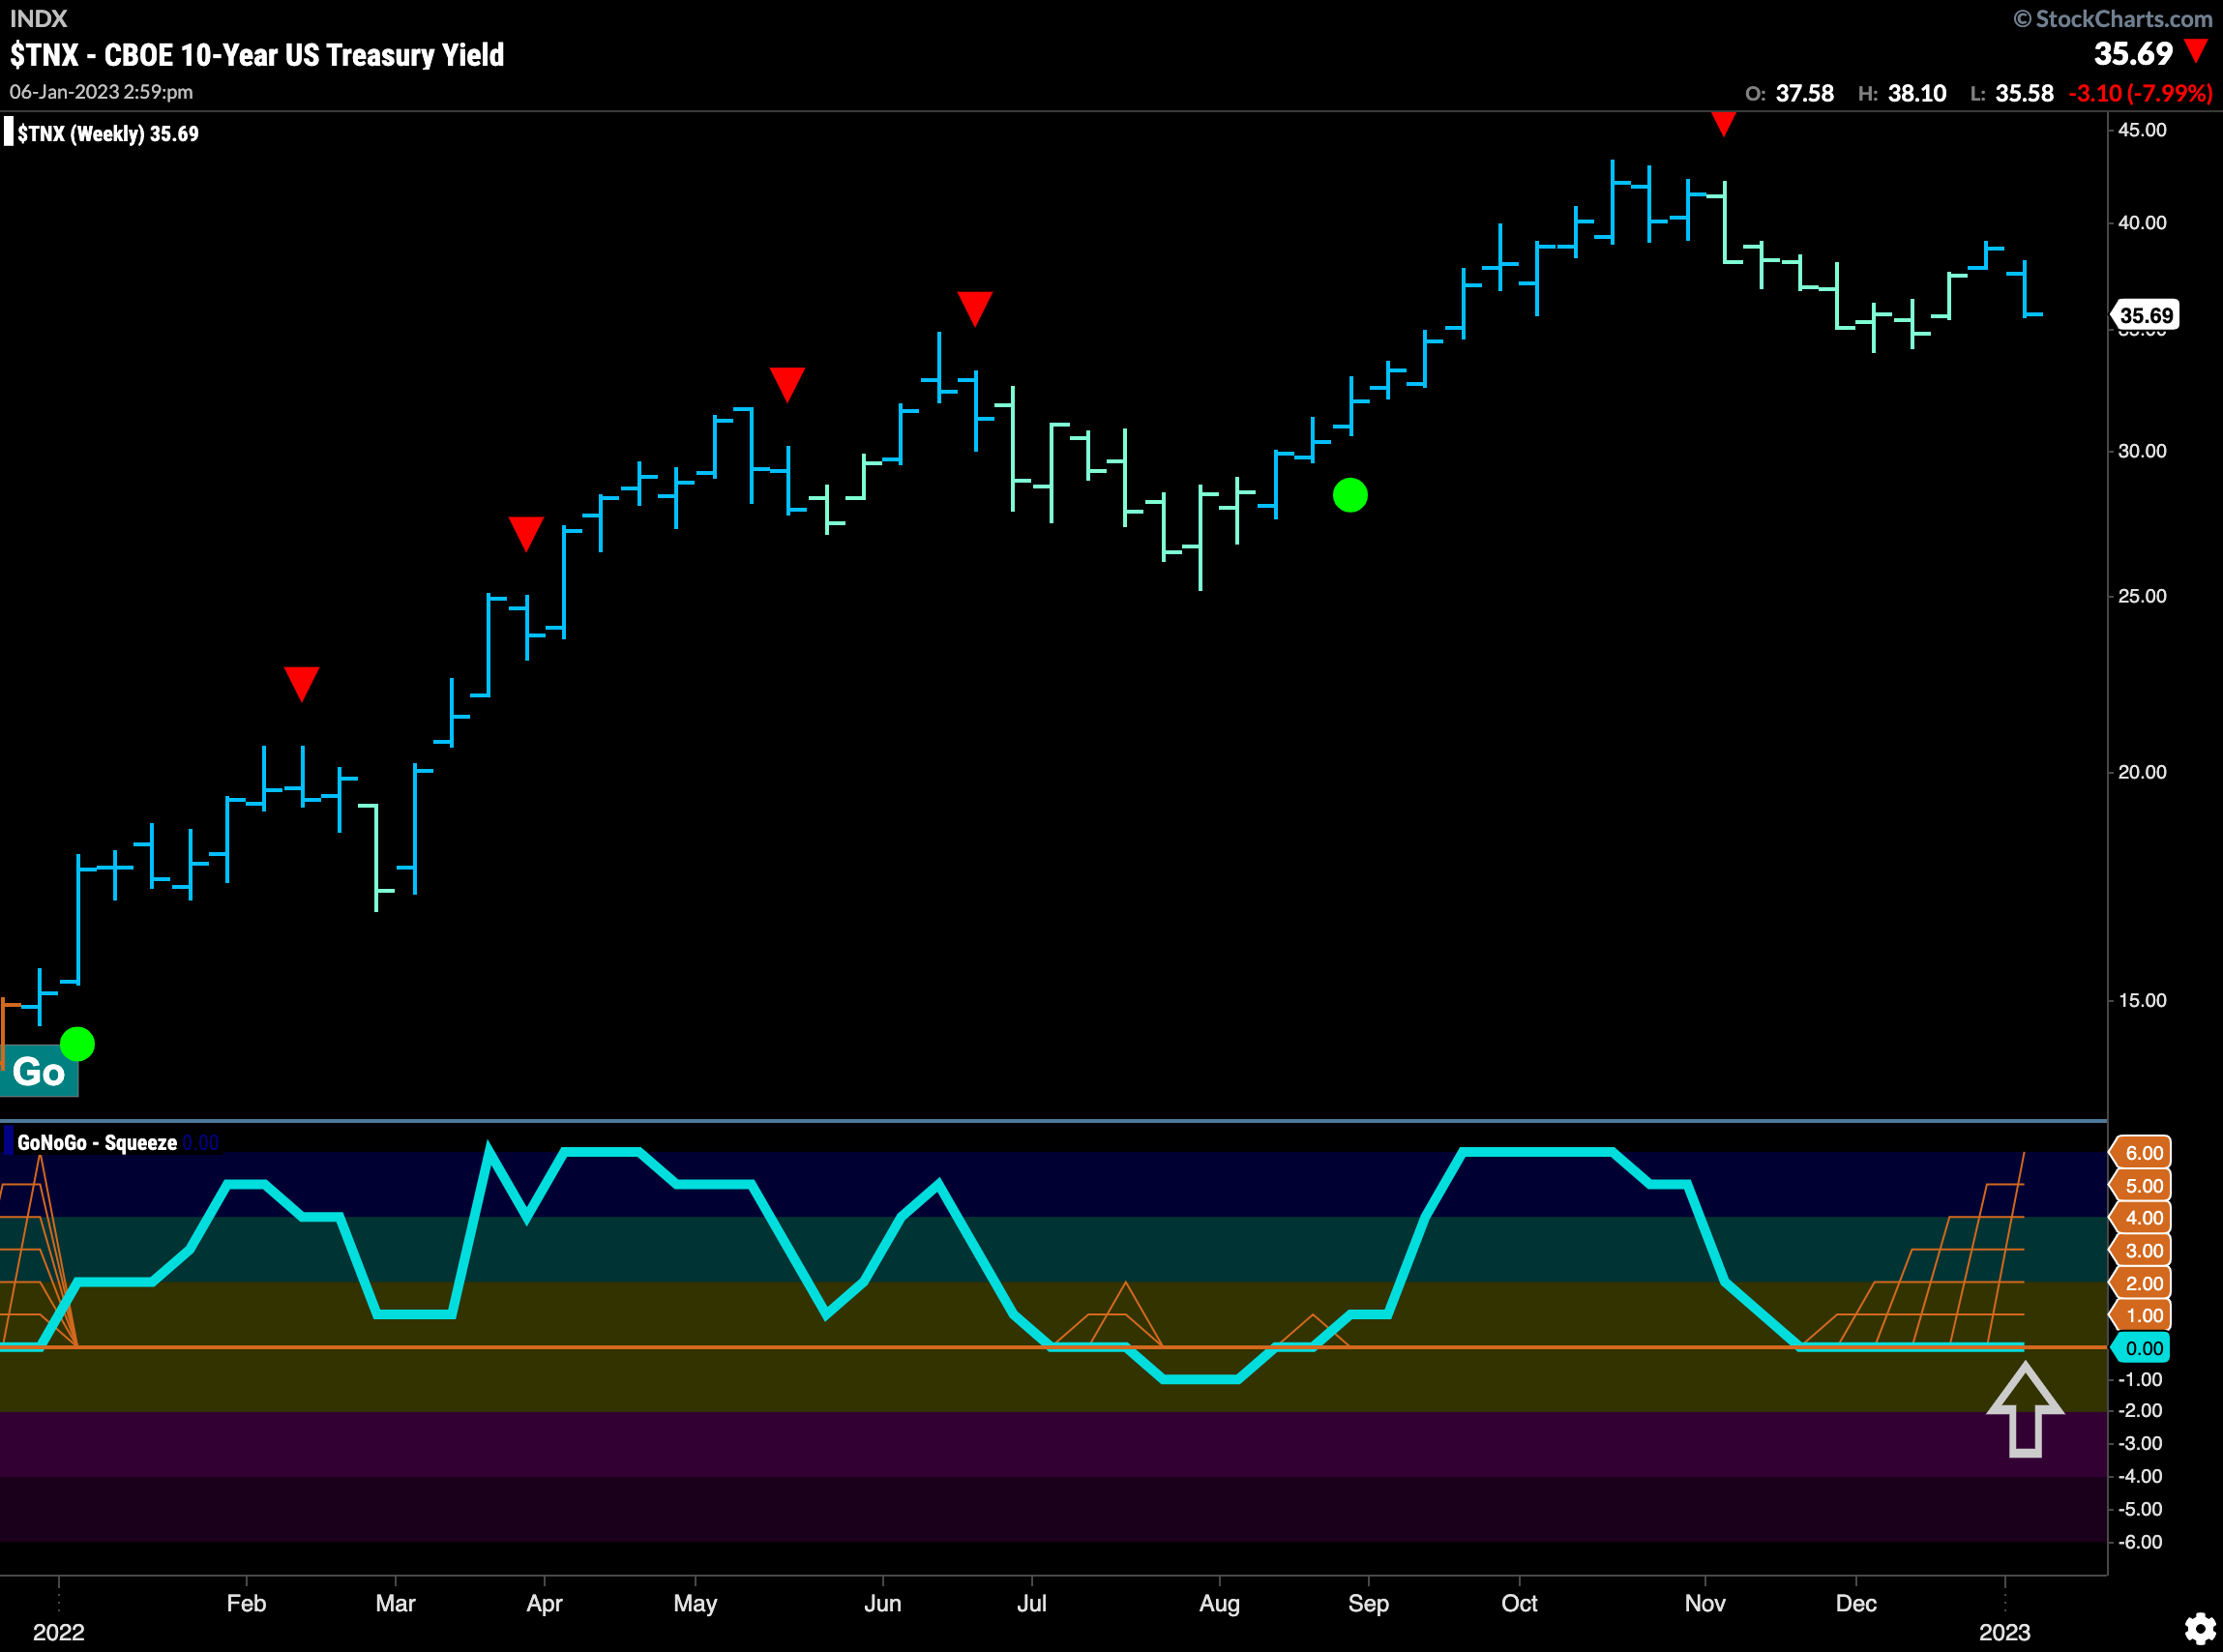
On the longer term chart we see that the “Go” trend is still in place. GoNoGo Trend painted another strong blue bar as GoNoGo Oscillator continues to ride the zero line. We now see the climbing grid of GoNoGo Squeeze at a max which tells us that there has been little directional momentum over the longer time frame. Price looks to have set a higher low and so if the squeeze is. broken into positive territory we can expect the trend to continue with an attempt at a new higher high.
The Dollar Trying to Get off the Floor
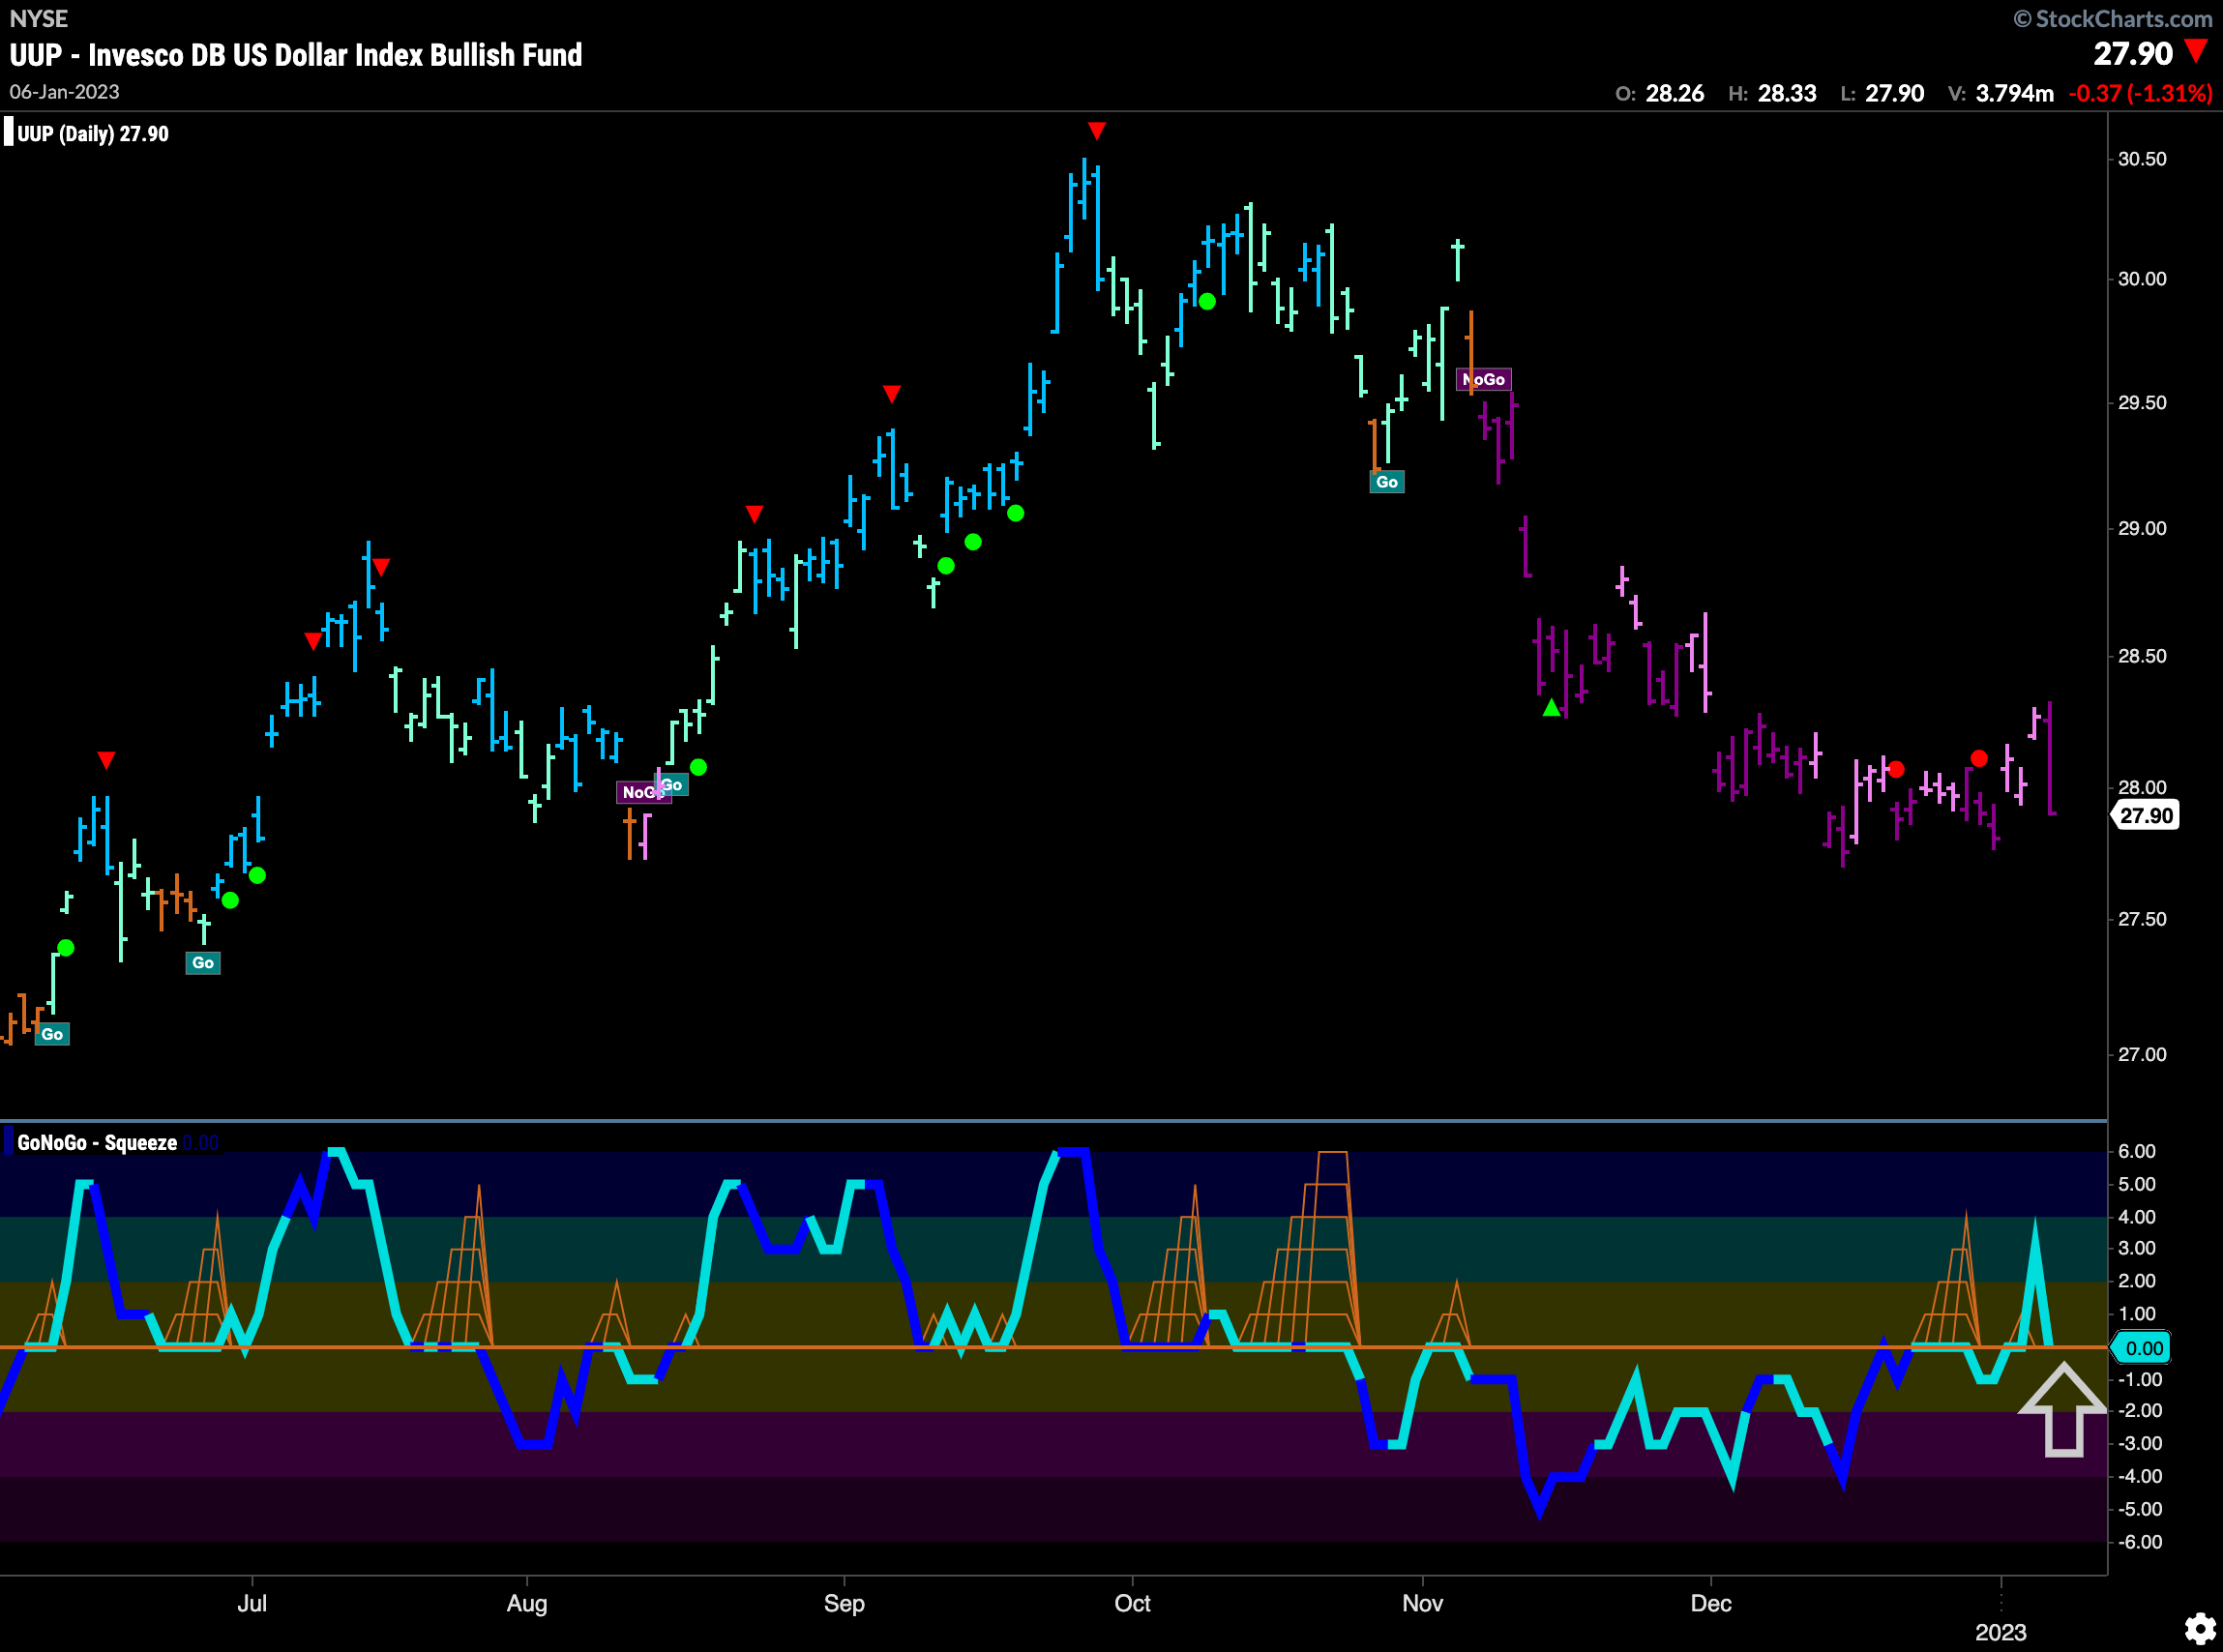
Price returned to strong purple “NoGo” bars at the end of the week and this saw the oscillator fall sharply to test the zero line from above. With the “NoGo” in place, we will watch to see if the oscillator moves back below the zero line which would confirm the “NoGo” as it would indicate momentum in the direction of the trend.
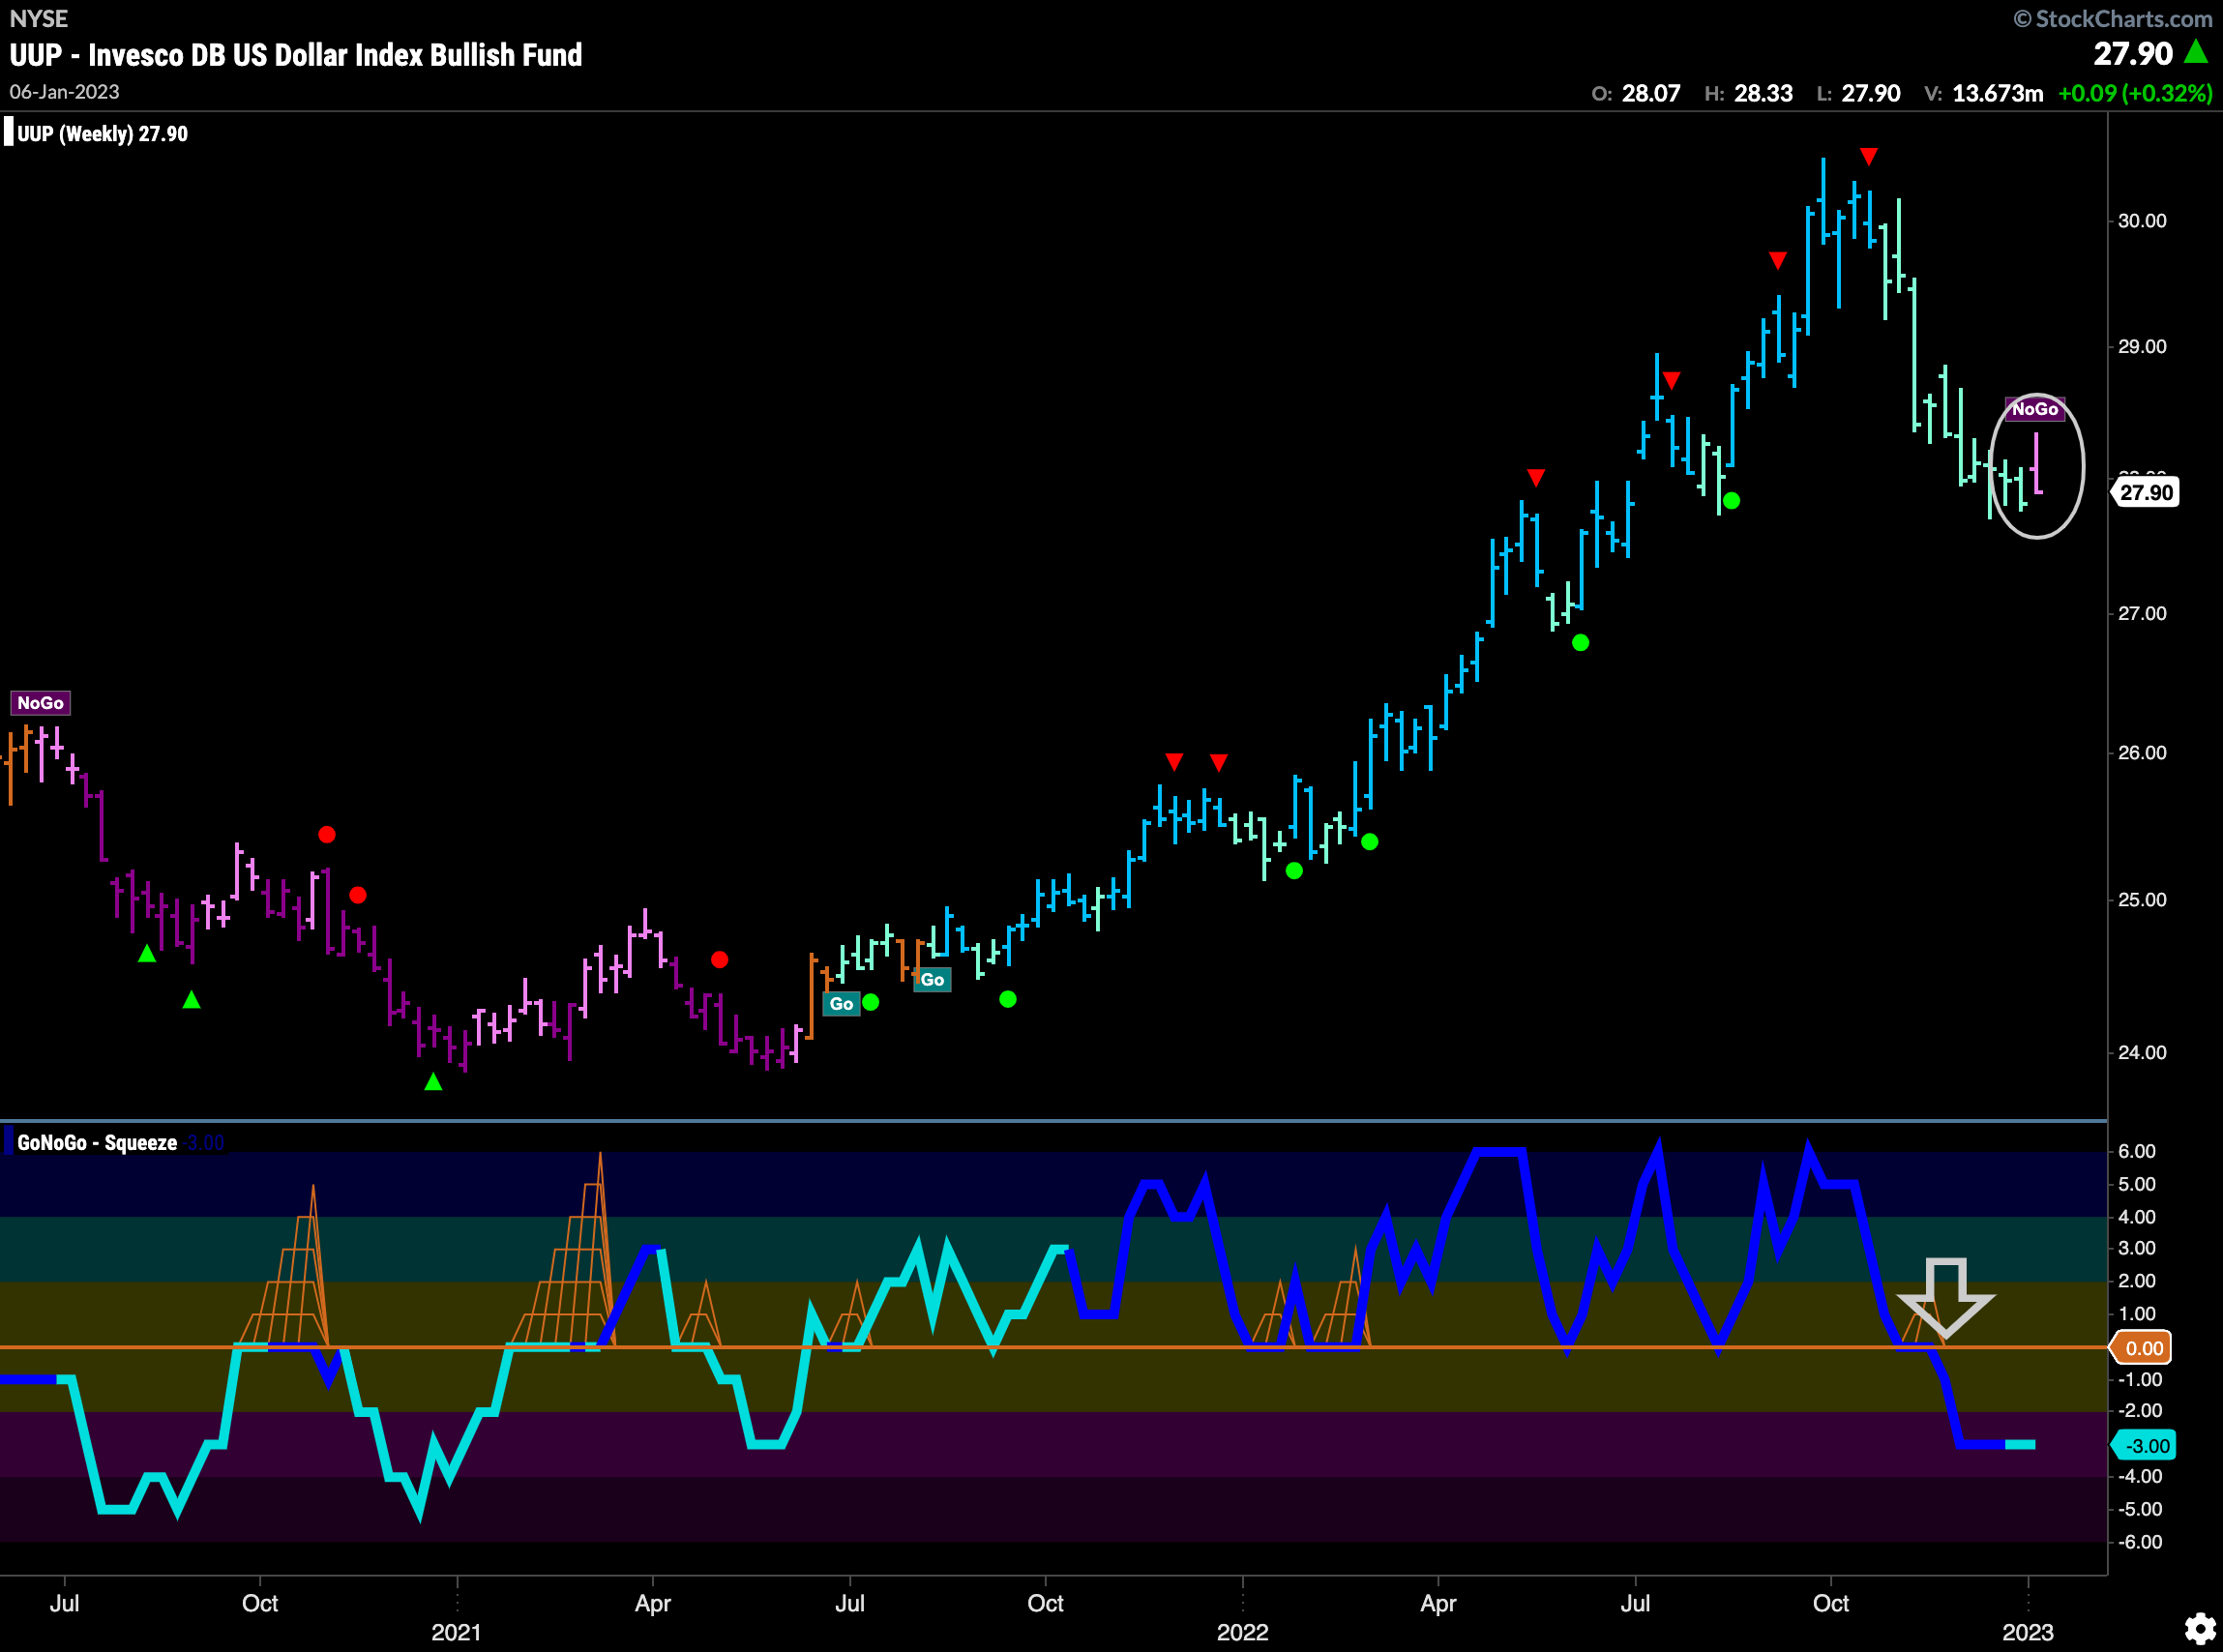
The weekly chart shows a change as GoNoGo Trend paints a pink “NoGo” bar. This is the first change in trend since July of 2021 for the U.S. dollar. This follows the GoNoGo Oscillator’s break below the zero line from several weeks ago. This would suggest that the continuation of the NoGo on the daily chart is likely.
“NoGo” in Oil Continues Unconvincingly
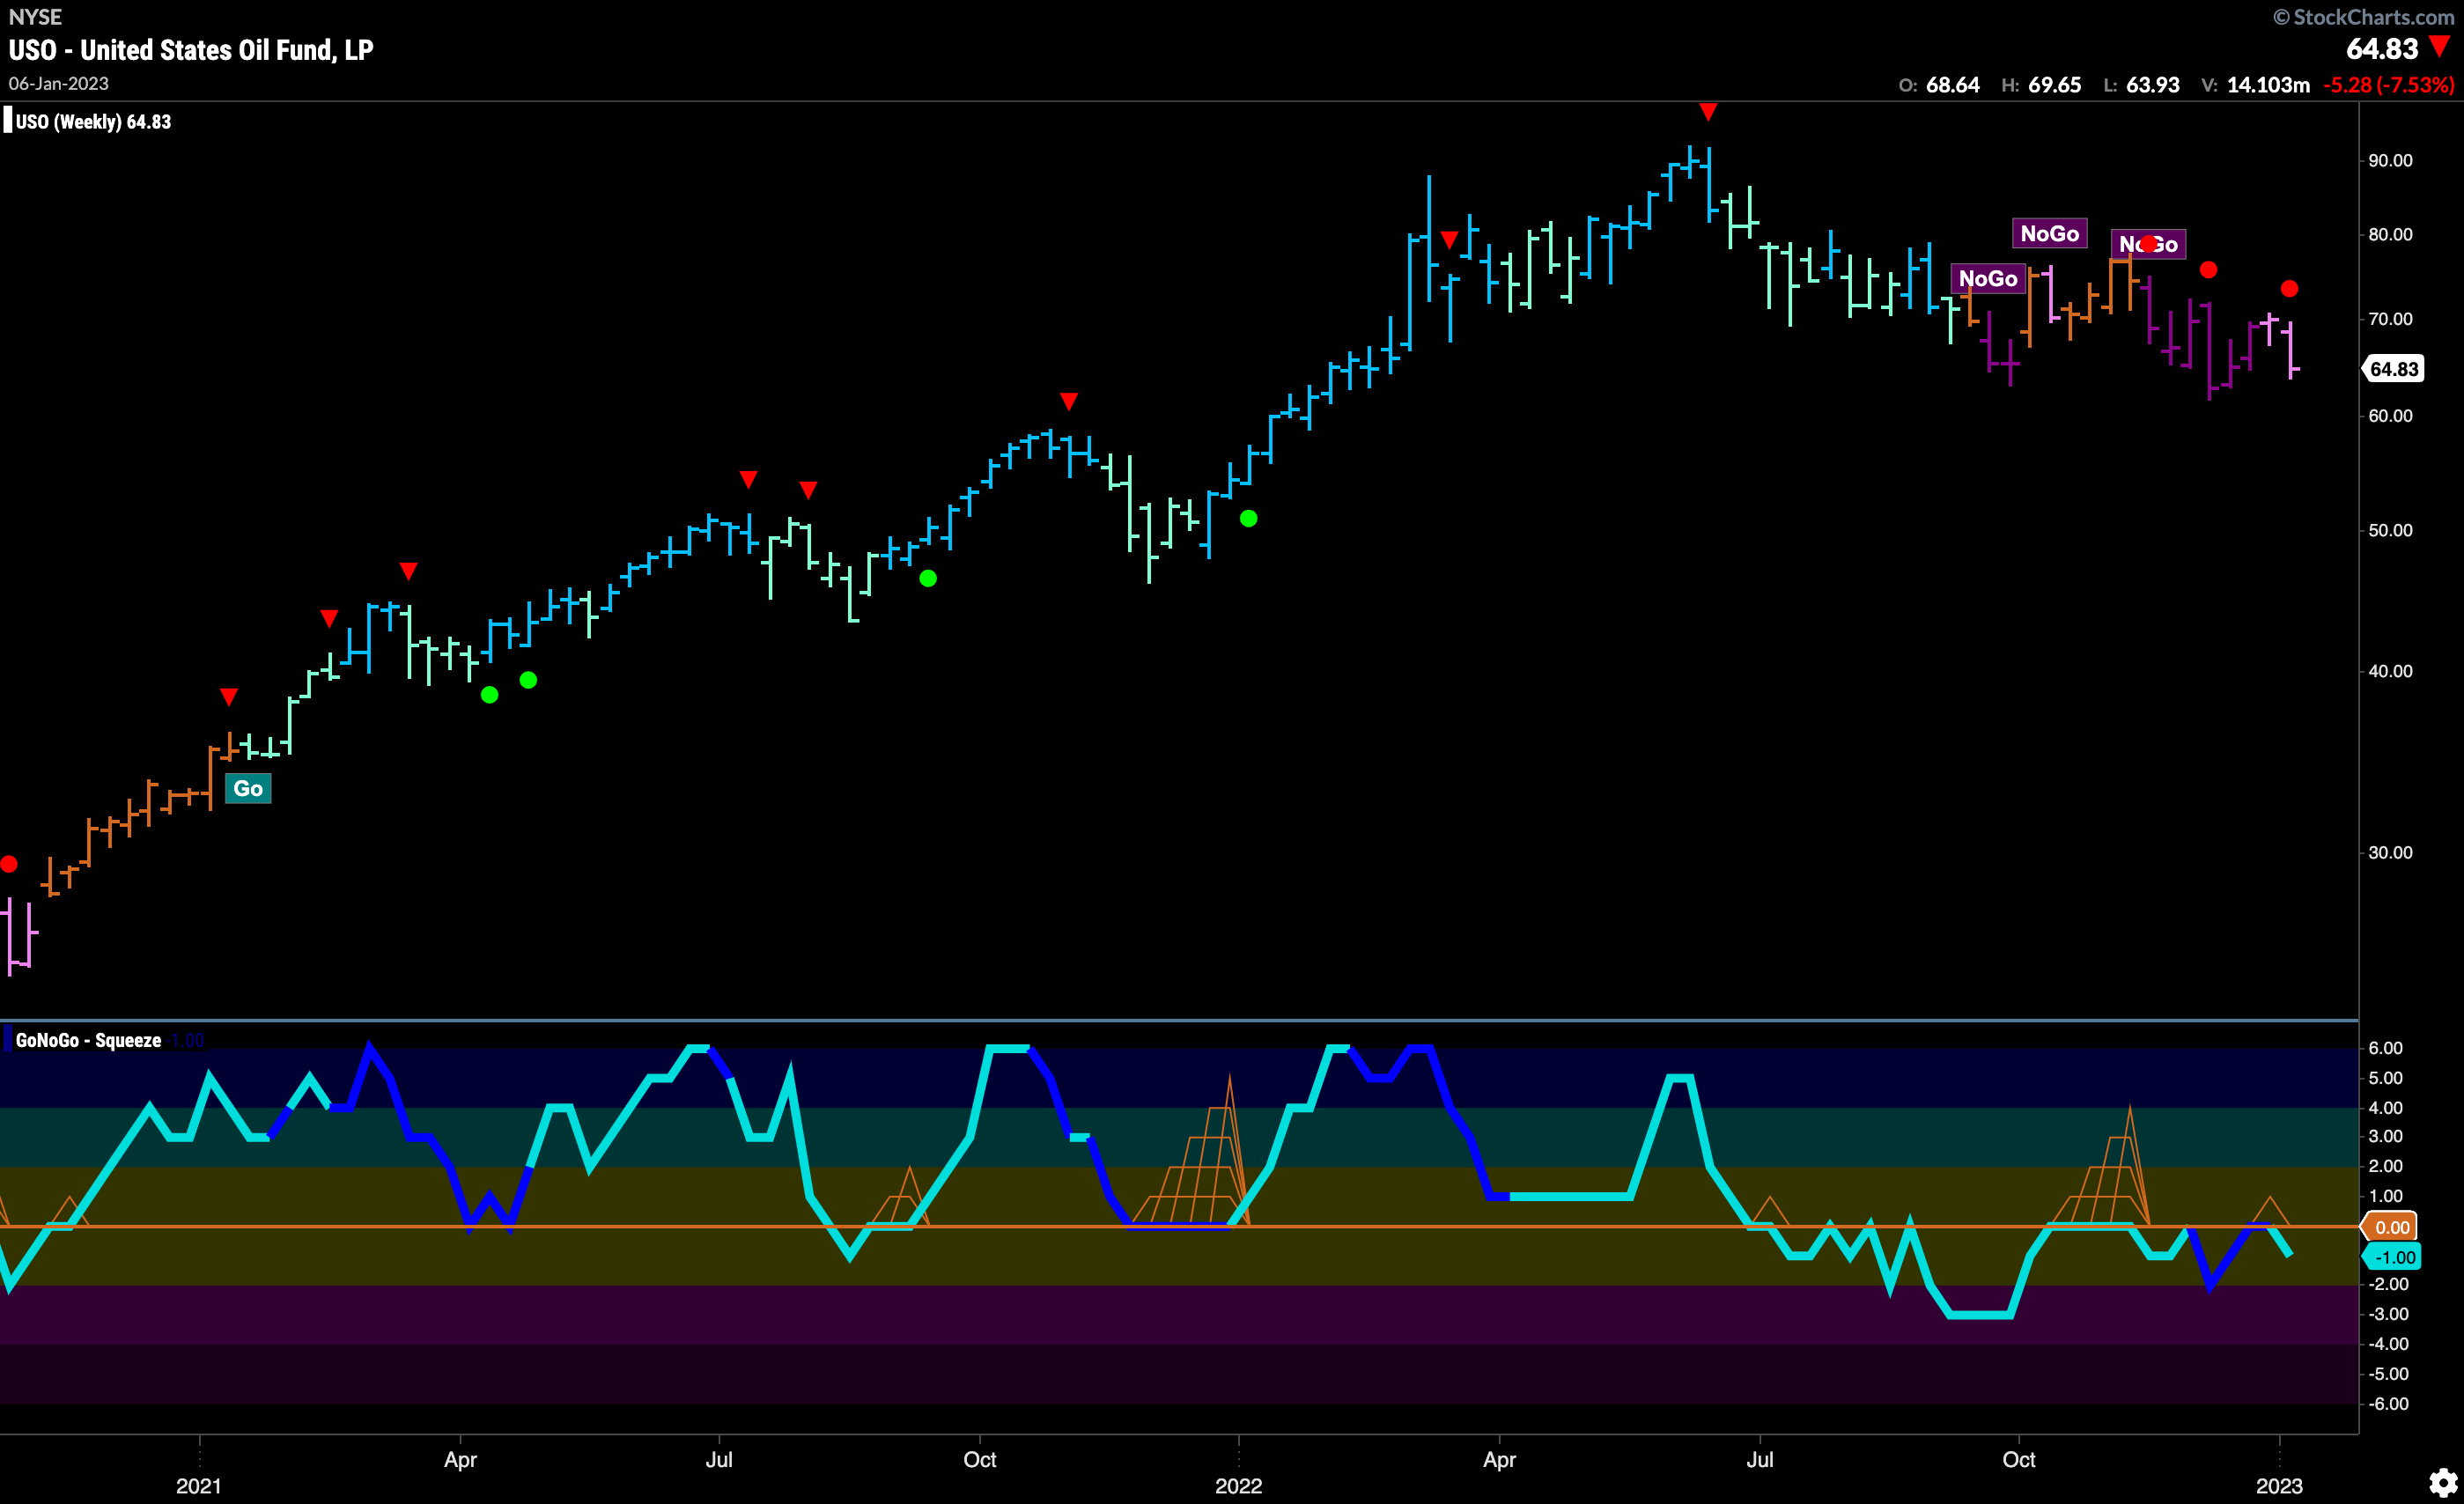
The “NoGo” remains in place but GoNoGo Trend paints a weaker pink “NoGo” bar this week. Although there hasn’t been much price deterioration the “NoGo” now has been uninterrupted for several weeks. Since July of last year, GoNoGo Oscillator has been below or finding resistance at the zero line and that confirms the slight bearishness. If GoNoGo Oscillator moves significantly lower we can expect price to make an attempt at a lower low.
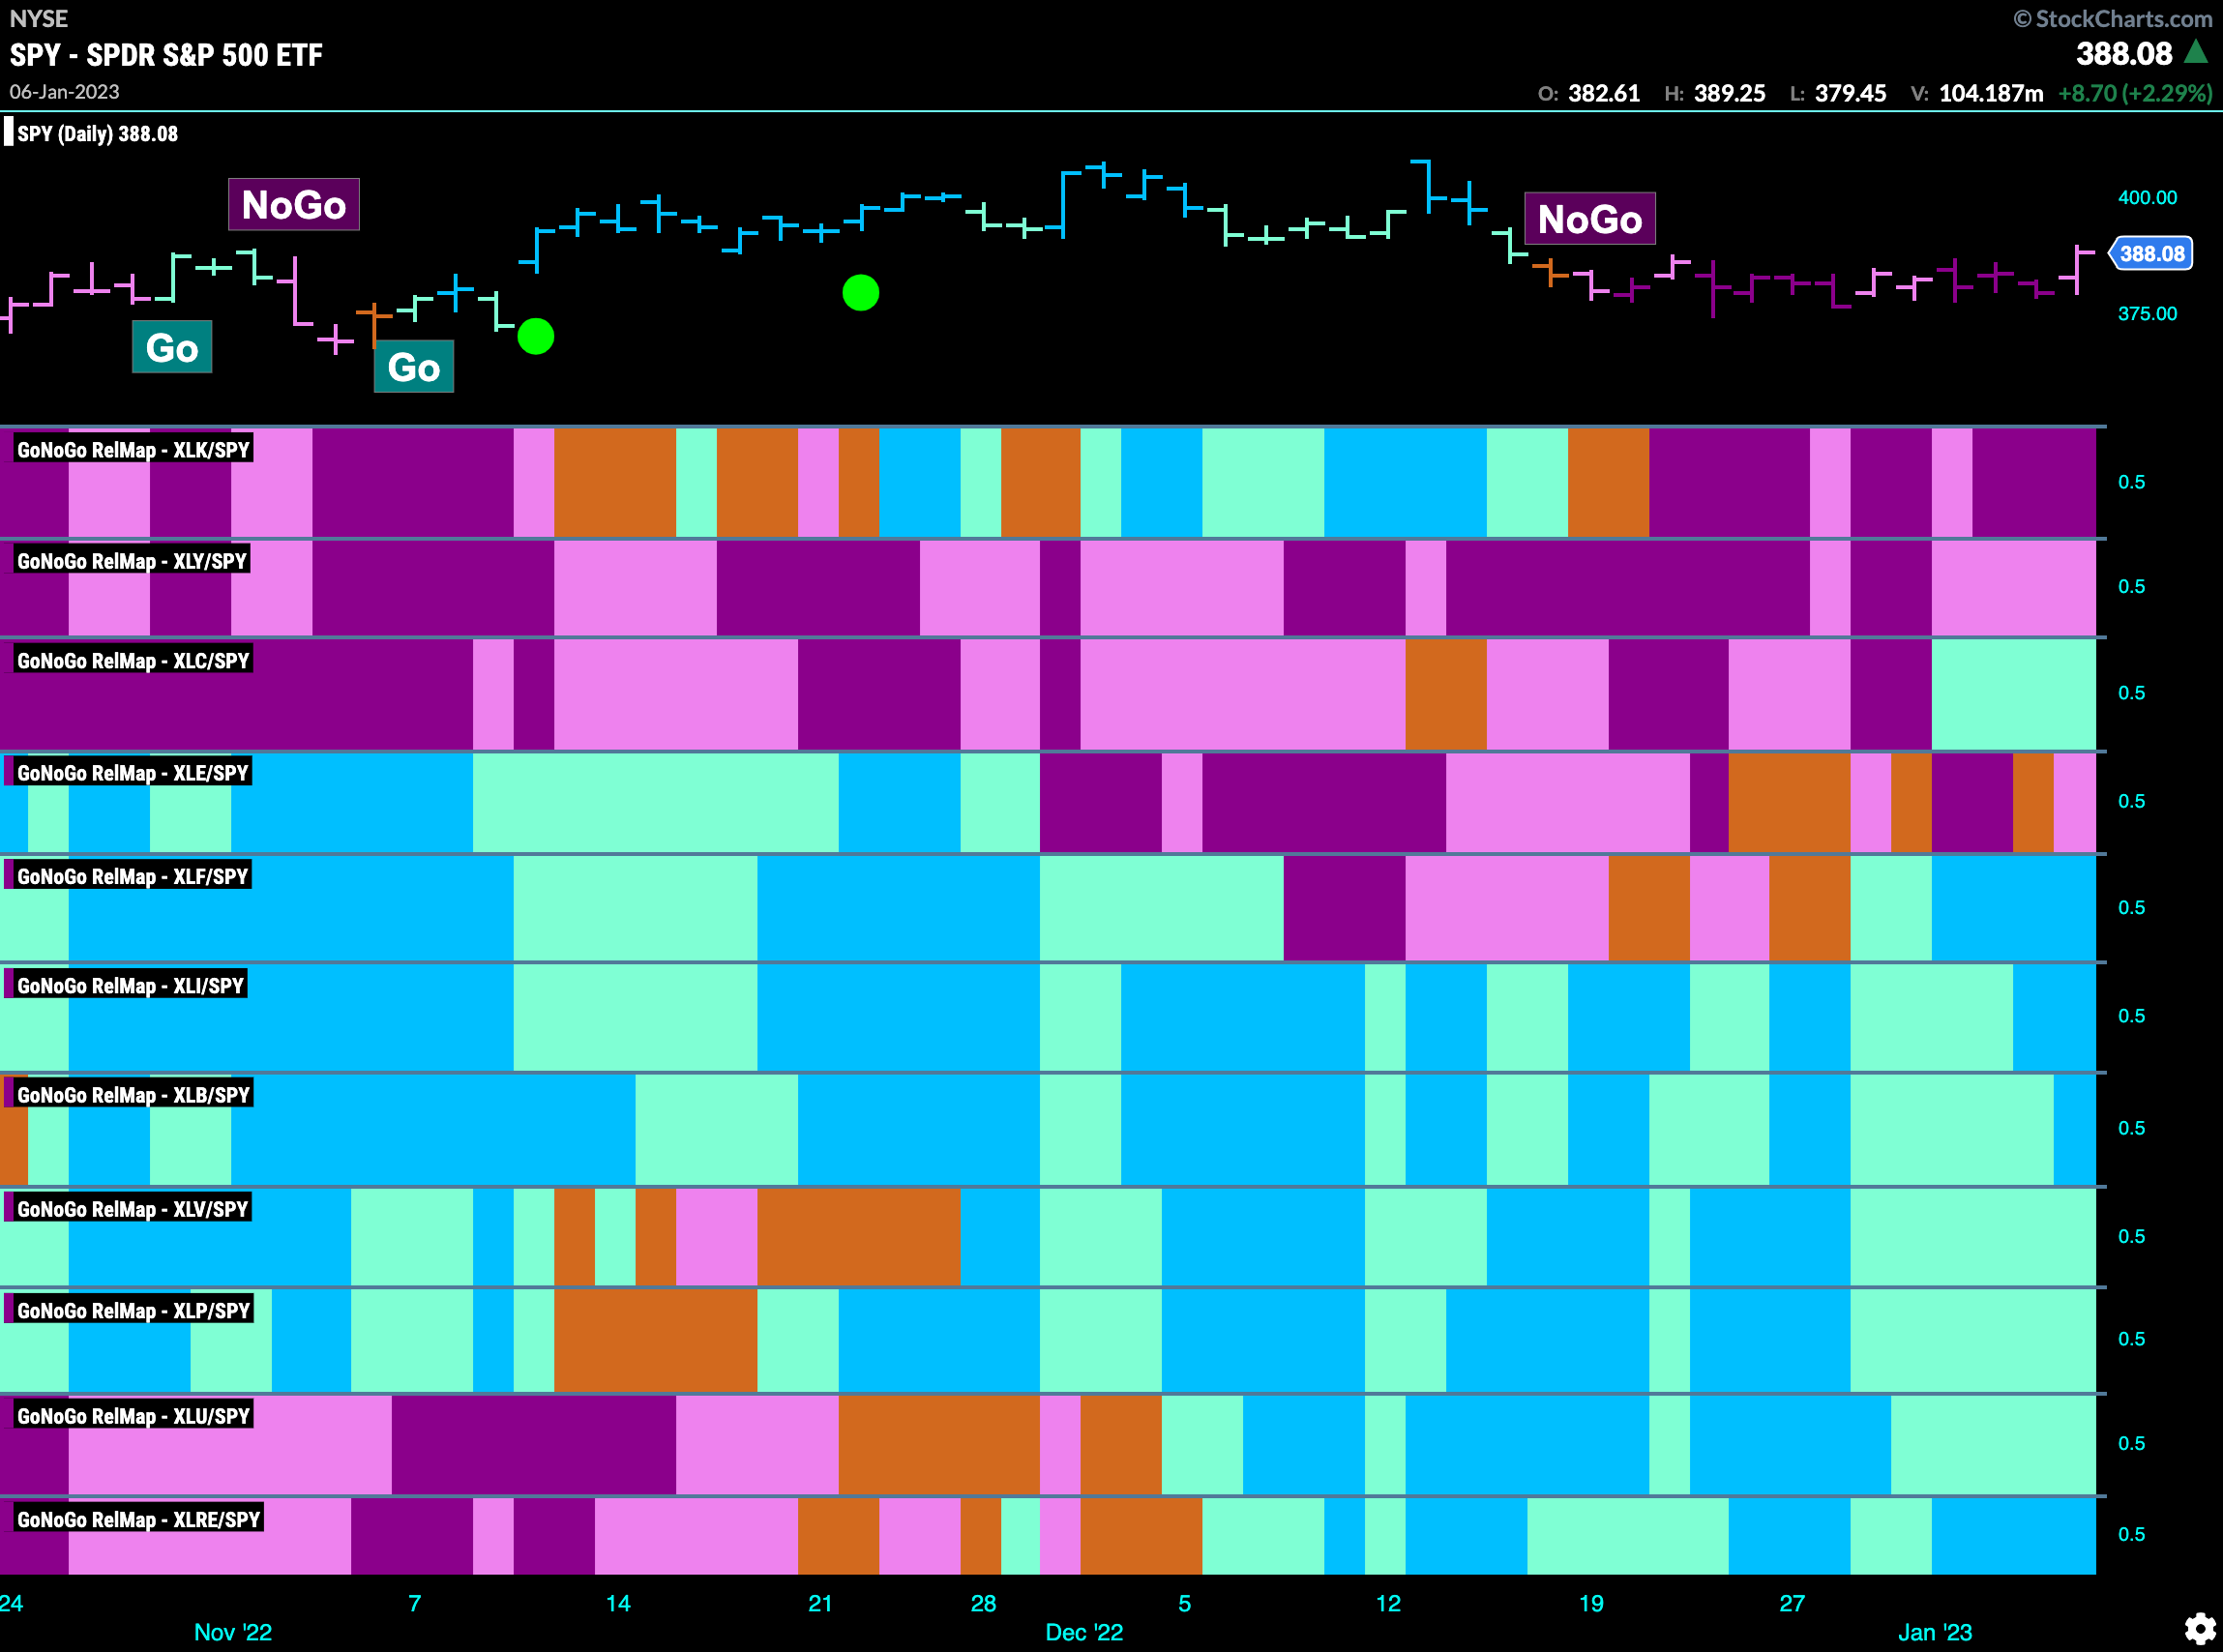
Sector RelMap
Below is the GoNoGo Sector RelMap. This GoNoGo RelMap applies the GoNoGo Trend to the relative strength ratios of the sectors to the base index. Looking at this map, we can quickly see where the relative outperformance is coming from as well as which sectors are lagging on a relative basis. 8 sectors are outperforming the base this week. $XLC, $XLF, $XLI, $XLB, $XLV, $XLP, $XLU, and $XLRE, are painting “Go” bars.
$XLF Flags New “Go” Bar on Weekly Chart
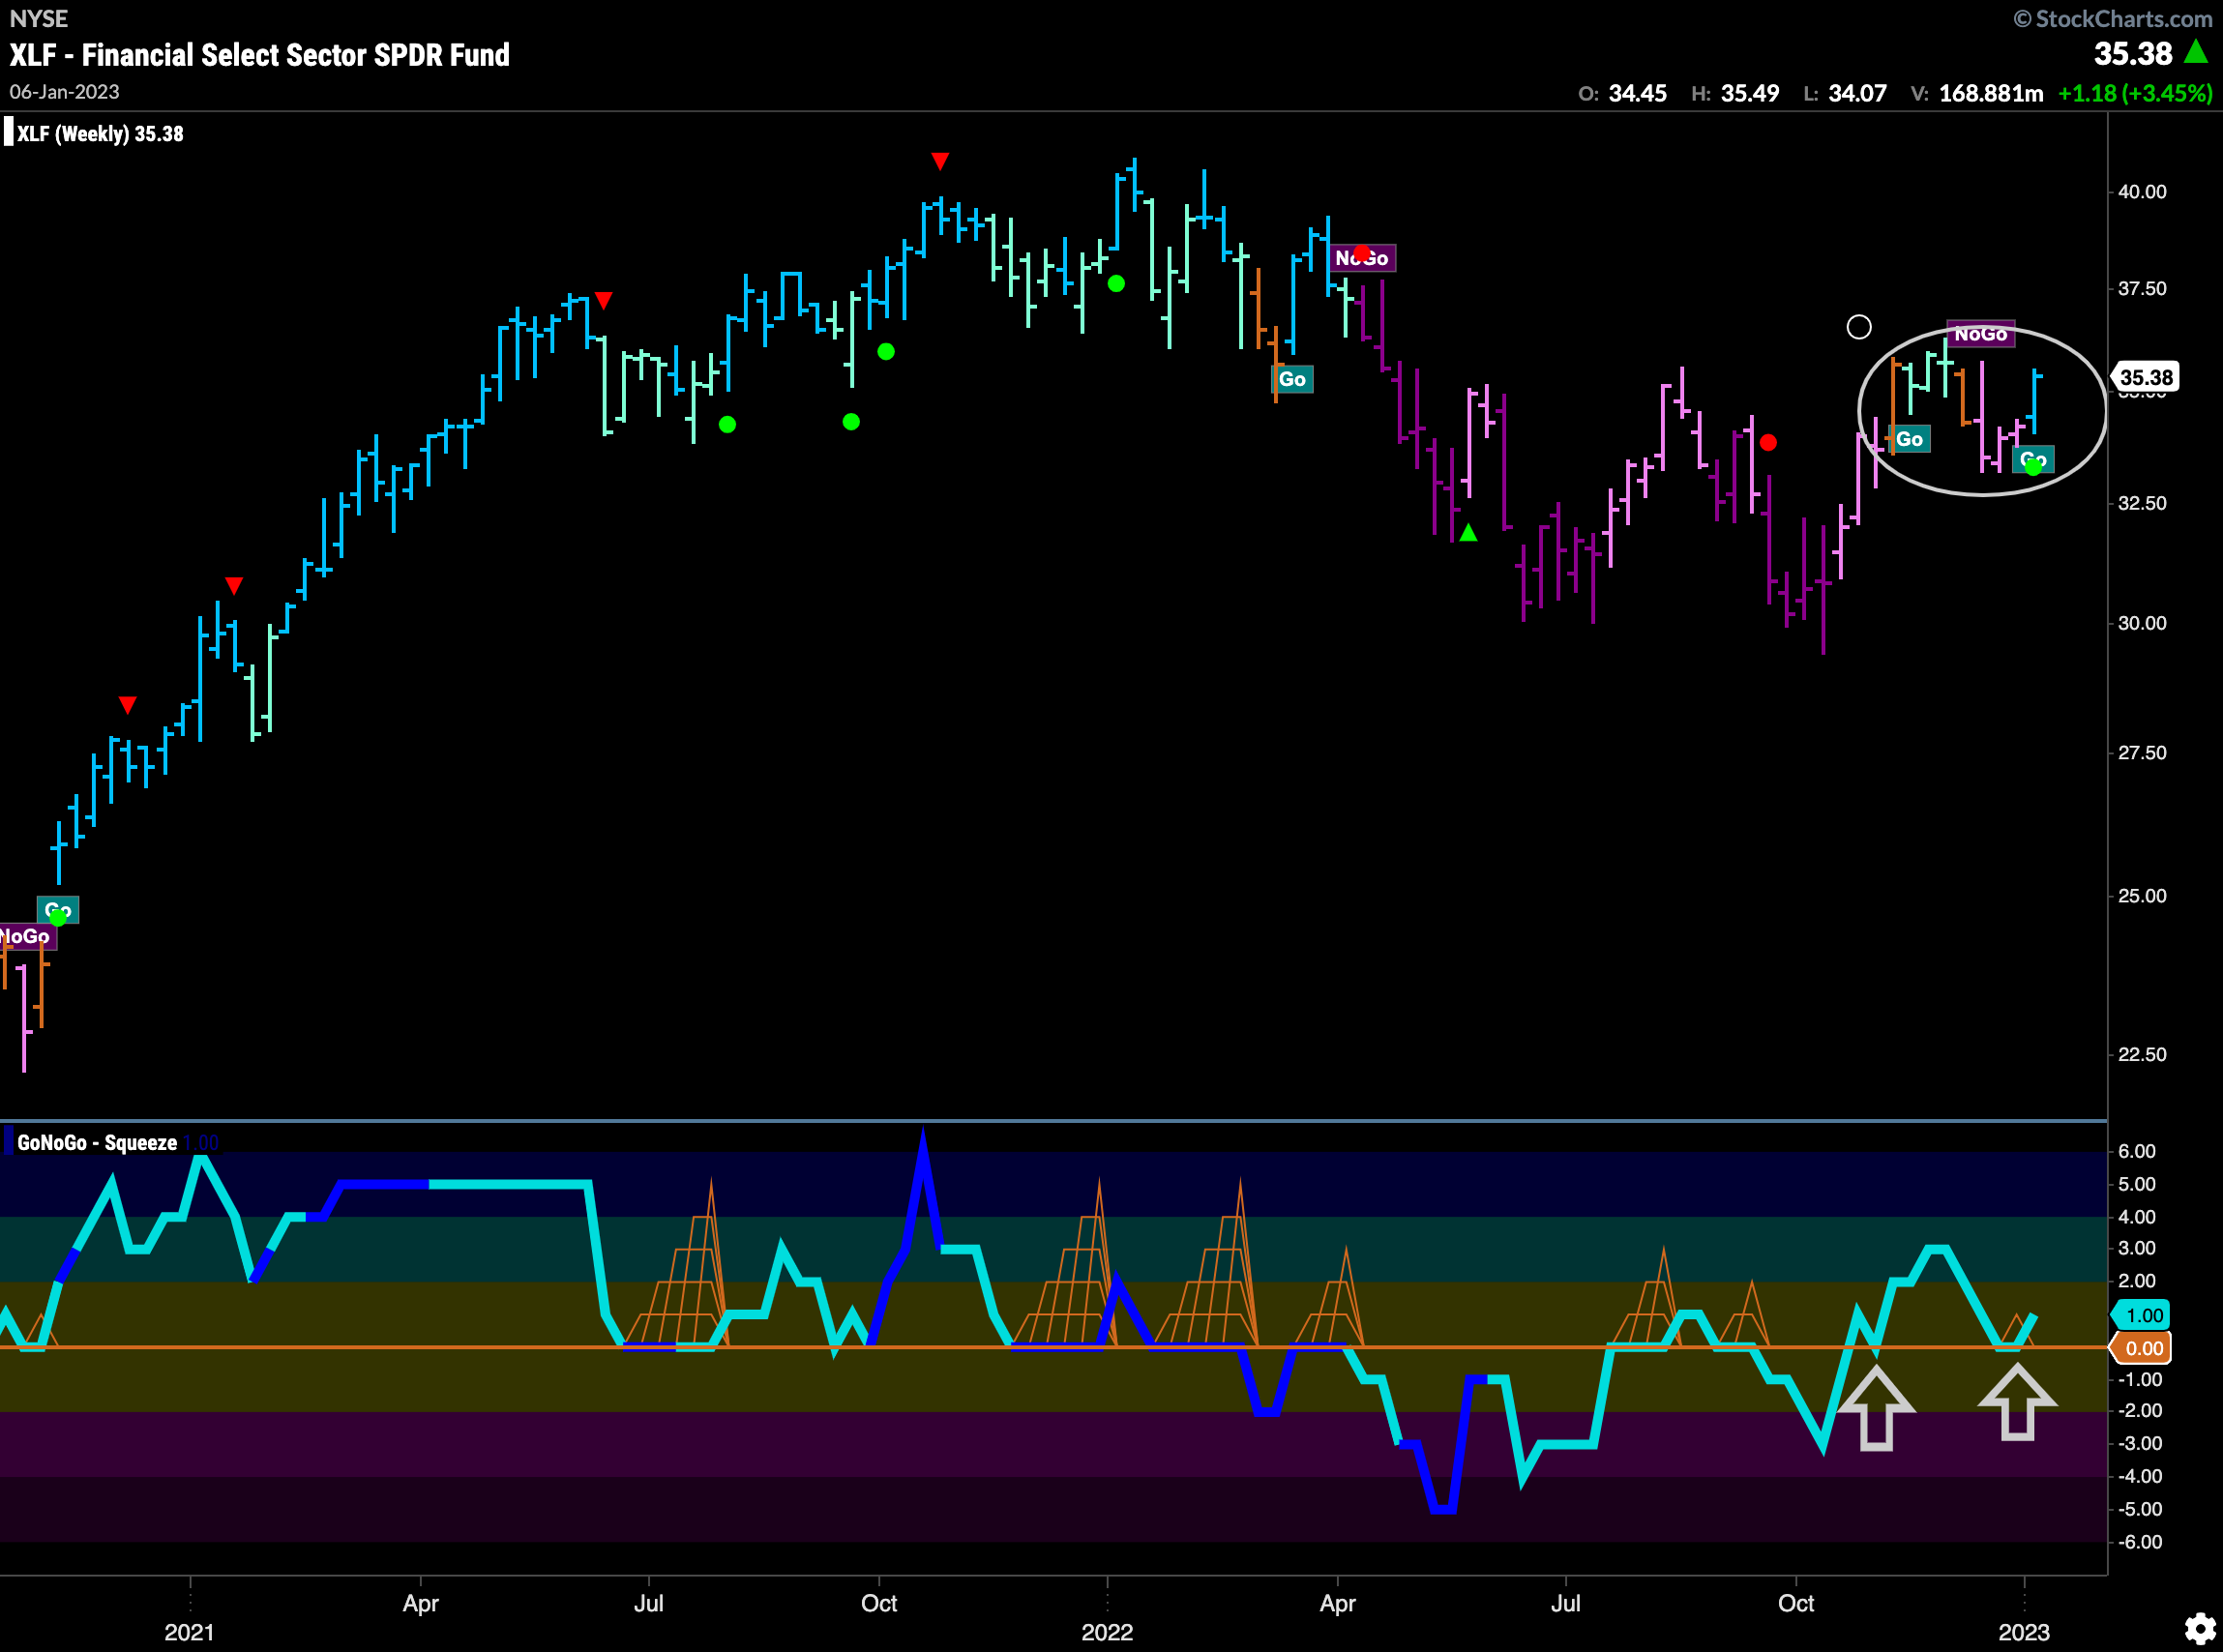
The chart below shows $XLF entering a fresh “Go” trend with a strong blue “Go” bar last week. This aligns with the Sector RelMap above that showed relative outperformance in terms of the financial sector to the base index. GoNoGo Oscillator also continues to find support at the zero line. This has happened twice recently as price has shown choppiness as the trend tries to emerge. Look for an attempt at a new intermediate high.
$JPM Taking Advantage of Financials Relative Strength
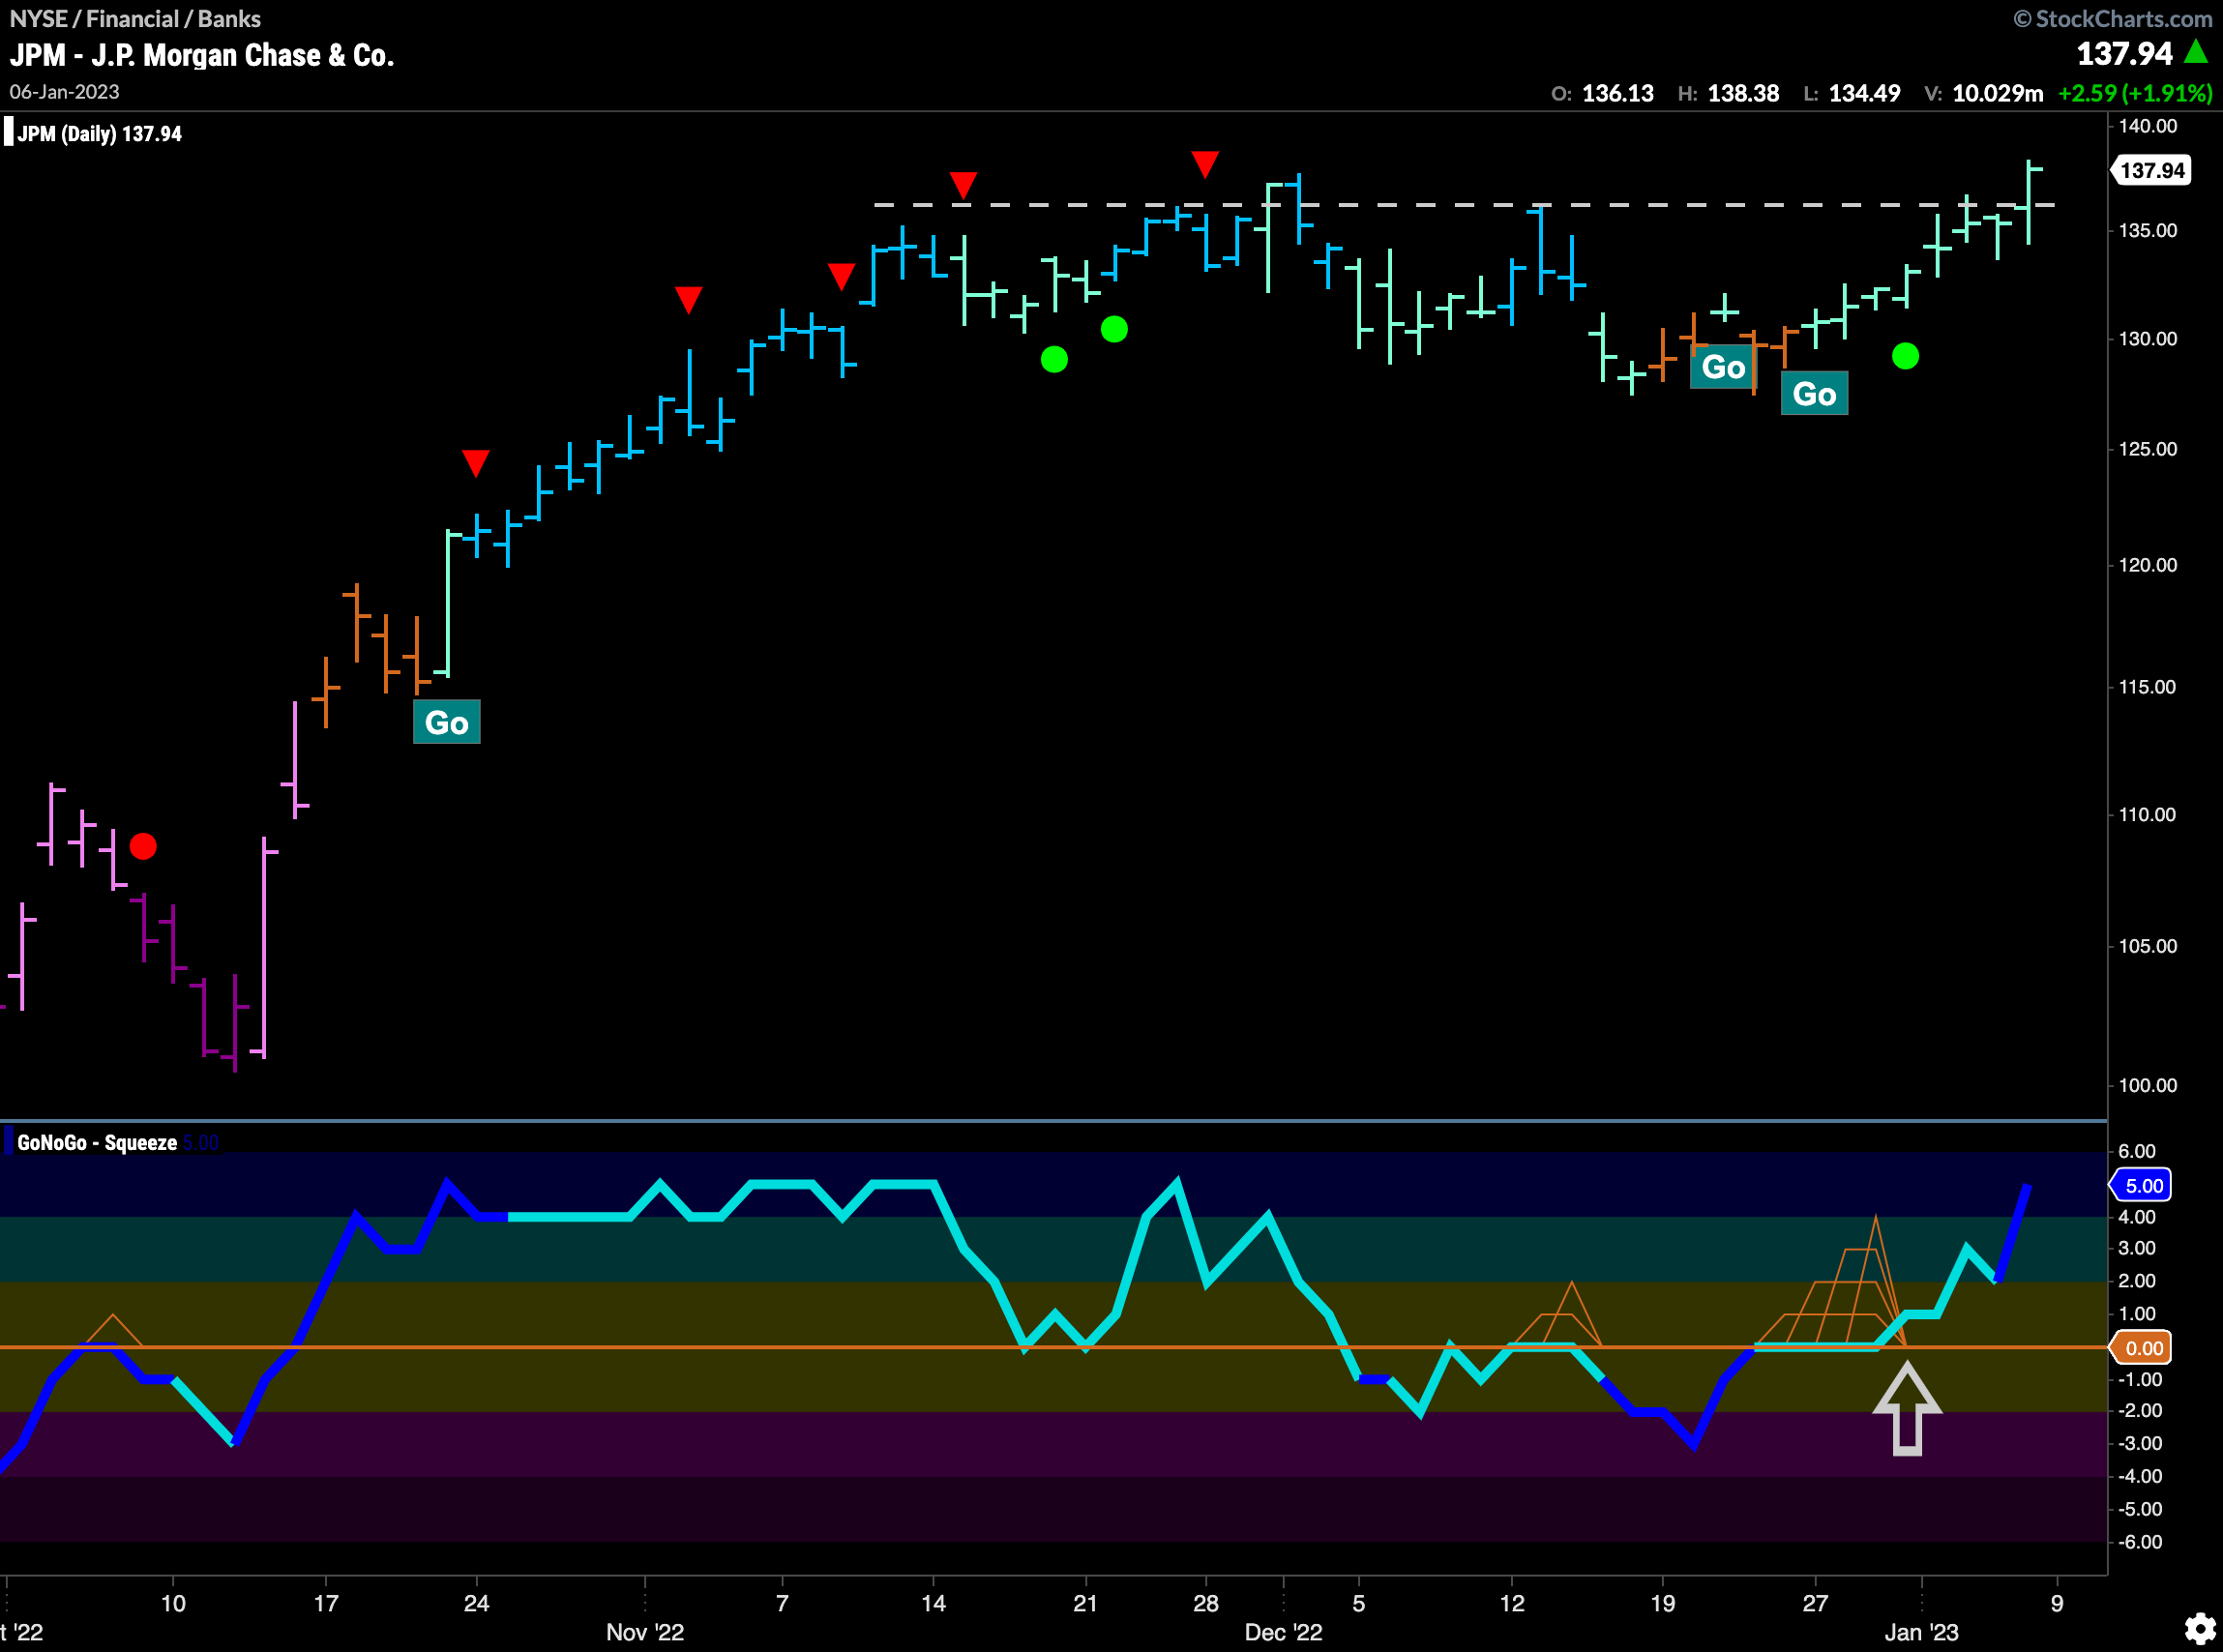
J.P Morgan Chase & Co has been fighting to hold on to its “Go” trend for several weeks. After the initial rally we have seen price move mostly sideways since the end of November. During that time GoNoGo Oscillator struggled to hold on to positive momentum and even moved below the zero line. GoNoGo Trend then painted some amber “Go Fish” bars further highlighting the difficulty the “Go” trend experienced. Now, GoNoGo Trend has been able to paint consistent “Go” bars and GoNoGo Oscillator broke back into positive territory out of a small GoNoGo Squeeze at the end of the year. Along with that, price has edged higher than the horizontal resistance we see on the chart.
