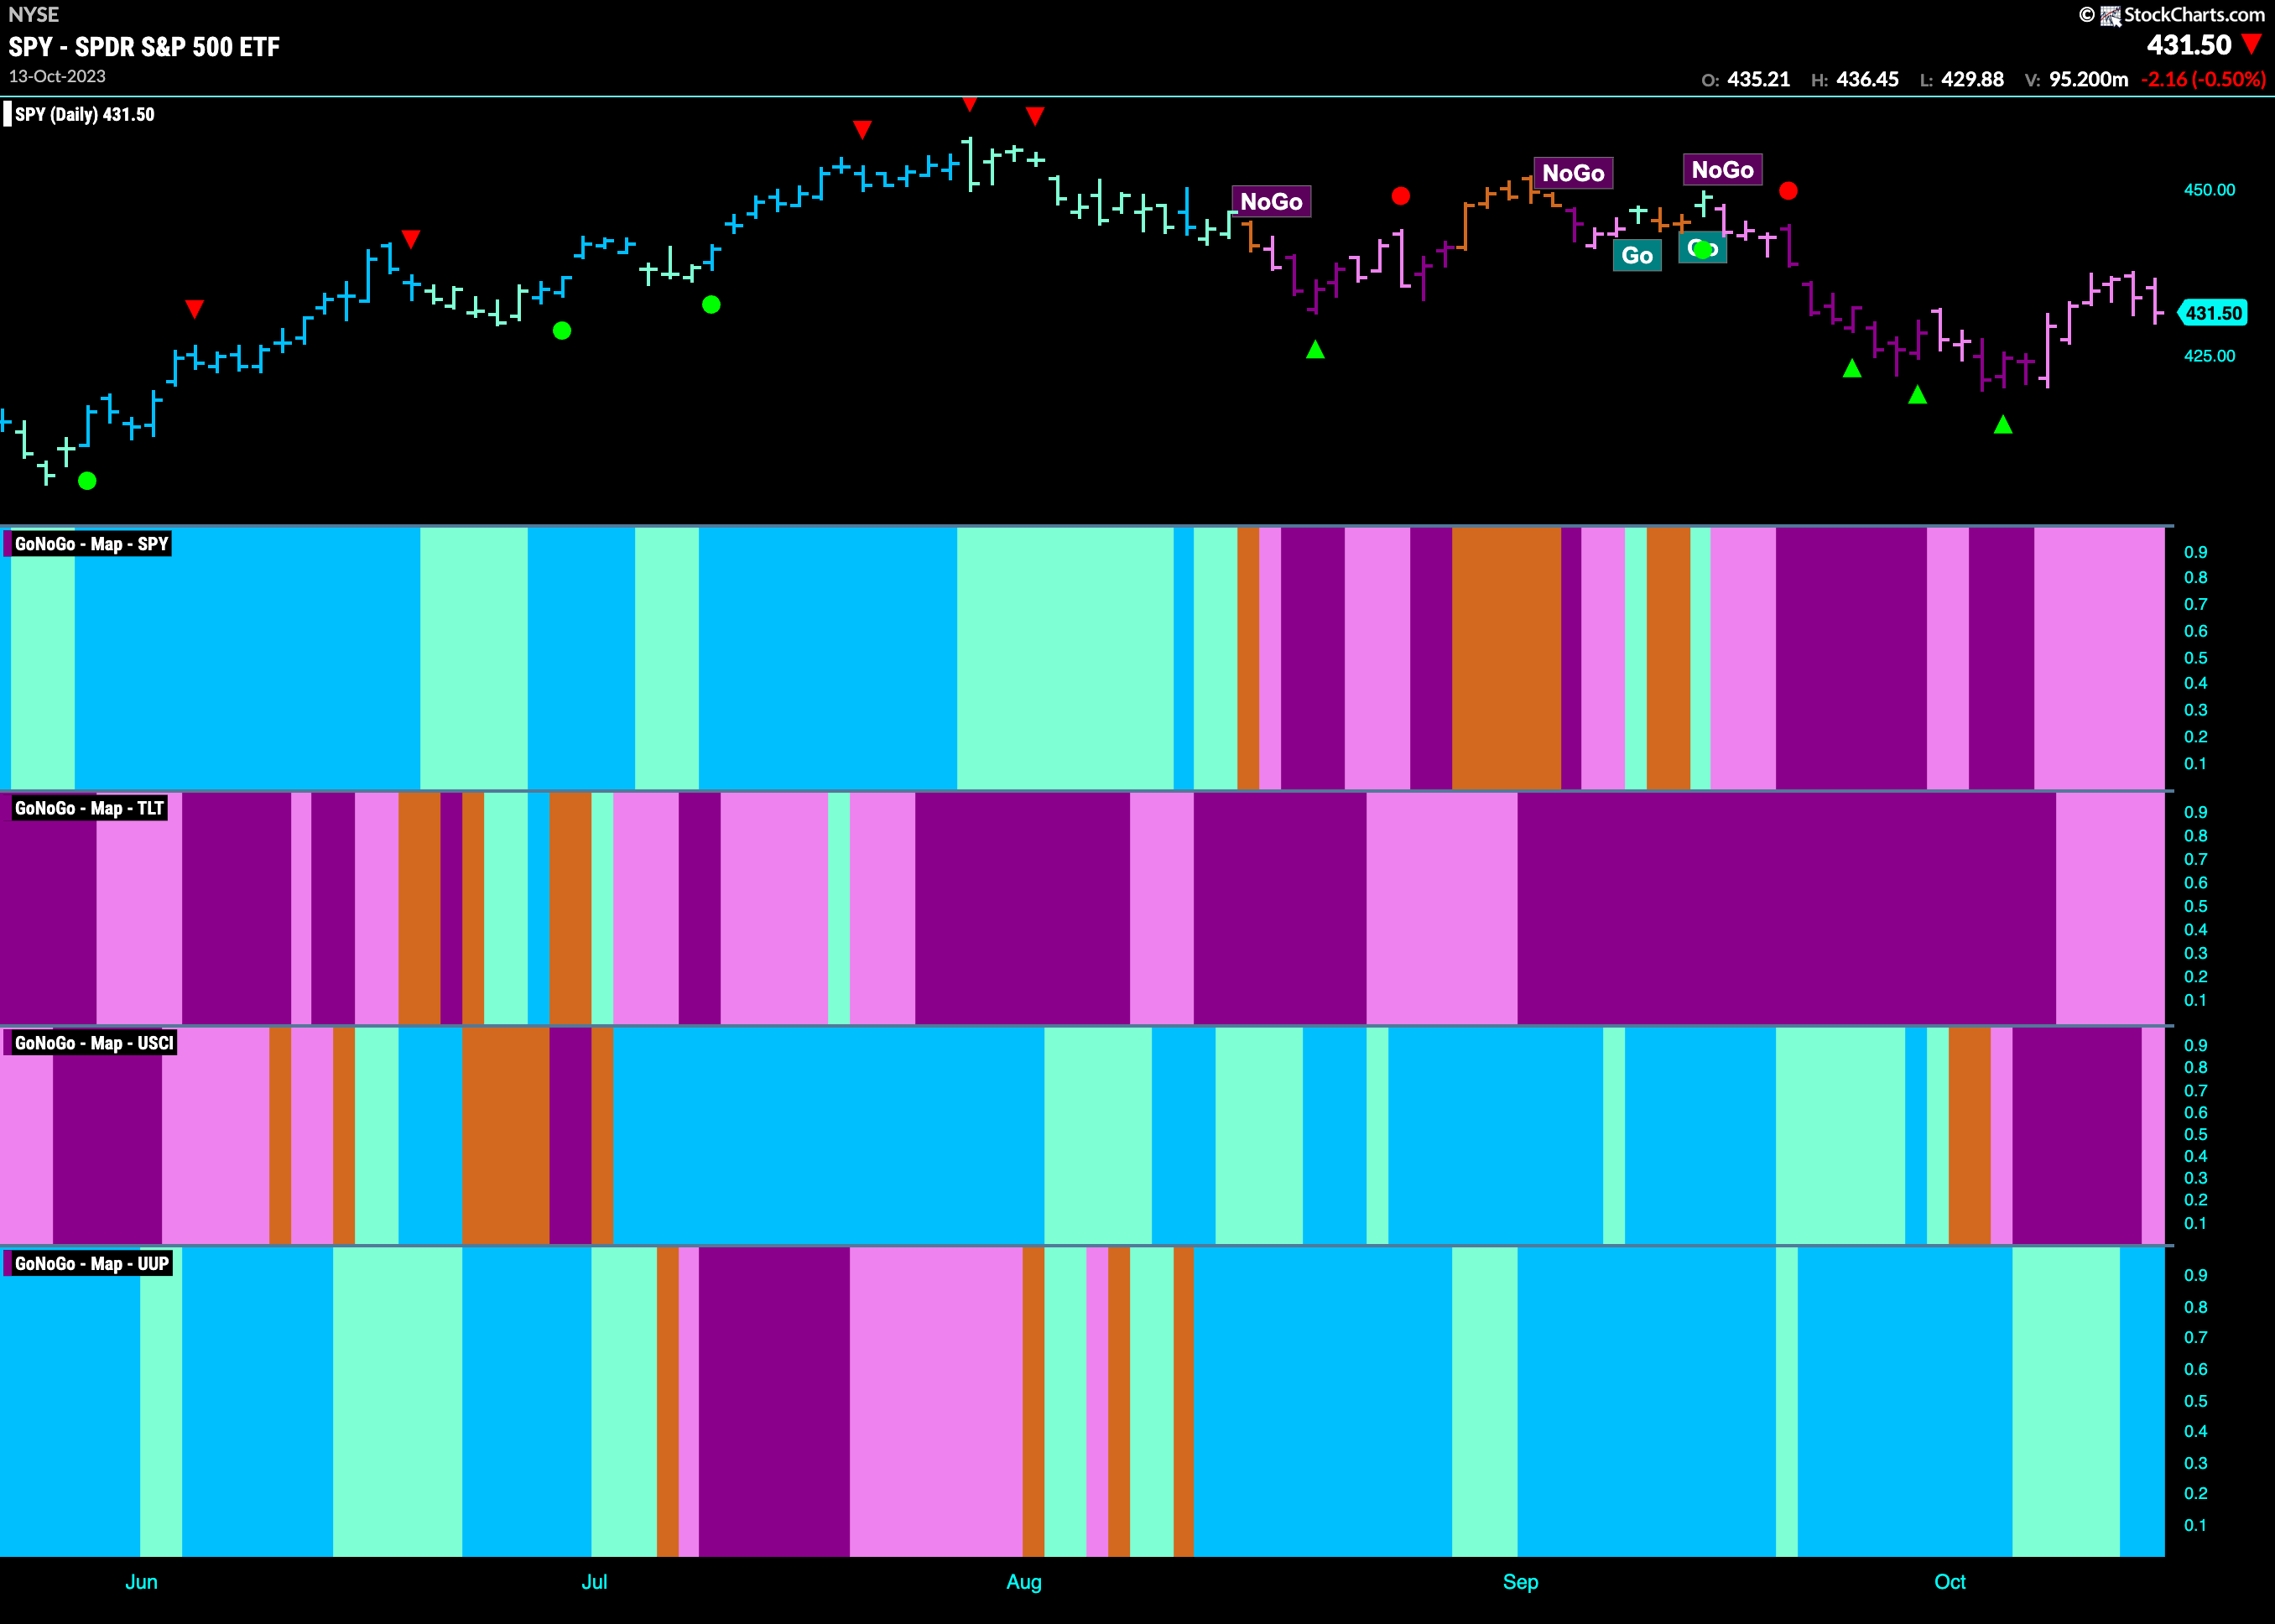
Good morning and welcome to this week’s Flight Path. The “NoGo” continued for another week, although there was a real attempt to rally after the strength we saw on the previous Friday. This led to GoNoGo Trend painting weaker pink bars. However, as last week ended prices fell away once more. Treasury bond prices likewise remained in a “NoGo” trend but we saw some weaker pink bars as well. U.S. commodities continued to paint mostly strong “NoGo” bars last week but even here we saw a little weakness as the week came to a close. The dollar saw renewed strength as its “Go” trend moved from aqua to blue bars.
Equities Remain in “NoGo”
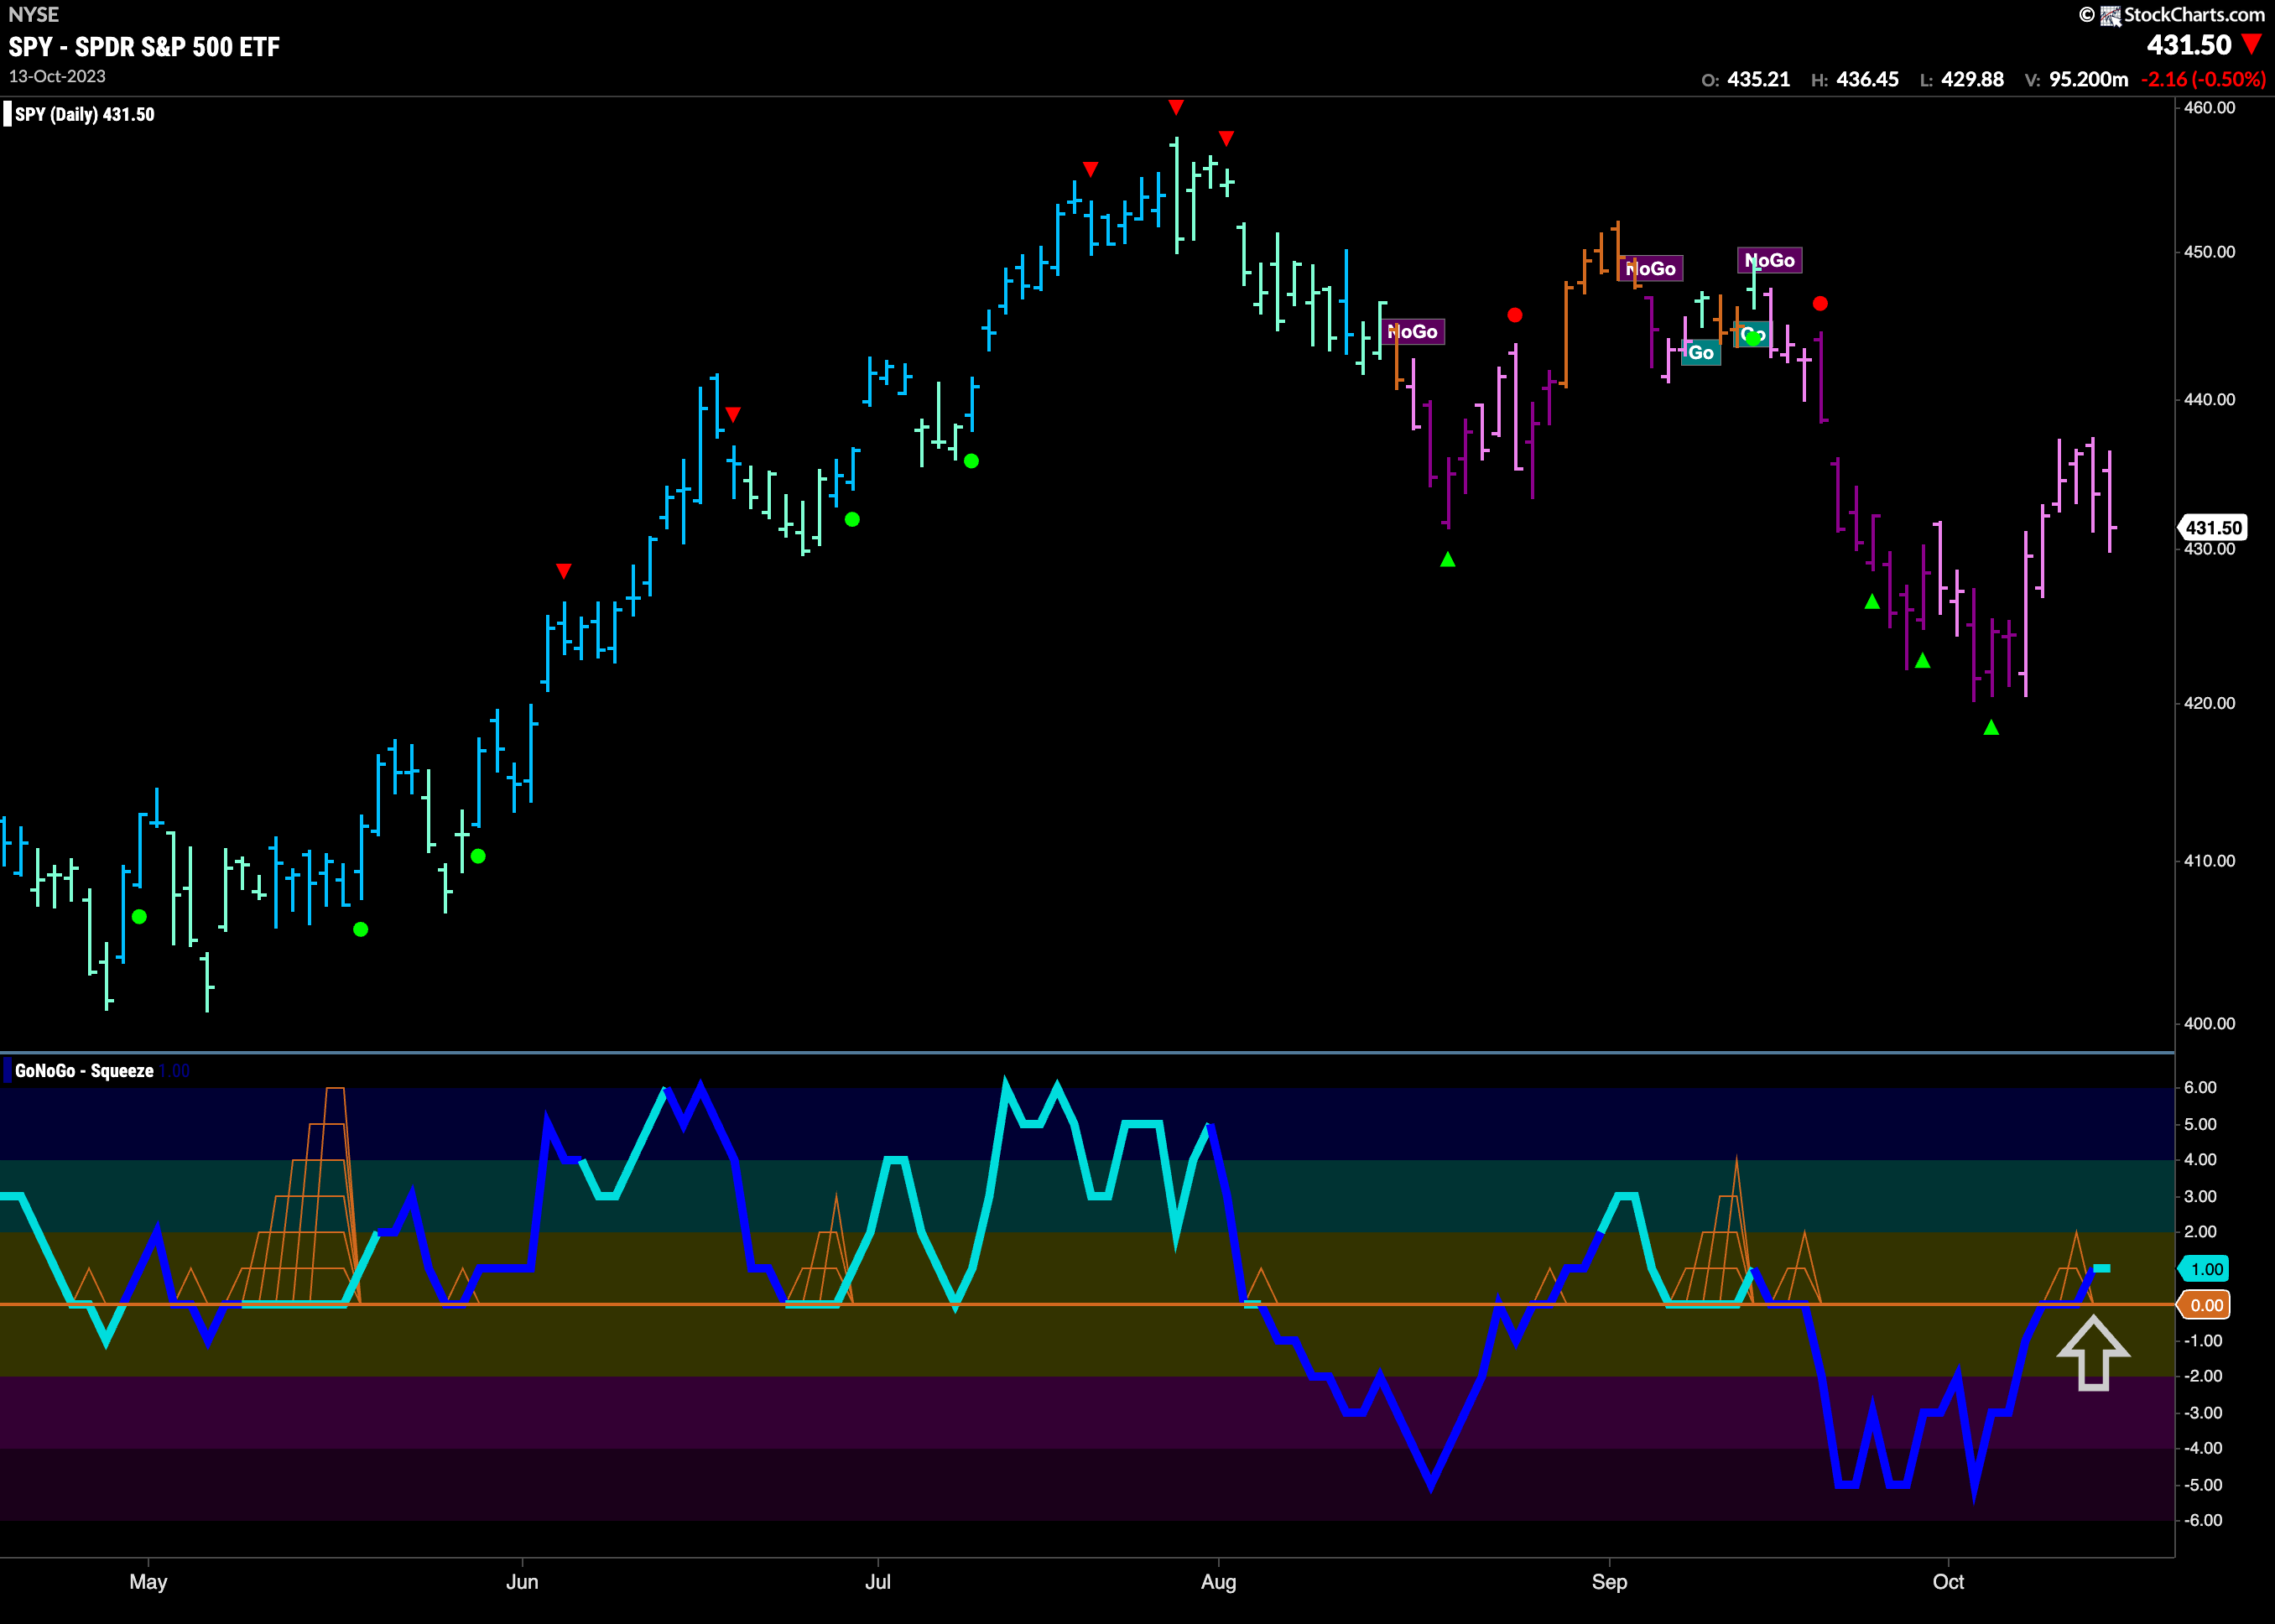
GoNoGo Trend painted pink bars all week as the trend remained a “NoGo”. GoNoGo Oscillator was able to break through the zero line into positive territory which is a good sign for those looking for continued price gains. This tells us that for the moment momentum is out of sync with the “NoGo” trend. We will watch to see if this next few days causes the oscillator to retreat back into negative territory of it will find support at the zero line. If it does, that may give price some cause to go higher.
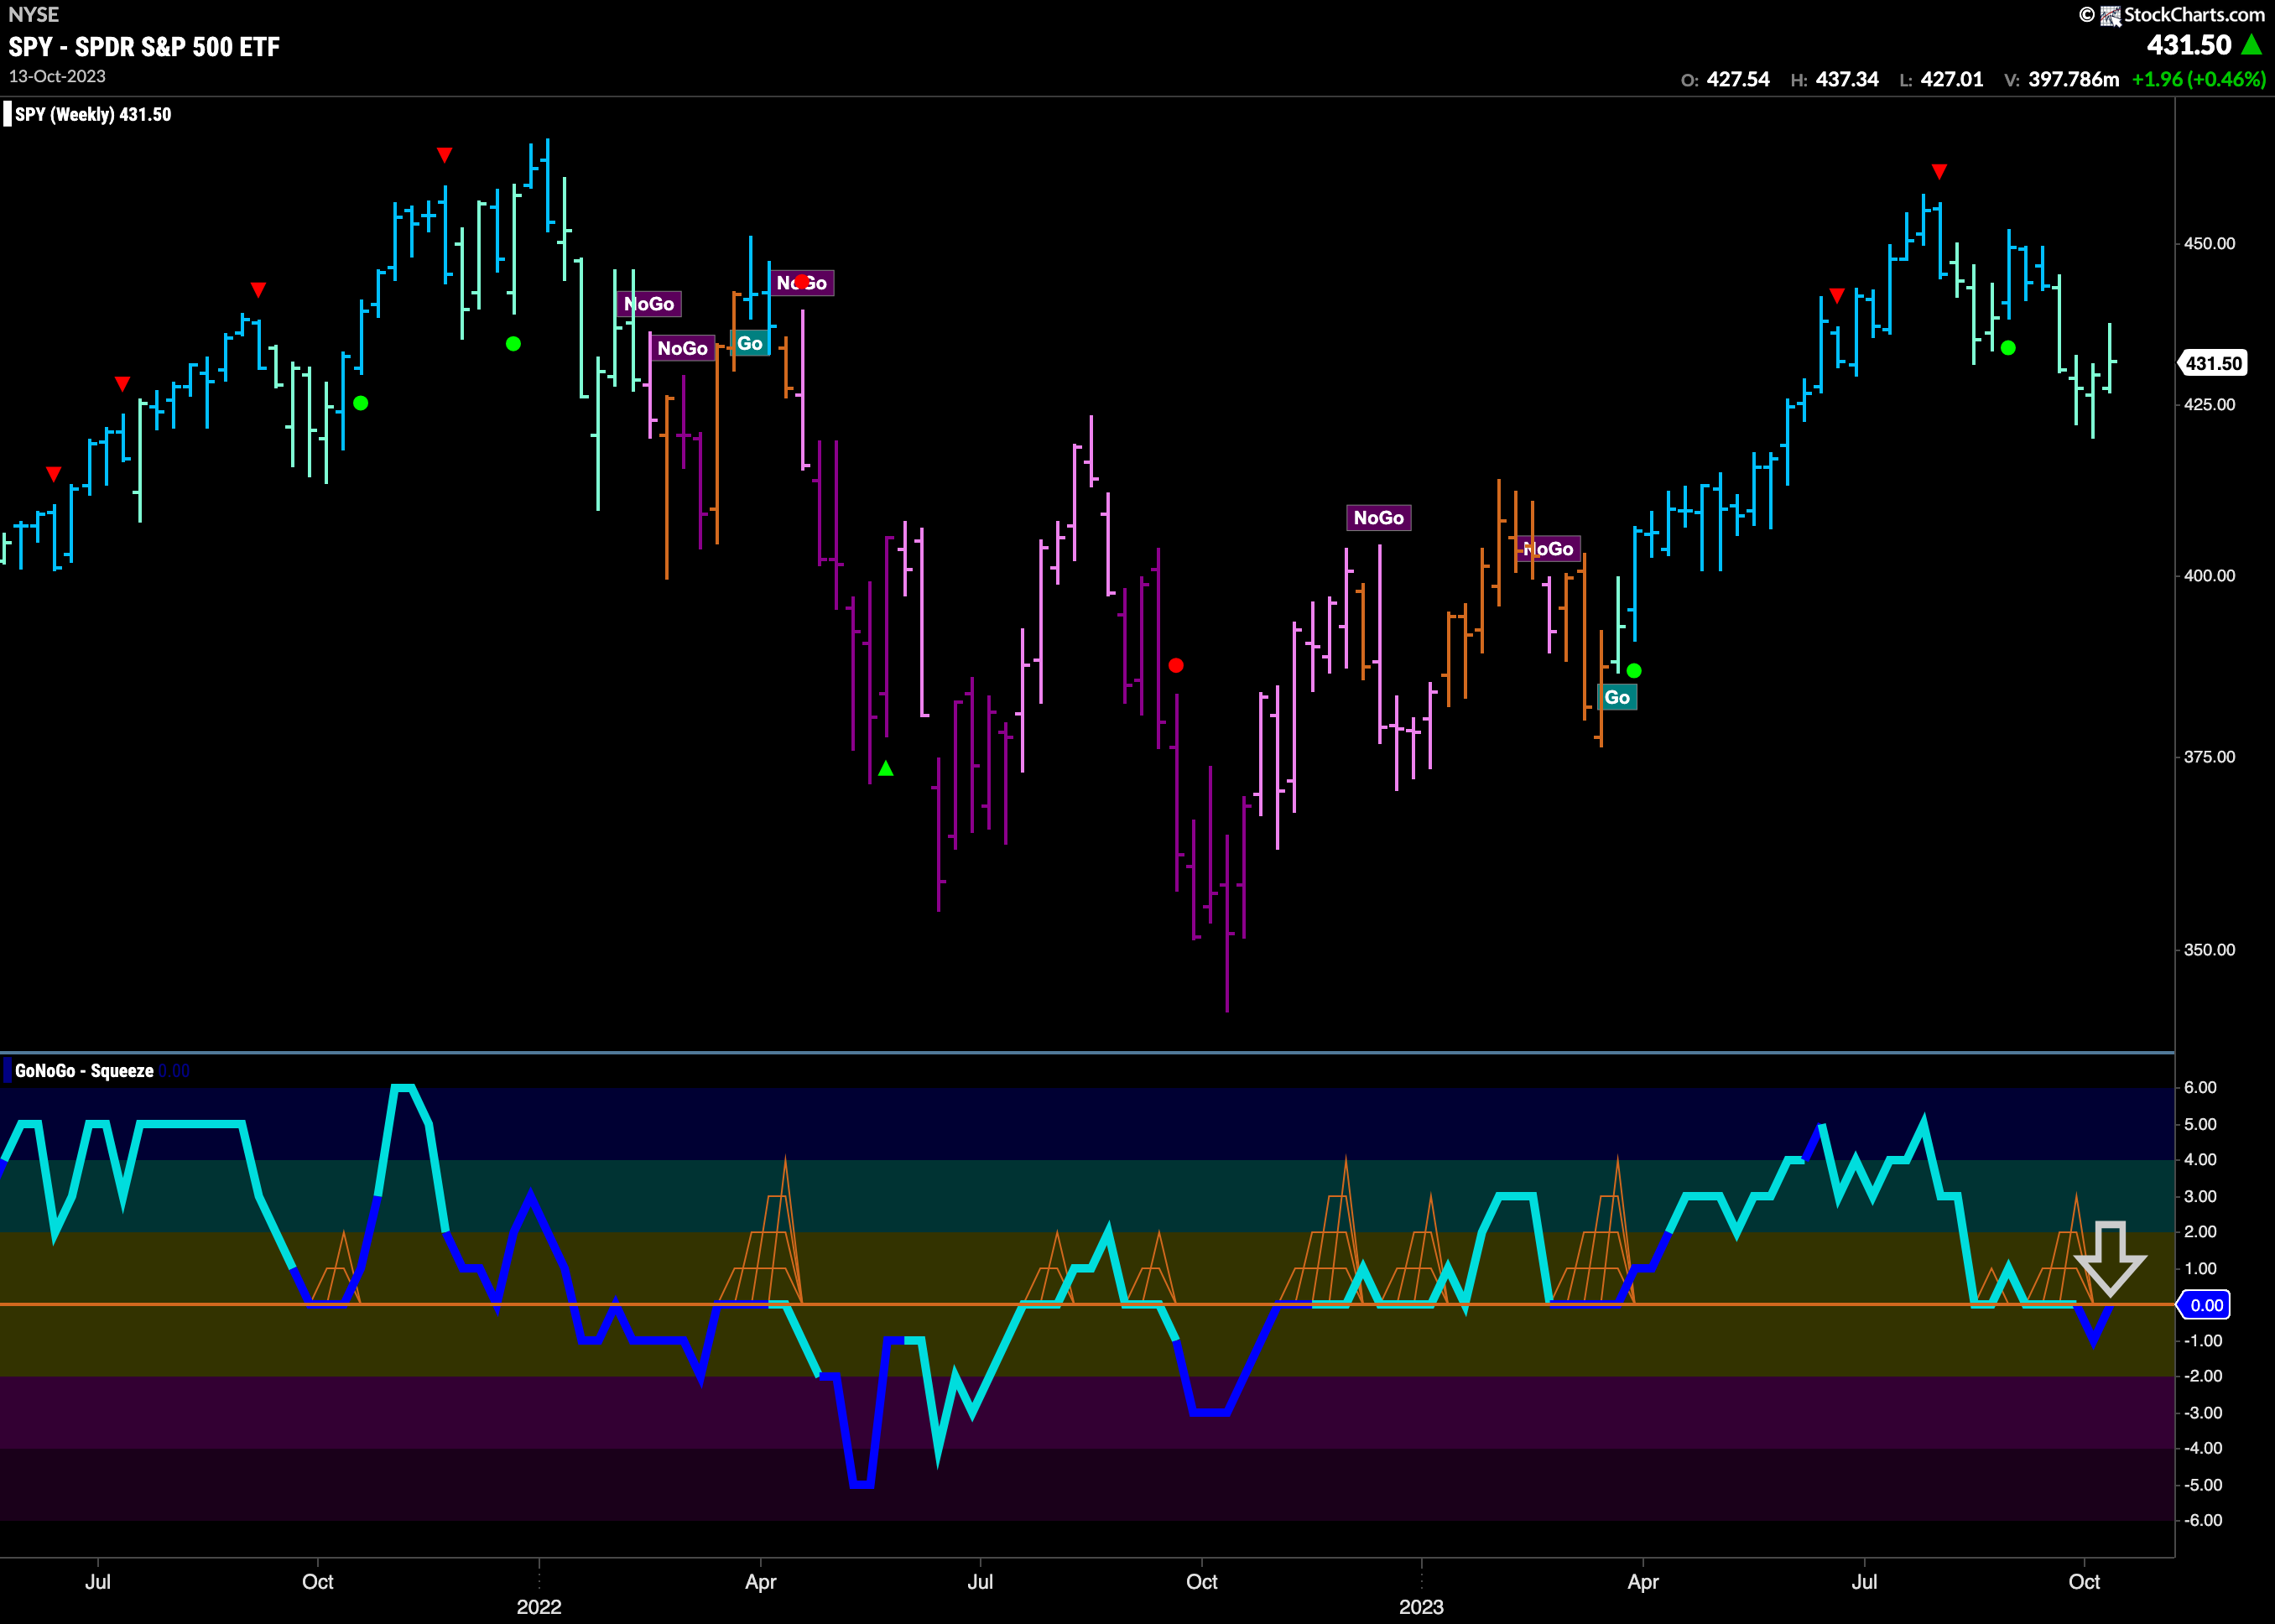
The longer term weekly chart shows that we are at an important inflection point for U.S. equities. Having pulled back significantly from the early summer high we saw a higher close last week as GoNoGo Oscillator quickly retests the zero line from below. Volume is heavy which shows strong market participation. If this longer term “Go” trend is to continue, we would like to see the oscillator regain positive territory. If this happens we would see Go Trend Continuation (green circle) suggesting that momentum is resurgent in the direction of the “Go” trend.
Treasury Rates see Go Countertrend Correction on Weekly Chart
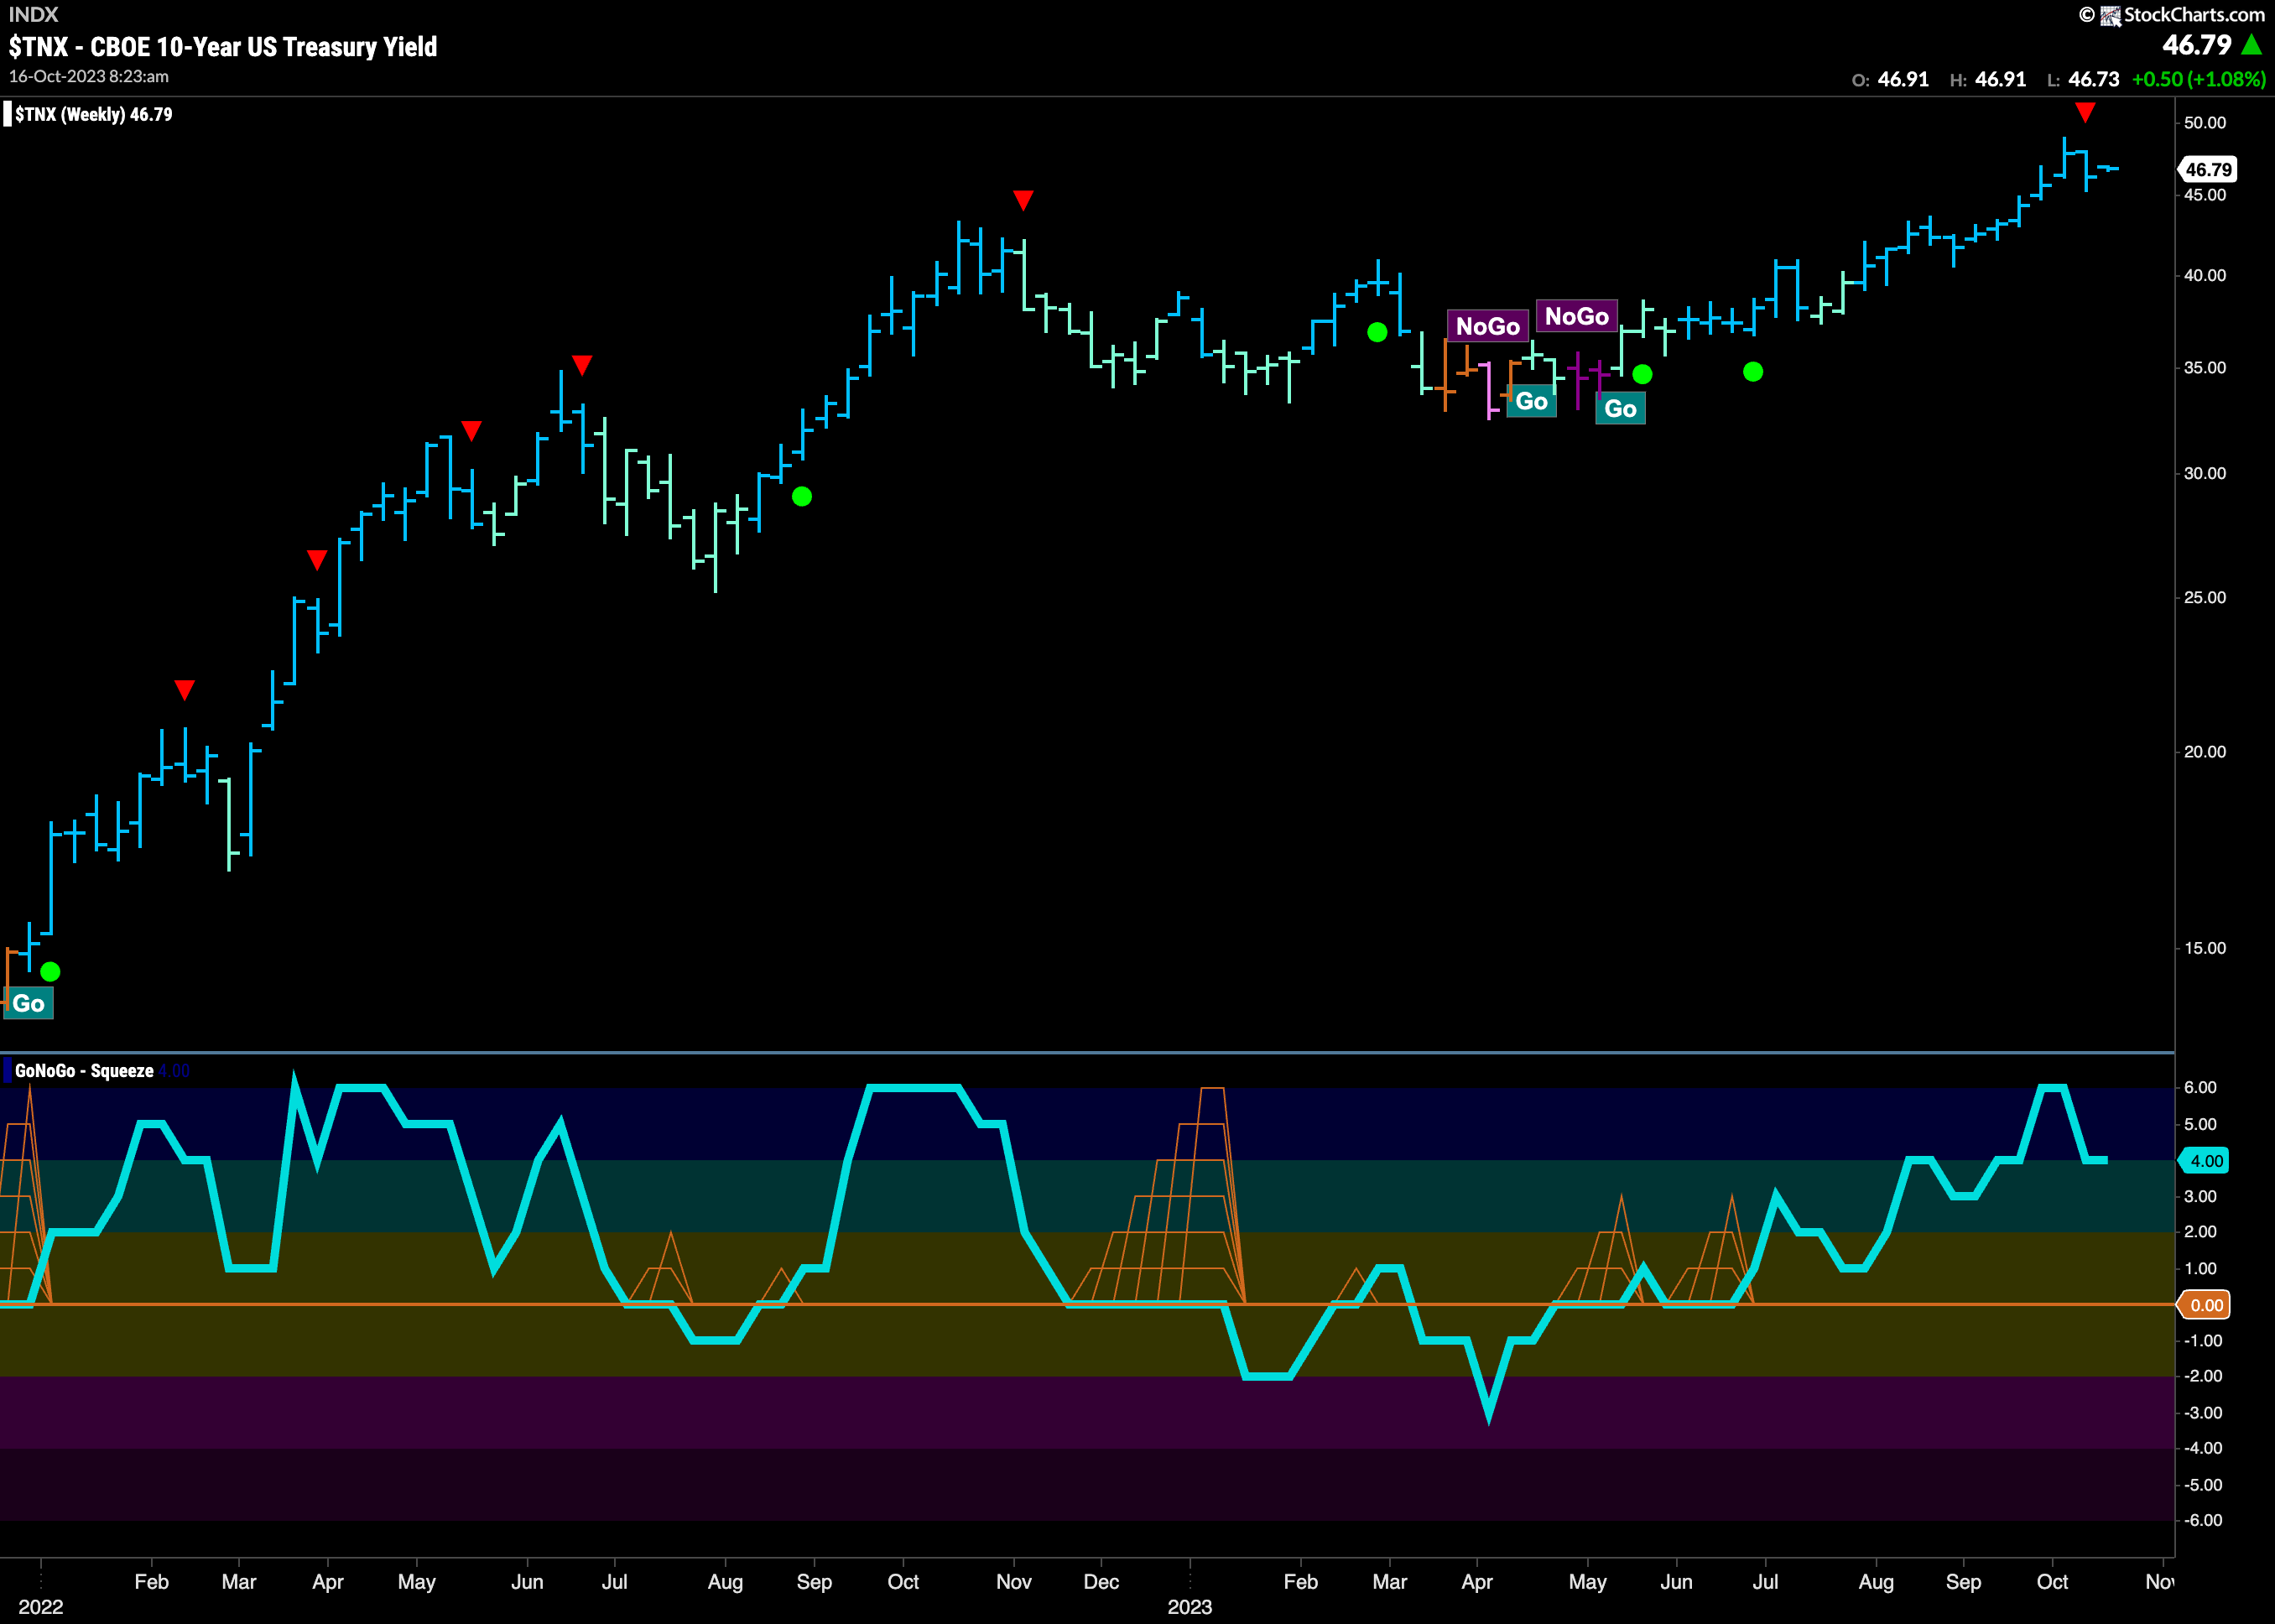
Treasury rates fell back slightly this past week as GoNoGo Oscillator falls out of overbought territory. This tells us that price may struggle to go higher in the short term. This could offer a little relief for equities. However, the trend remains a strong “Go” with a new higher high just a week or two ago. We will watch to see if the oscillator stays in positive territory over the next few weeks.
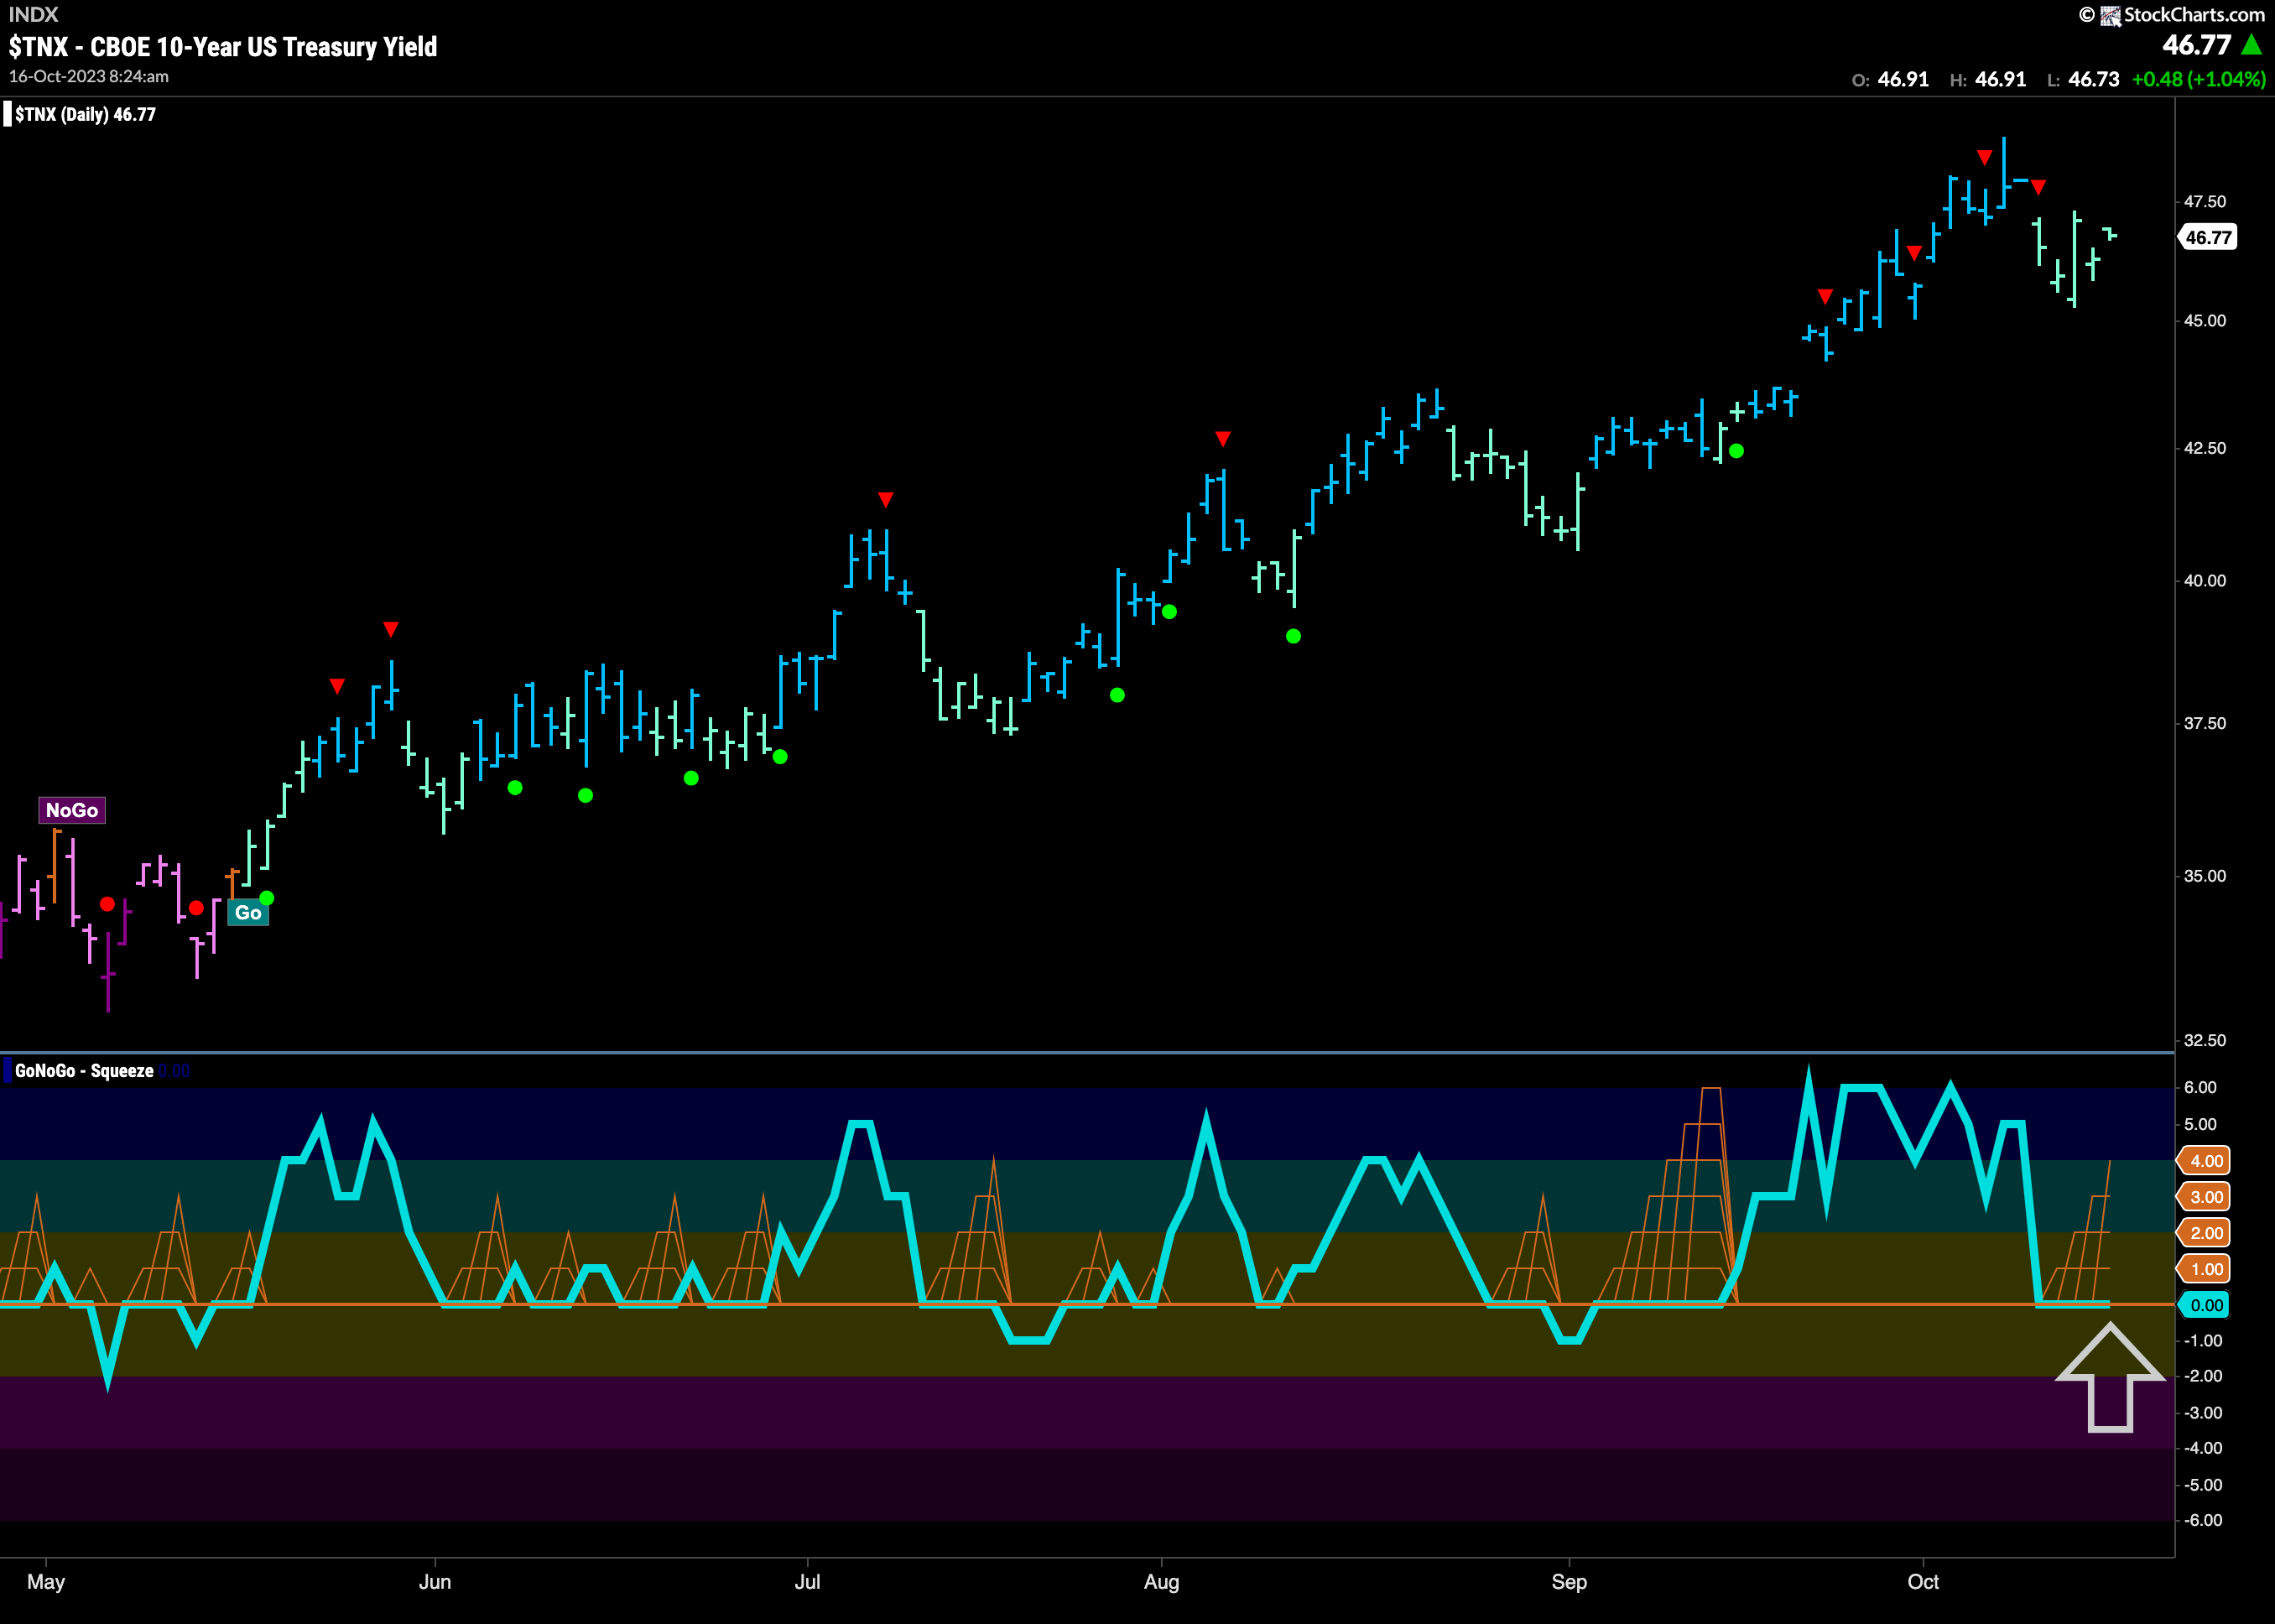
The daily chart shows a pullback within a very strong looking “Go” trend. A new higher high and what looks to be a new higher low as well on the right side of the chart. If we turn our eye to the oscillator panel below we can see that it is riding the zero line. This causes the climbing grid of GoNoGo Squeeze to climb and represents a tug of war between buyers and sellers. We know that from reduced volatility can come higher volatility moves and so the direction of the break of the GoNoGo Squeeze will be important.
Dollar Sees Trend Continuation
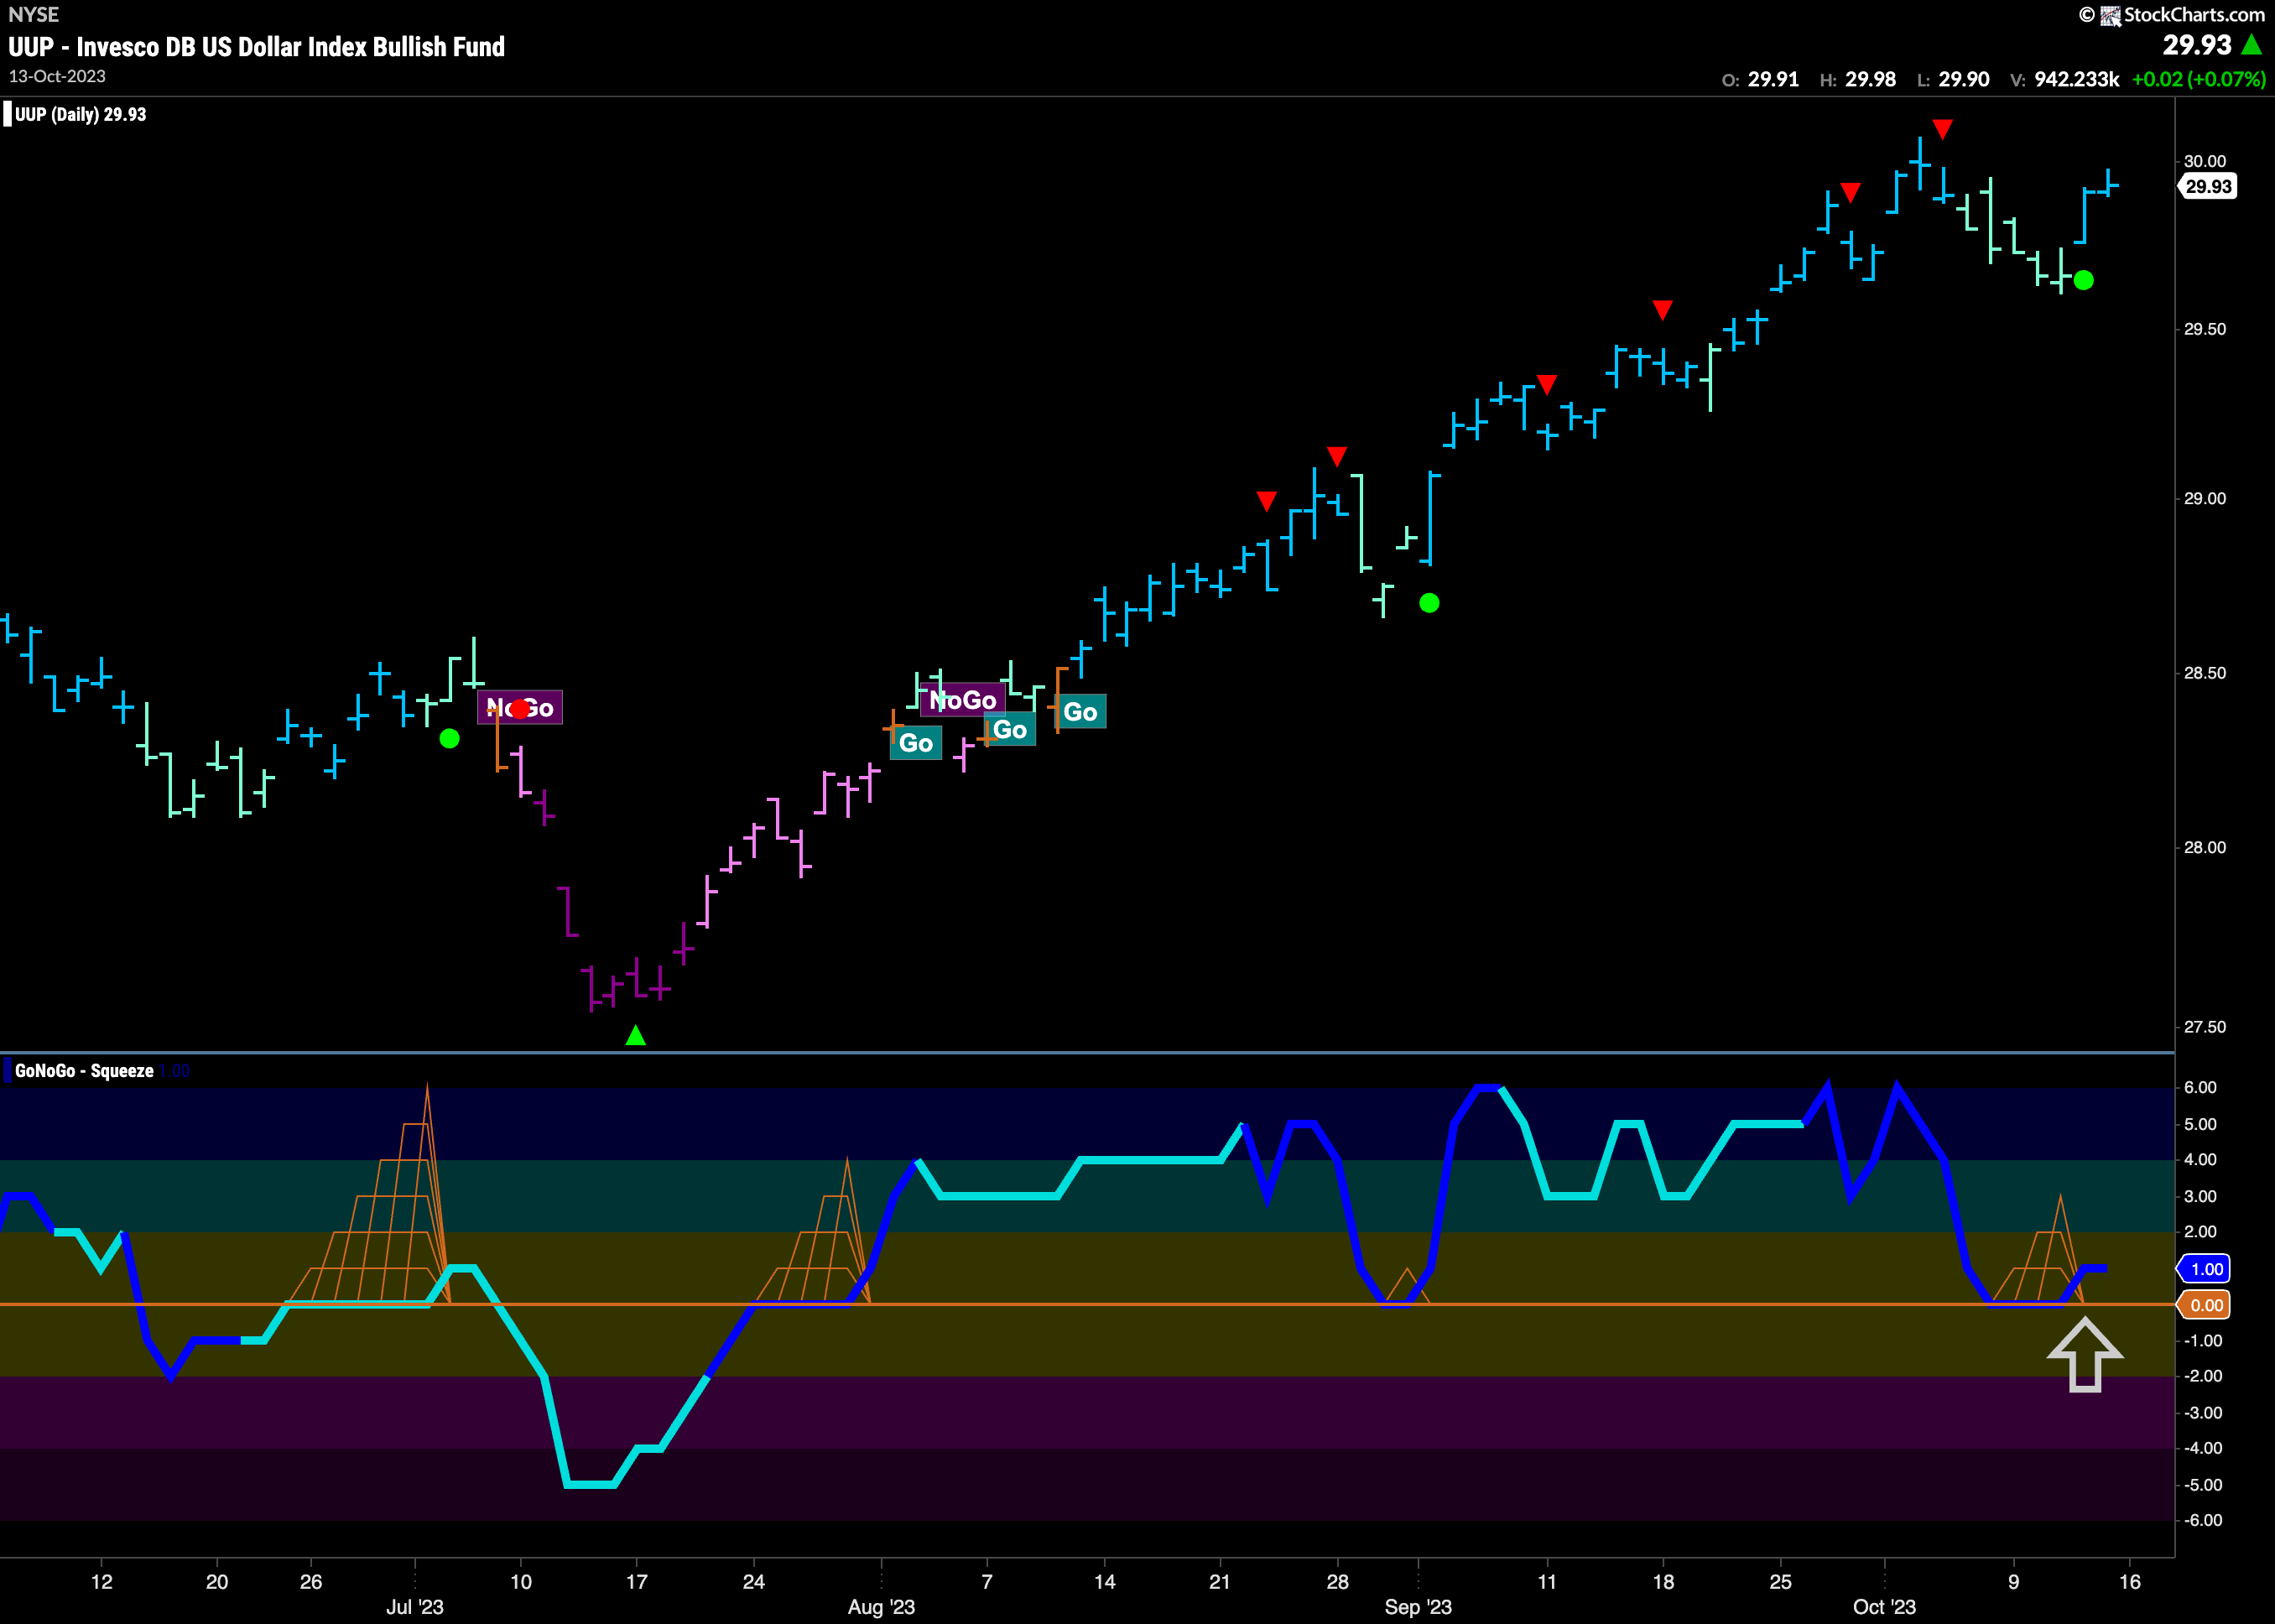
The dollar remains in its “Go” trend and the end of last week saw it strengthen. Having hit a high early this month we saw a Go Countertrend Correction Icon (red arrow) indicating that price may struggle to go higher in the short term. Indeed, we saw a pullback after this. GoNoGo Trend painted a string of weaker aqua bars and GoNoGo Oscillator fell sharply to the zero line. We watched to see if it found support at that level and it did, moving out of a small GoNoGo Squeeze back into positive territory. This triggered a Go Trend Continuation Icon (green circle) to appear under the price bar and we will look to see if price can make an attack on the prior high.
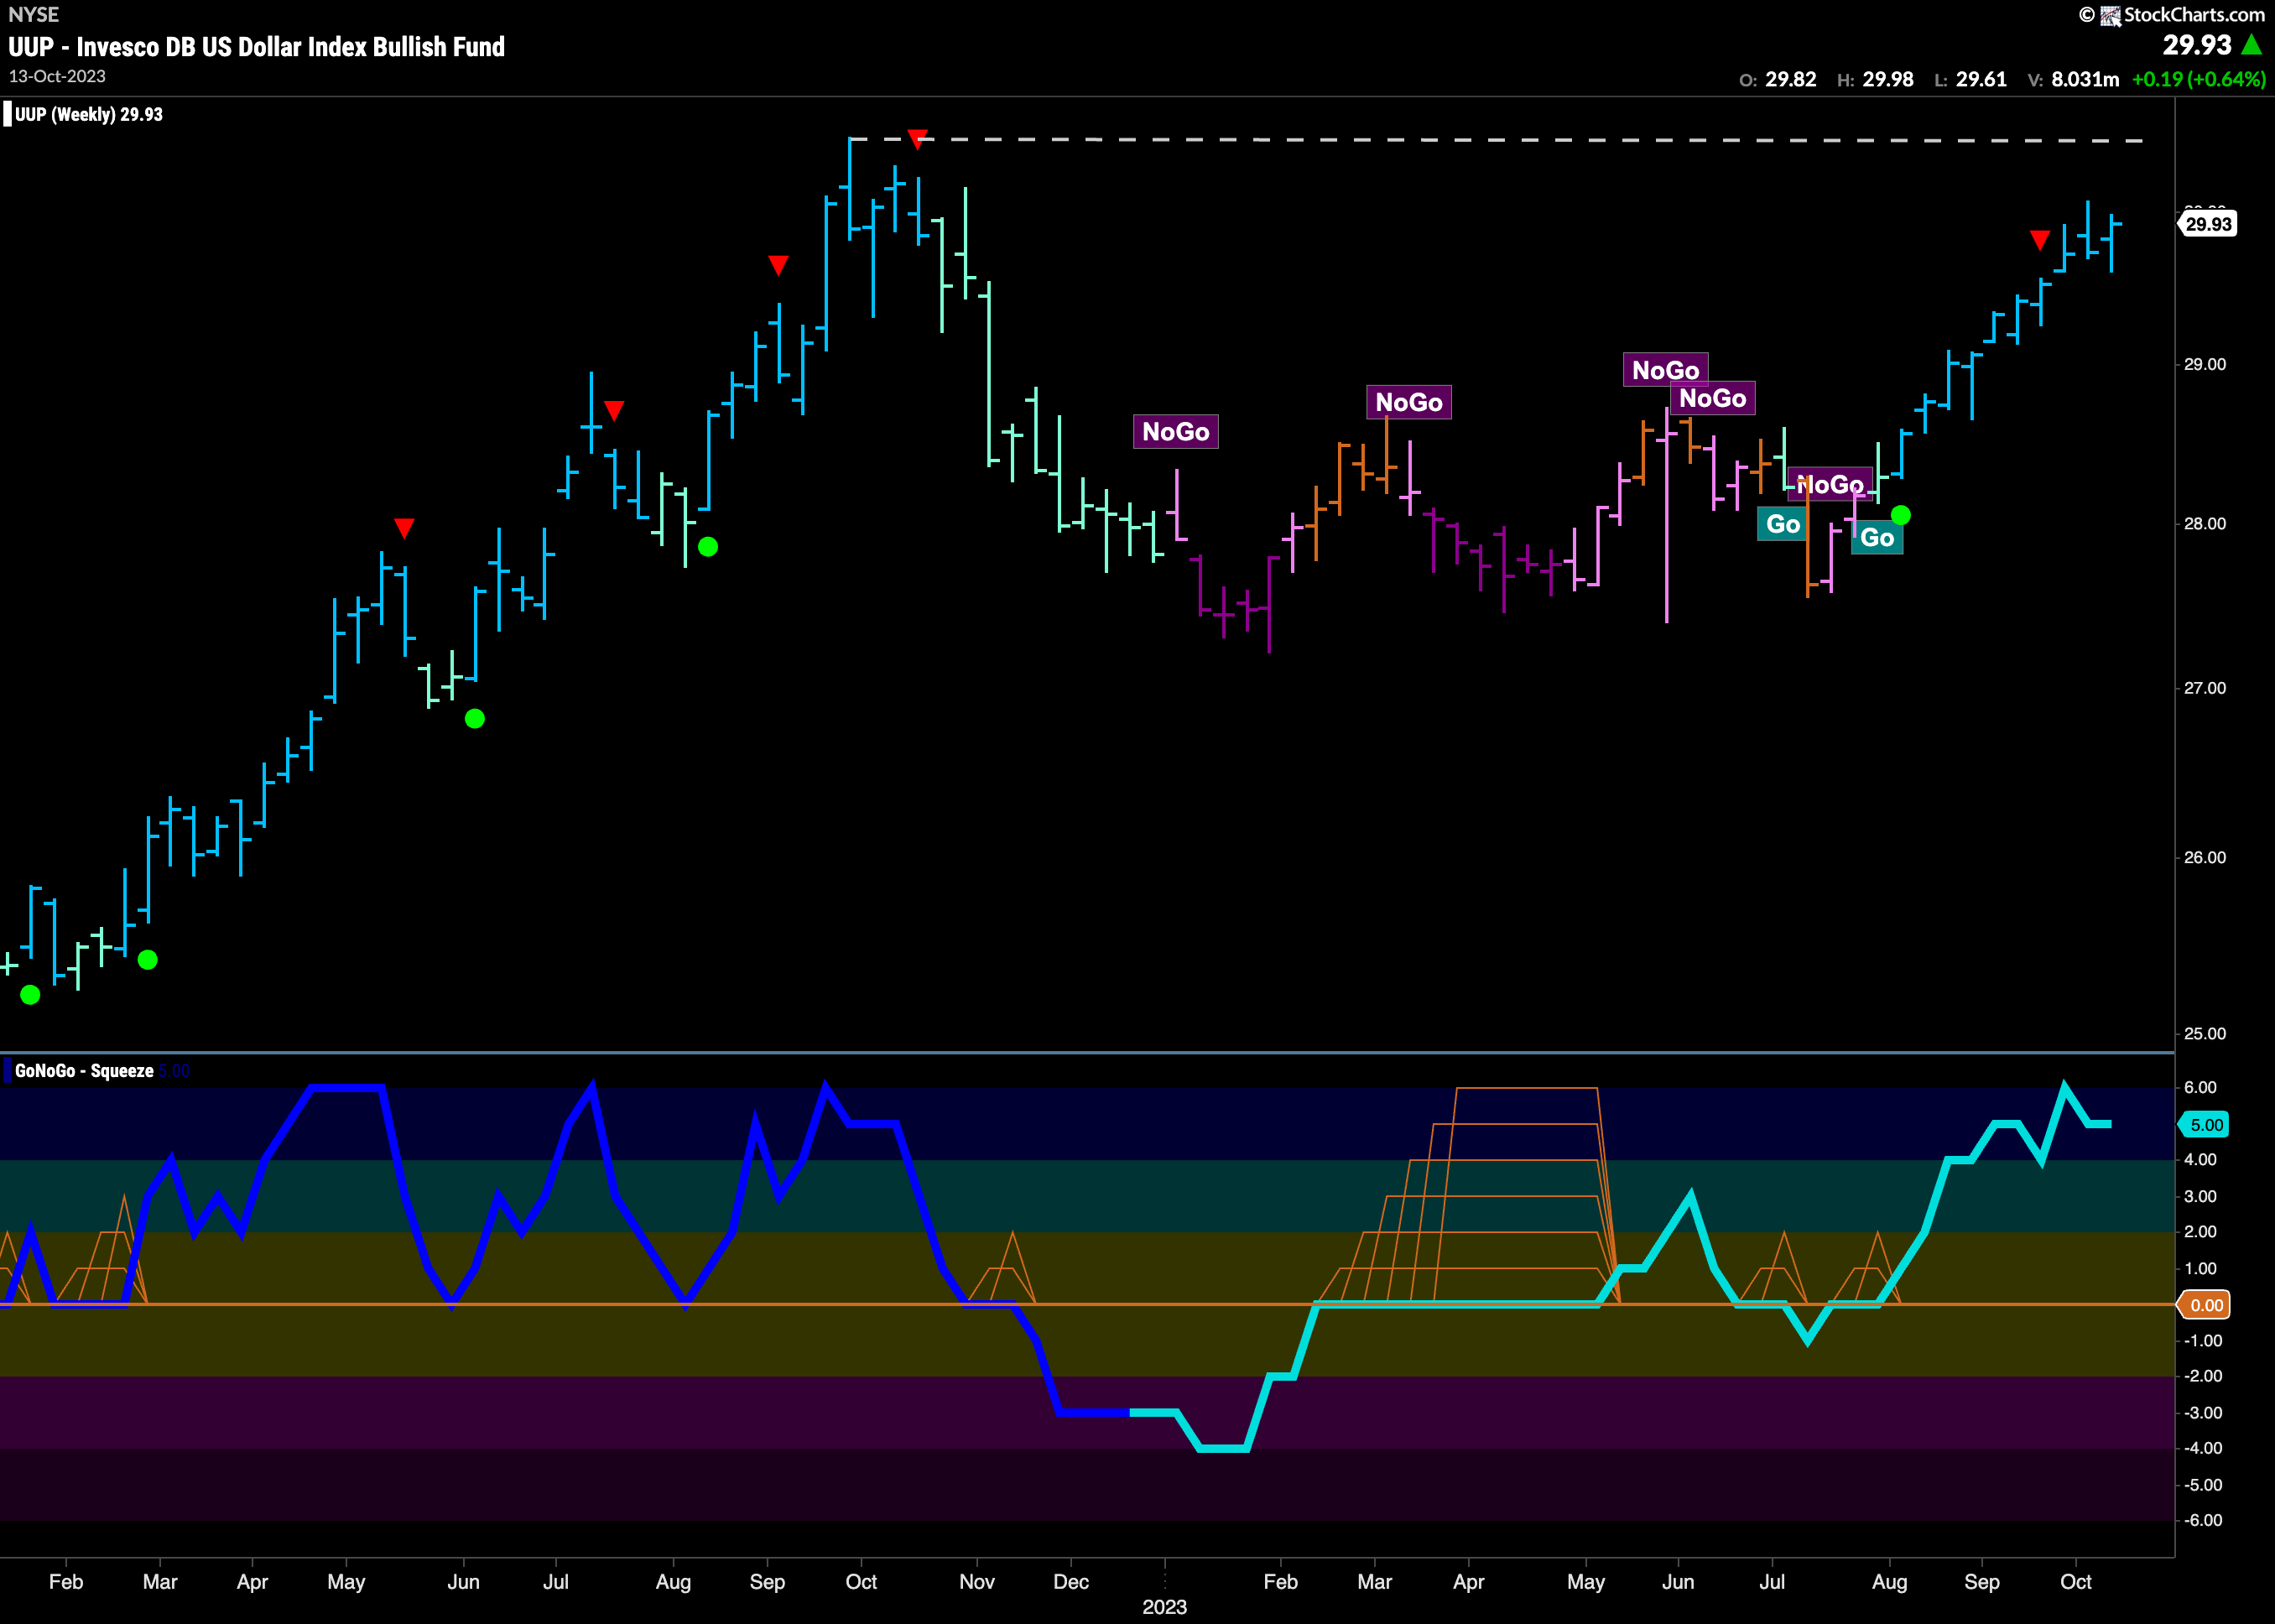
The longer timeframe chart below shows how strong the “Go” trend is. Since the first aqua bar of this “Go” trend, the indicator has painted nothing but strong blue bars. With fall ’22 highs looming, there appears to be serious resistance ahead, but we are not quite there yet. GoNoGo Oscillator is overbought at a value of 5 and so we will watch to see if this momentum is maintained or if it cools over the next few weeks.
Oil Says “Not So Fast”!
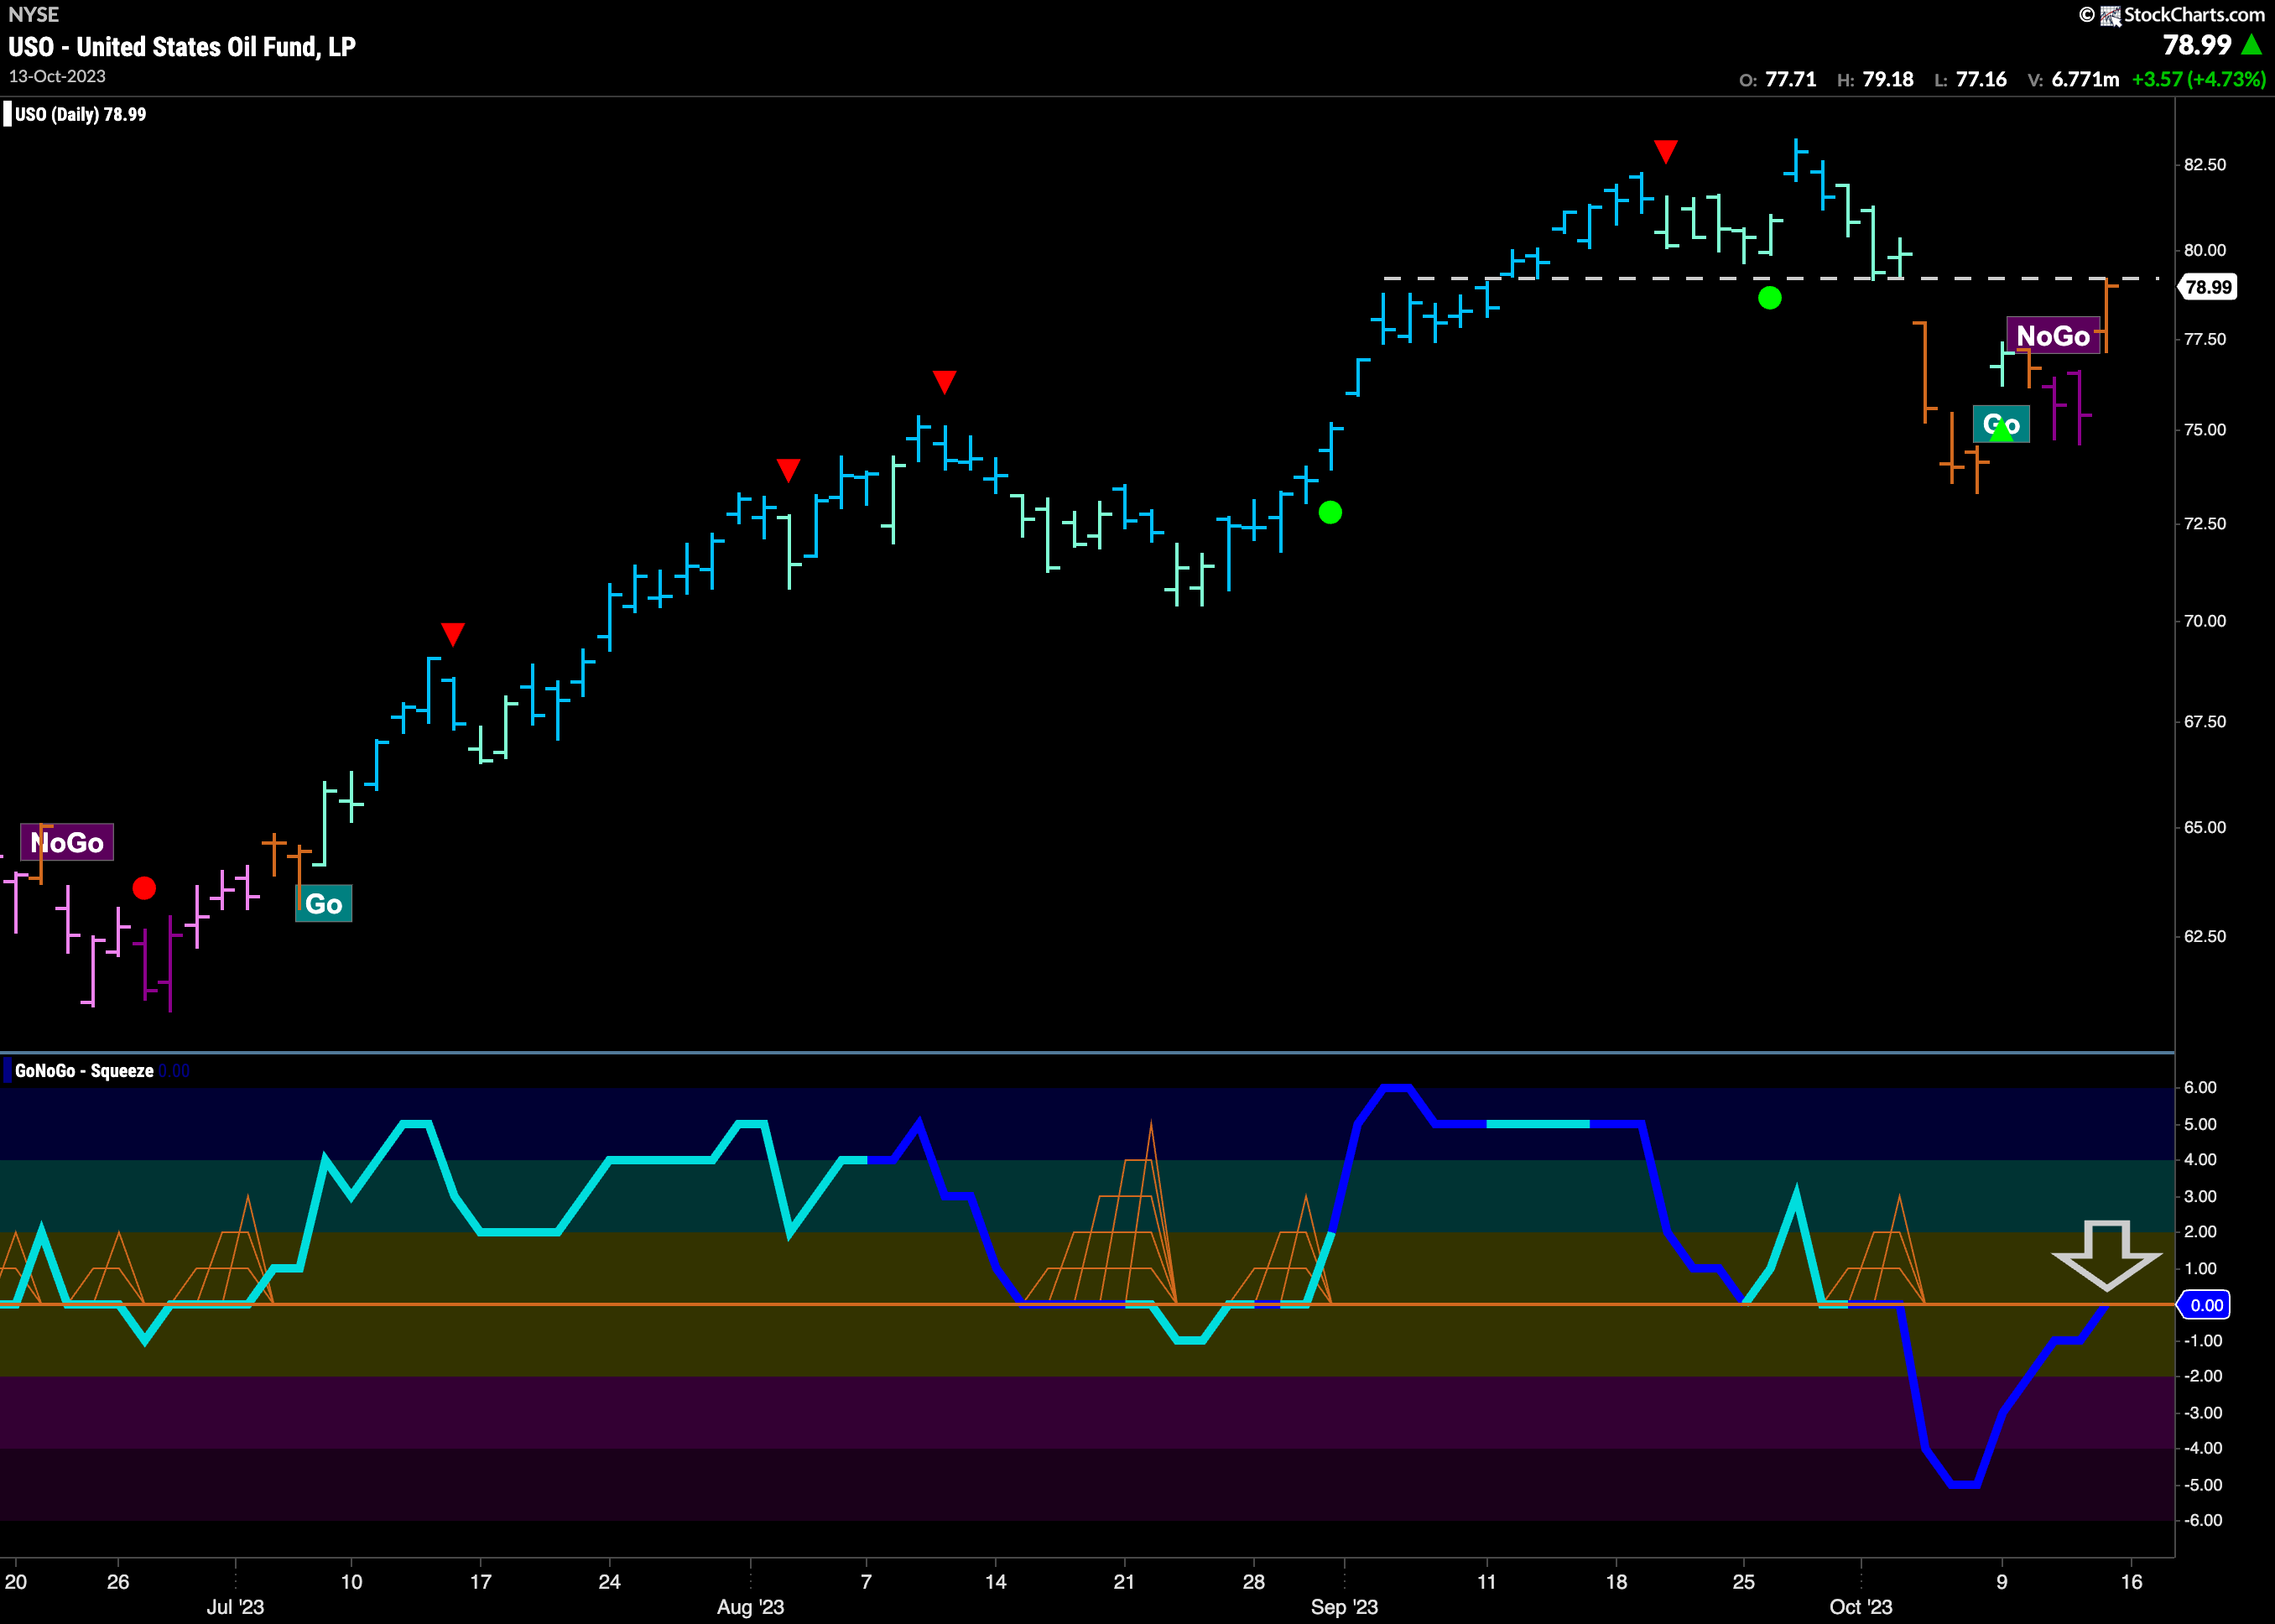
After falling so quickly a few weeks ago oil prices have rallied almost as fast. In fact, the daily chart below shows that the amber “Go Fish” bar is testing the gap from the fall. GoNoGo Oscillator is back to test the zero line from below and so we will watch whether it gets rejected by the zero level or if it breaks back into positive territory. This will help determine price’s next trend.
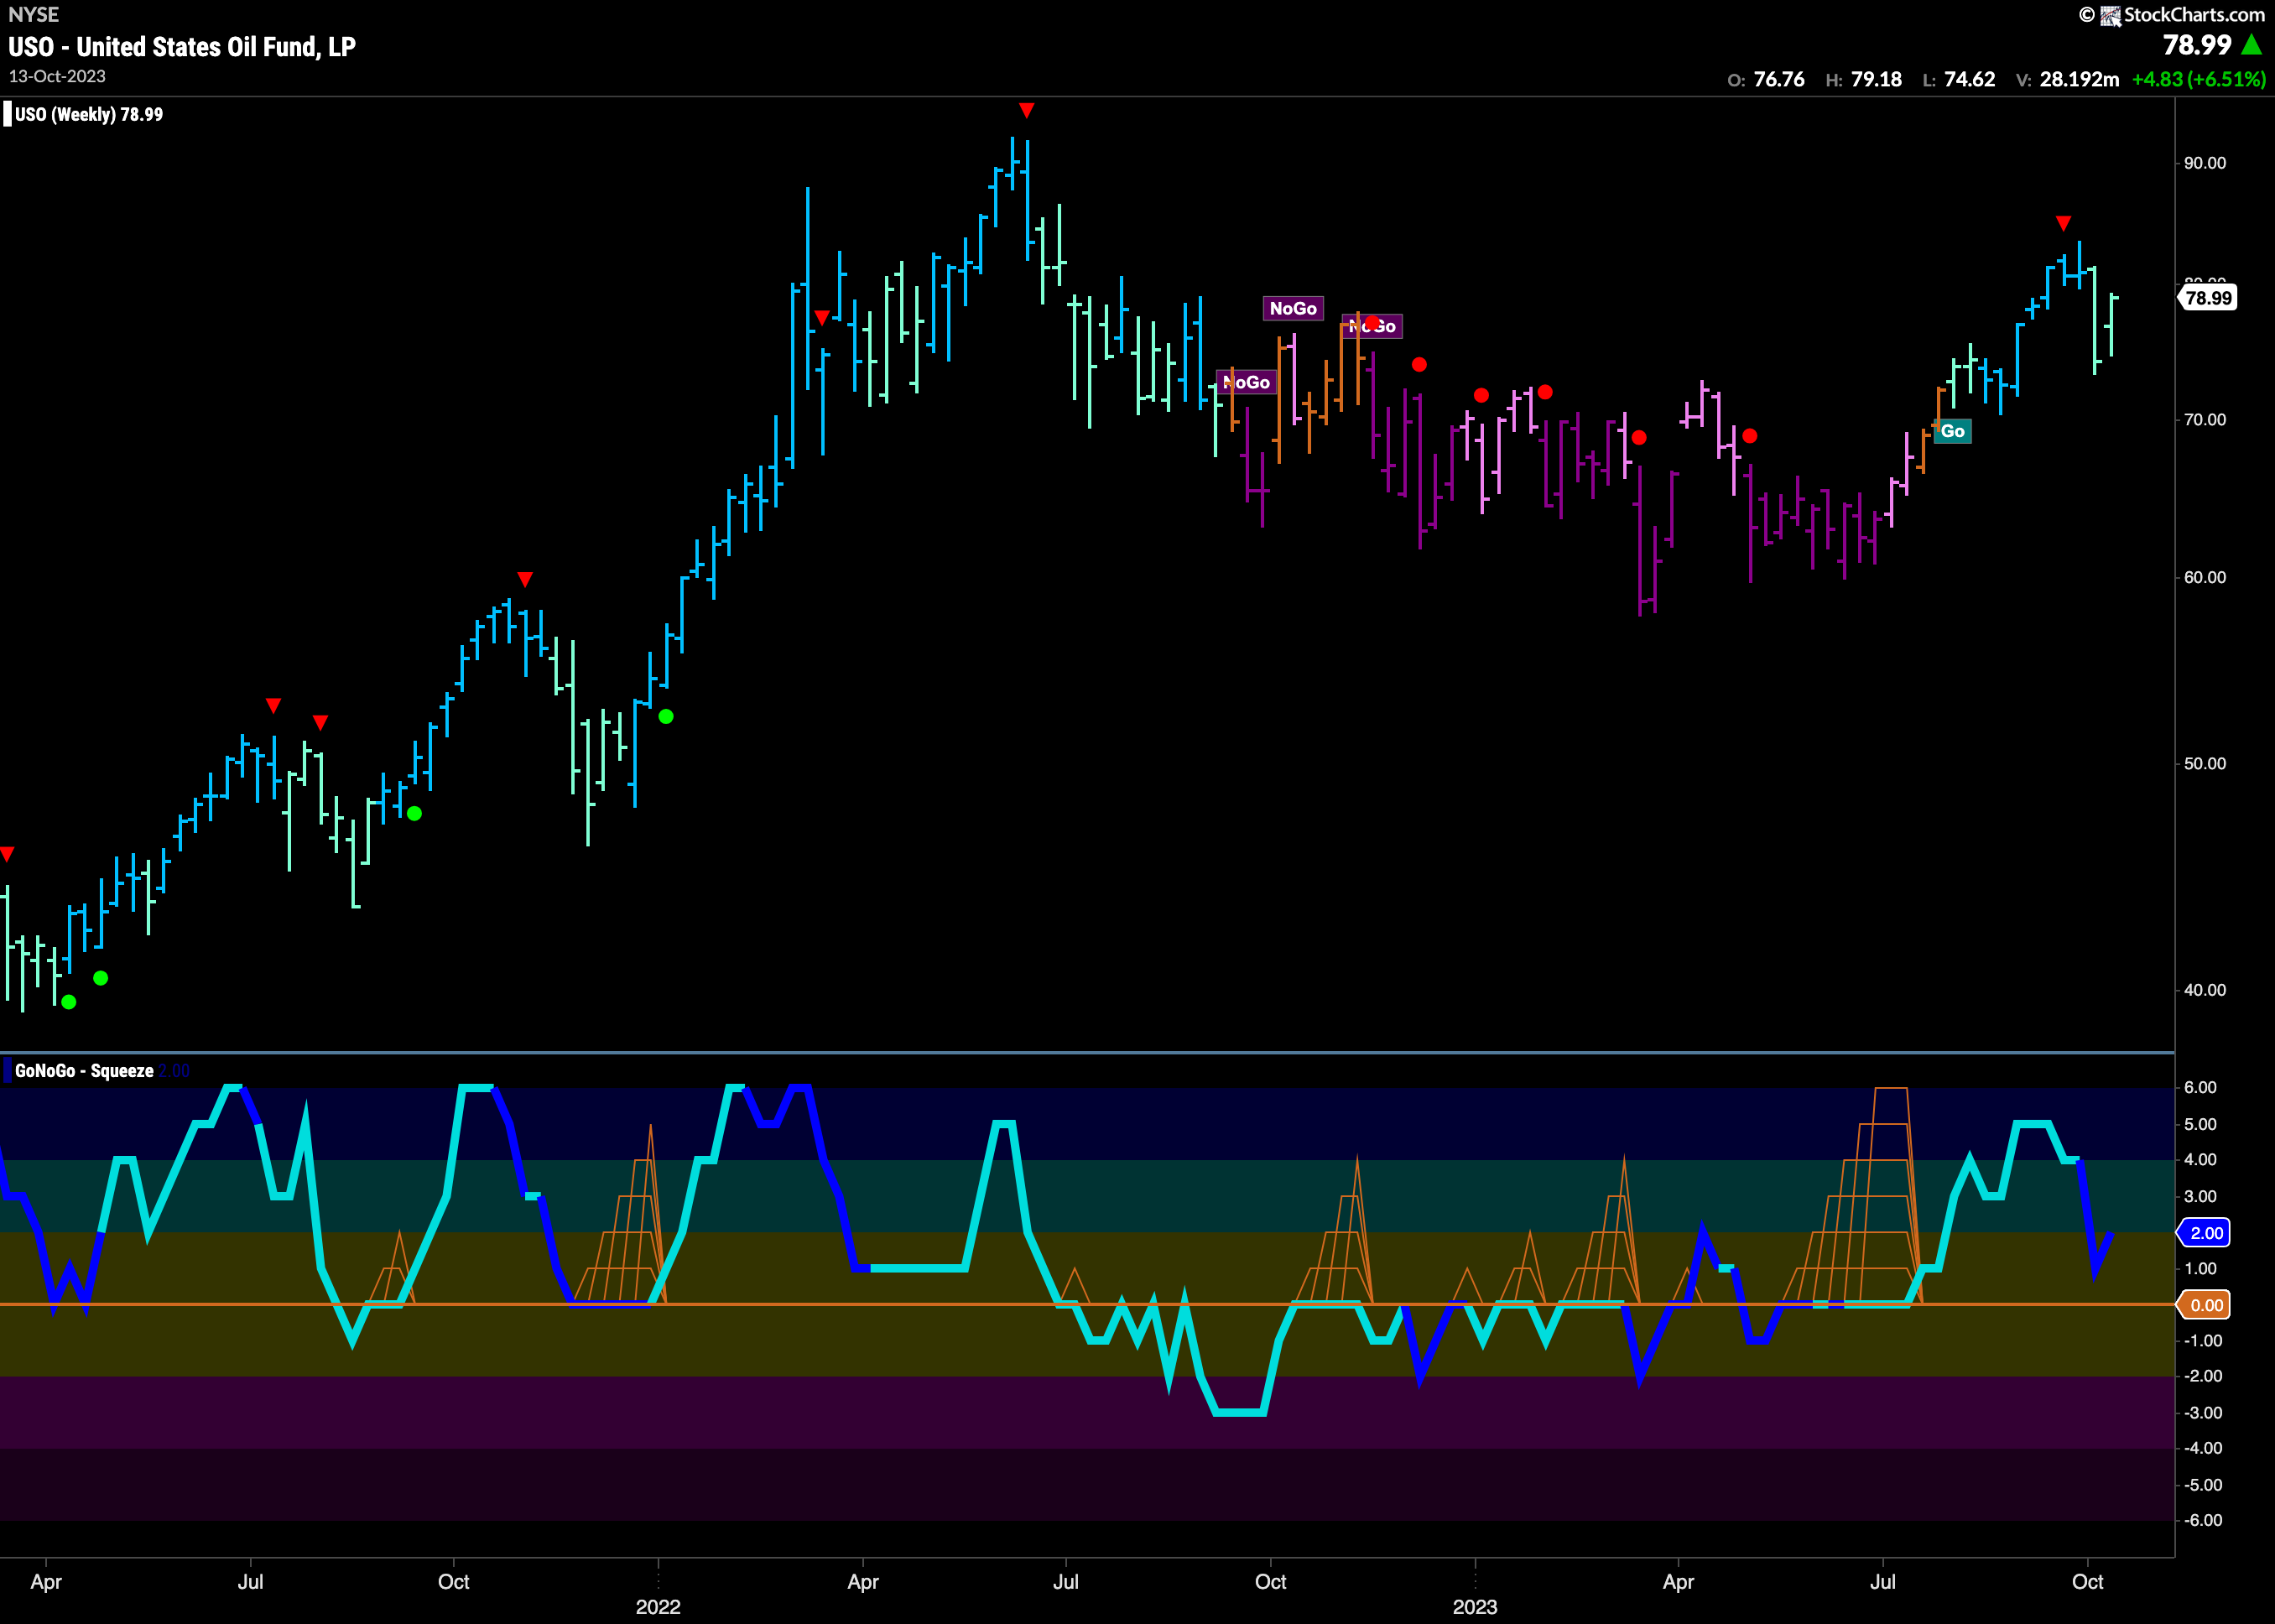
The weekly chart shows that prices rallied last week and kept the “Go” trend in place although the indicator painted a second aqua bar. With the entirety of last week’s price action contained in the week before’s, a candle chart would tell you that is a bullish harami. With the oscillator turning back up, we could expect positive price action over the next few bars.
Sector RelMap
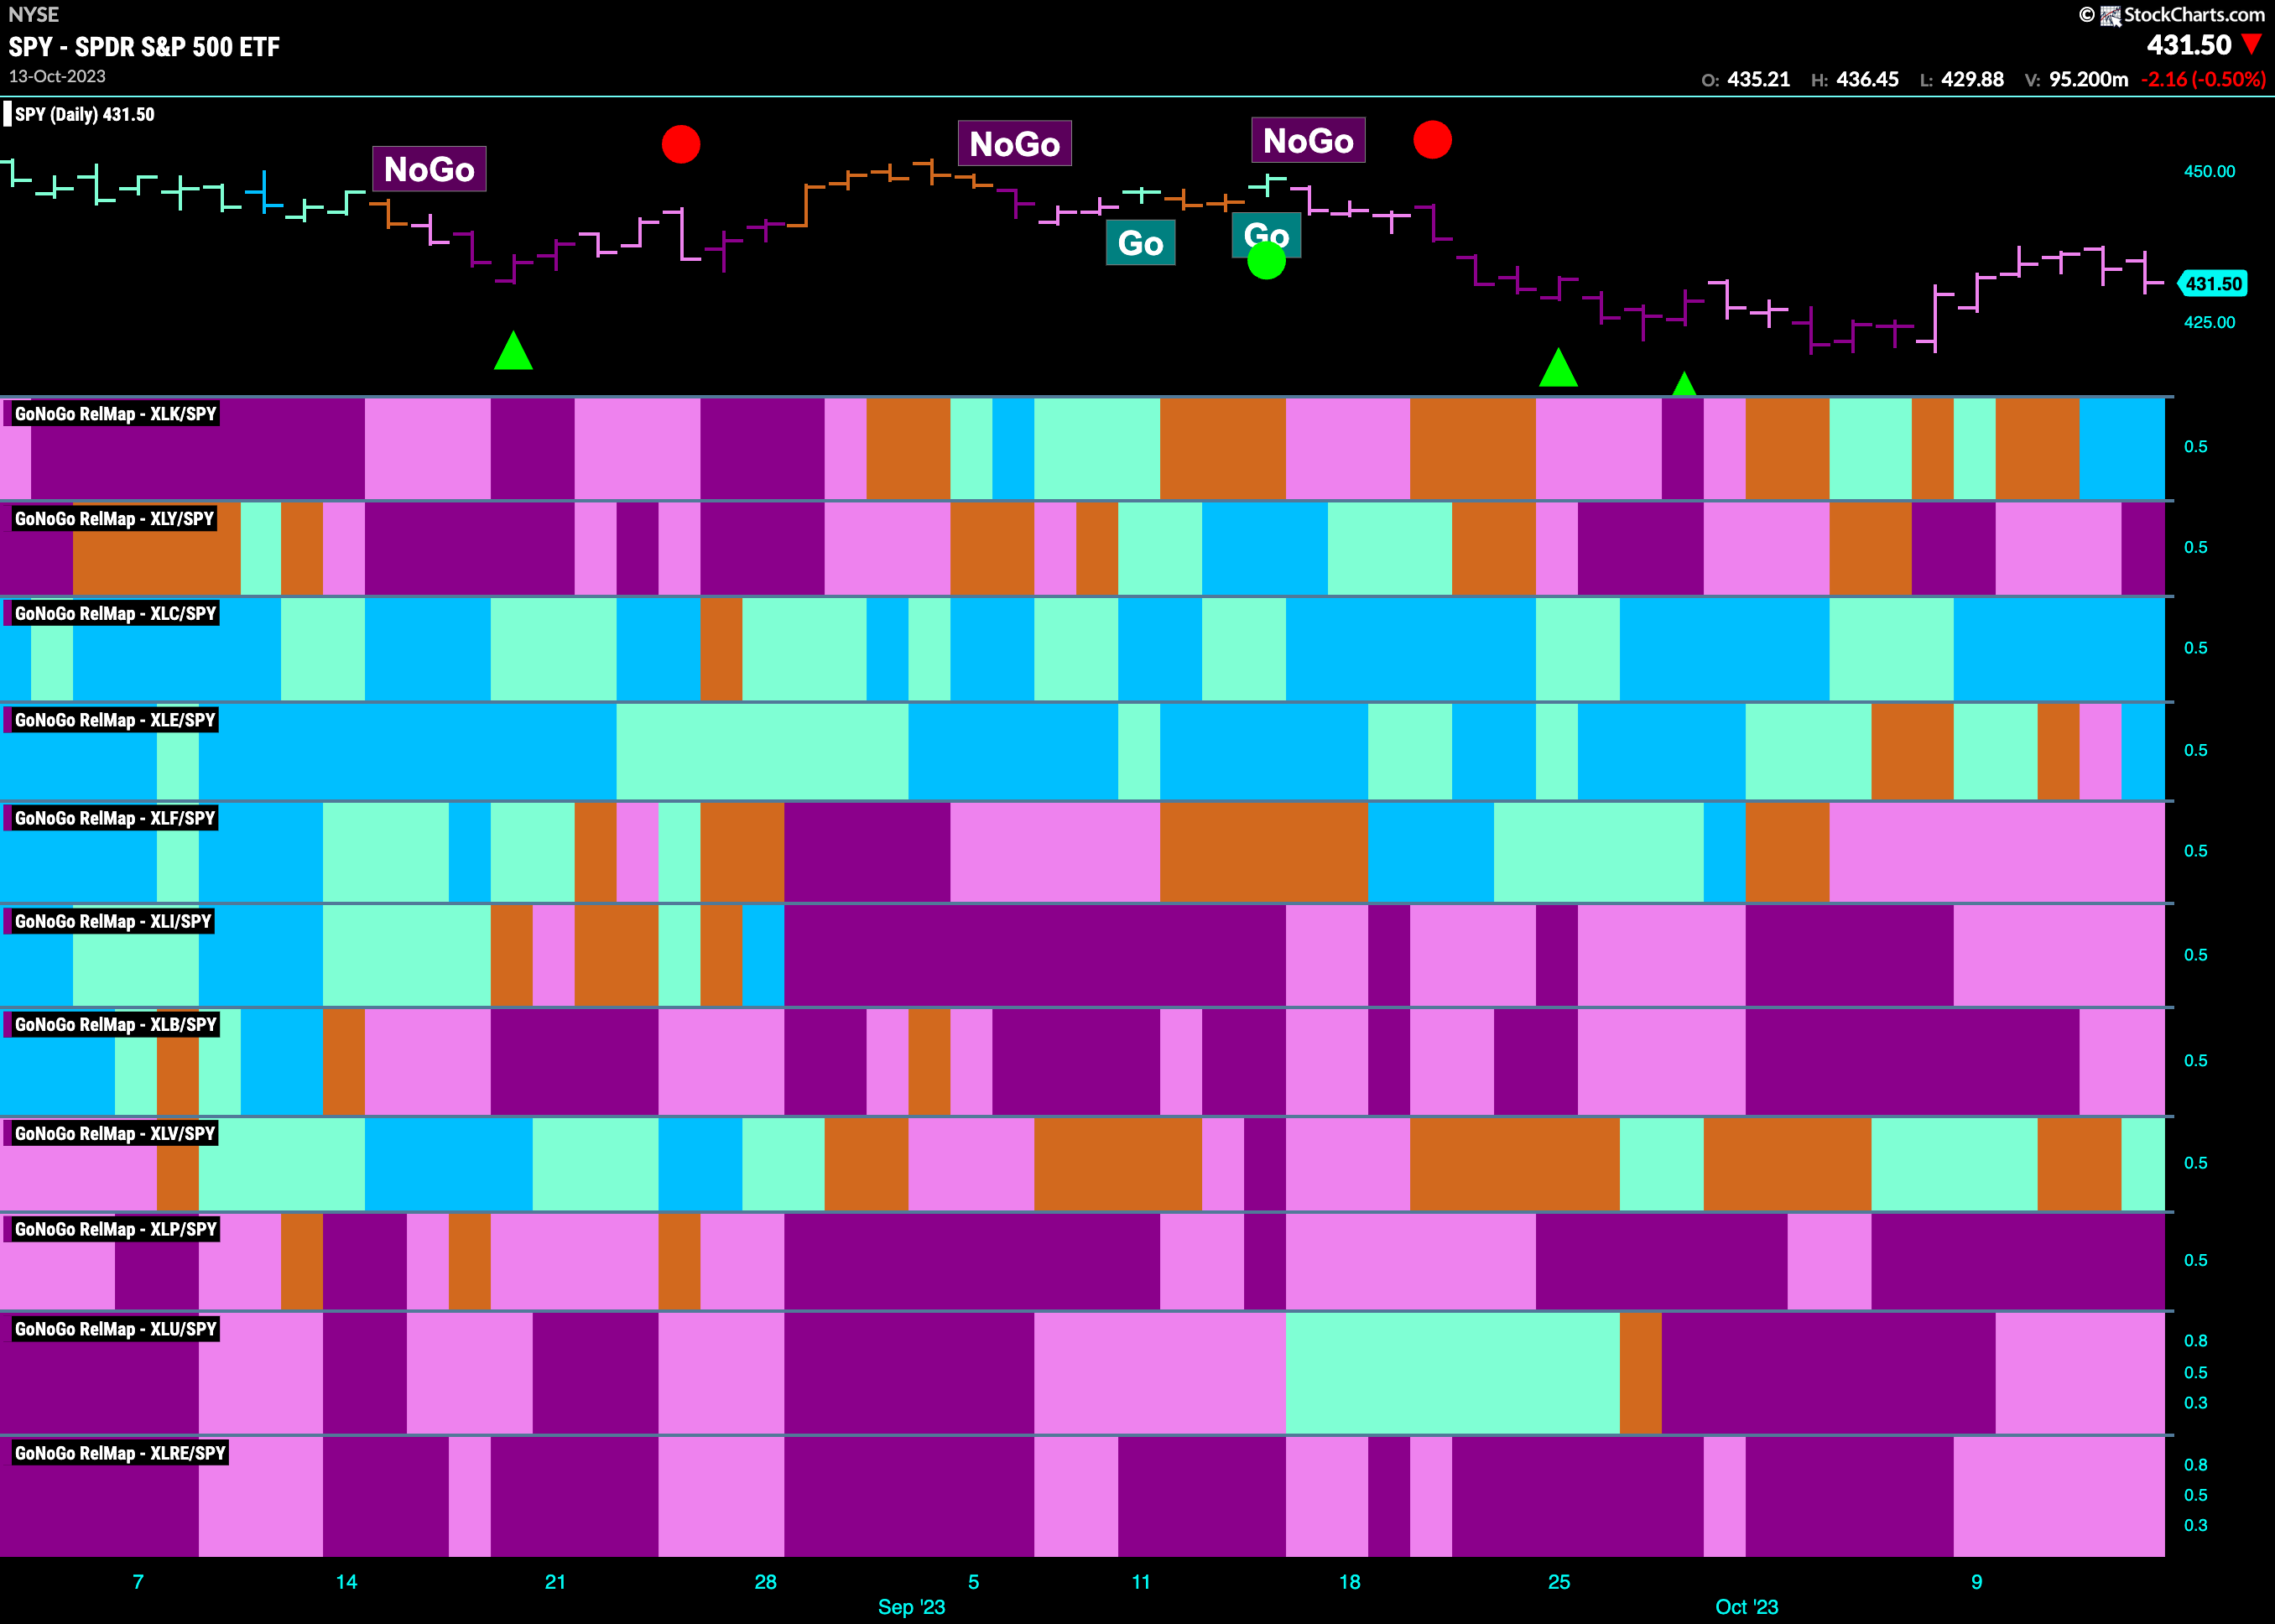
Below is the GoNoGo Sector RelMap. This GoNoGo RelMap applies the GoNoGo Trend to the relative strength ratios of the sectors to the base index. Looking at this map, we can quickly see where the relative outperformance is coming from as well as which sectors are lagging on a relative basis. 3 sectors are outperforming the base index this week. $XLK, $XLC, $XLE, and $XLV are painting “Go” bars.
$XLE Threatening to Break Higher
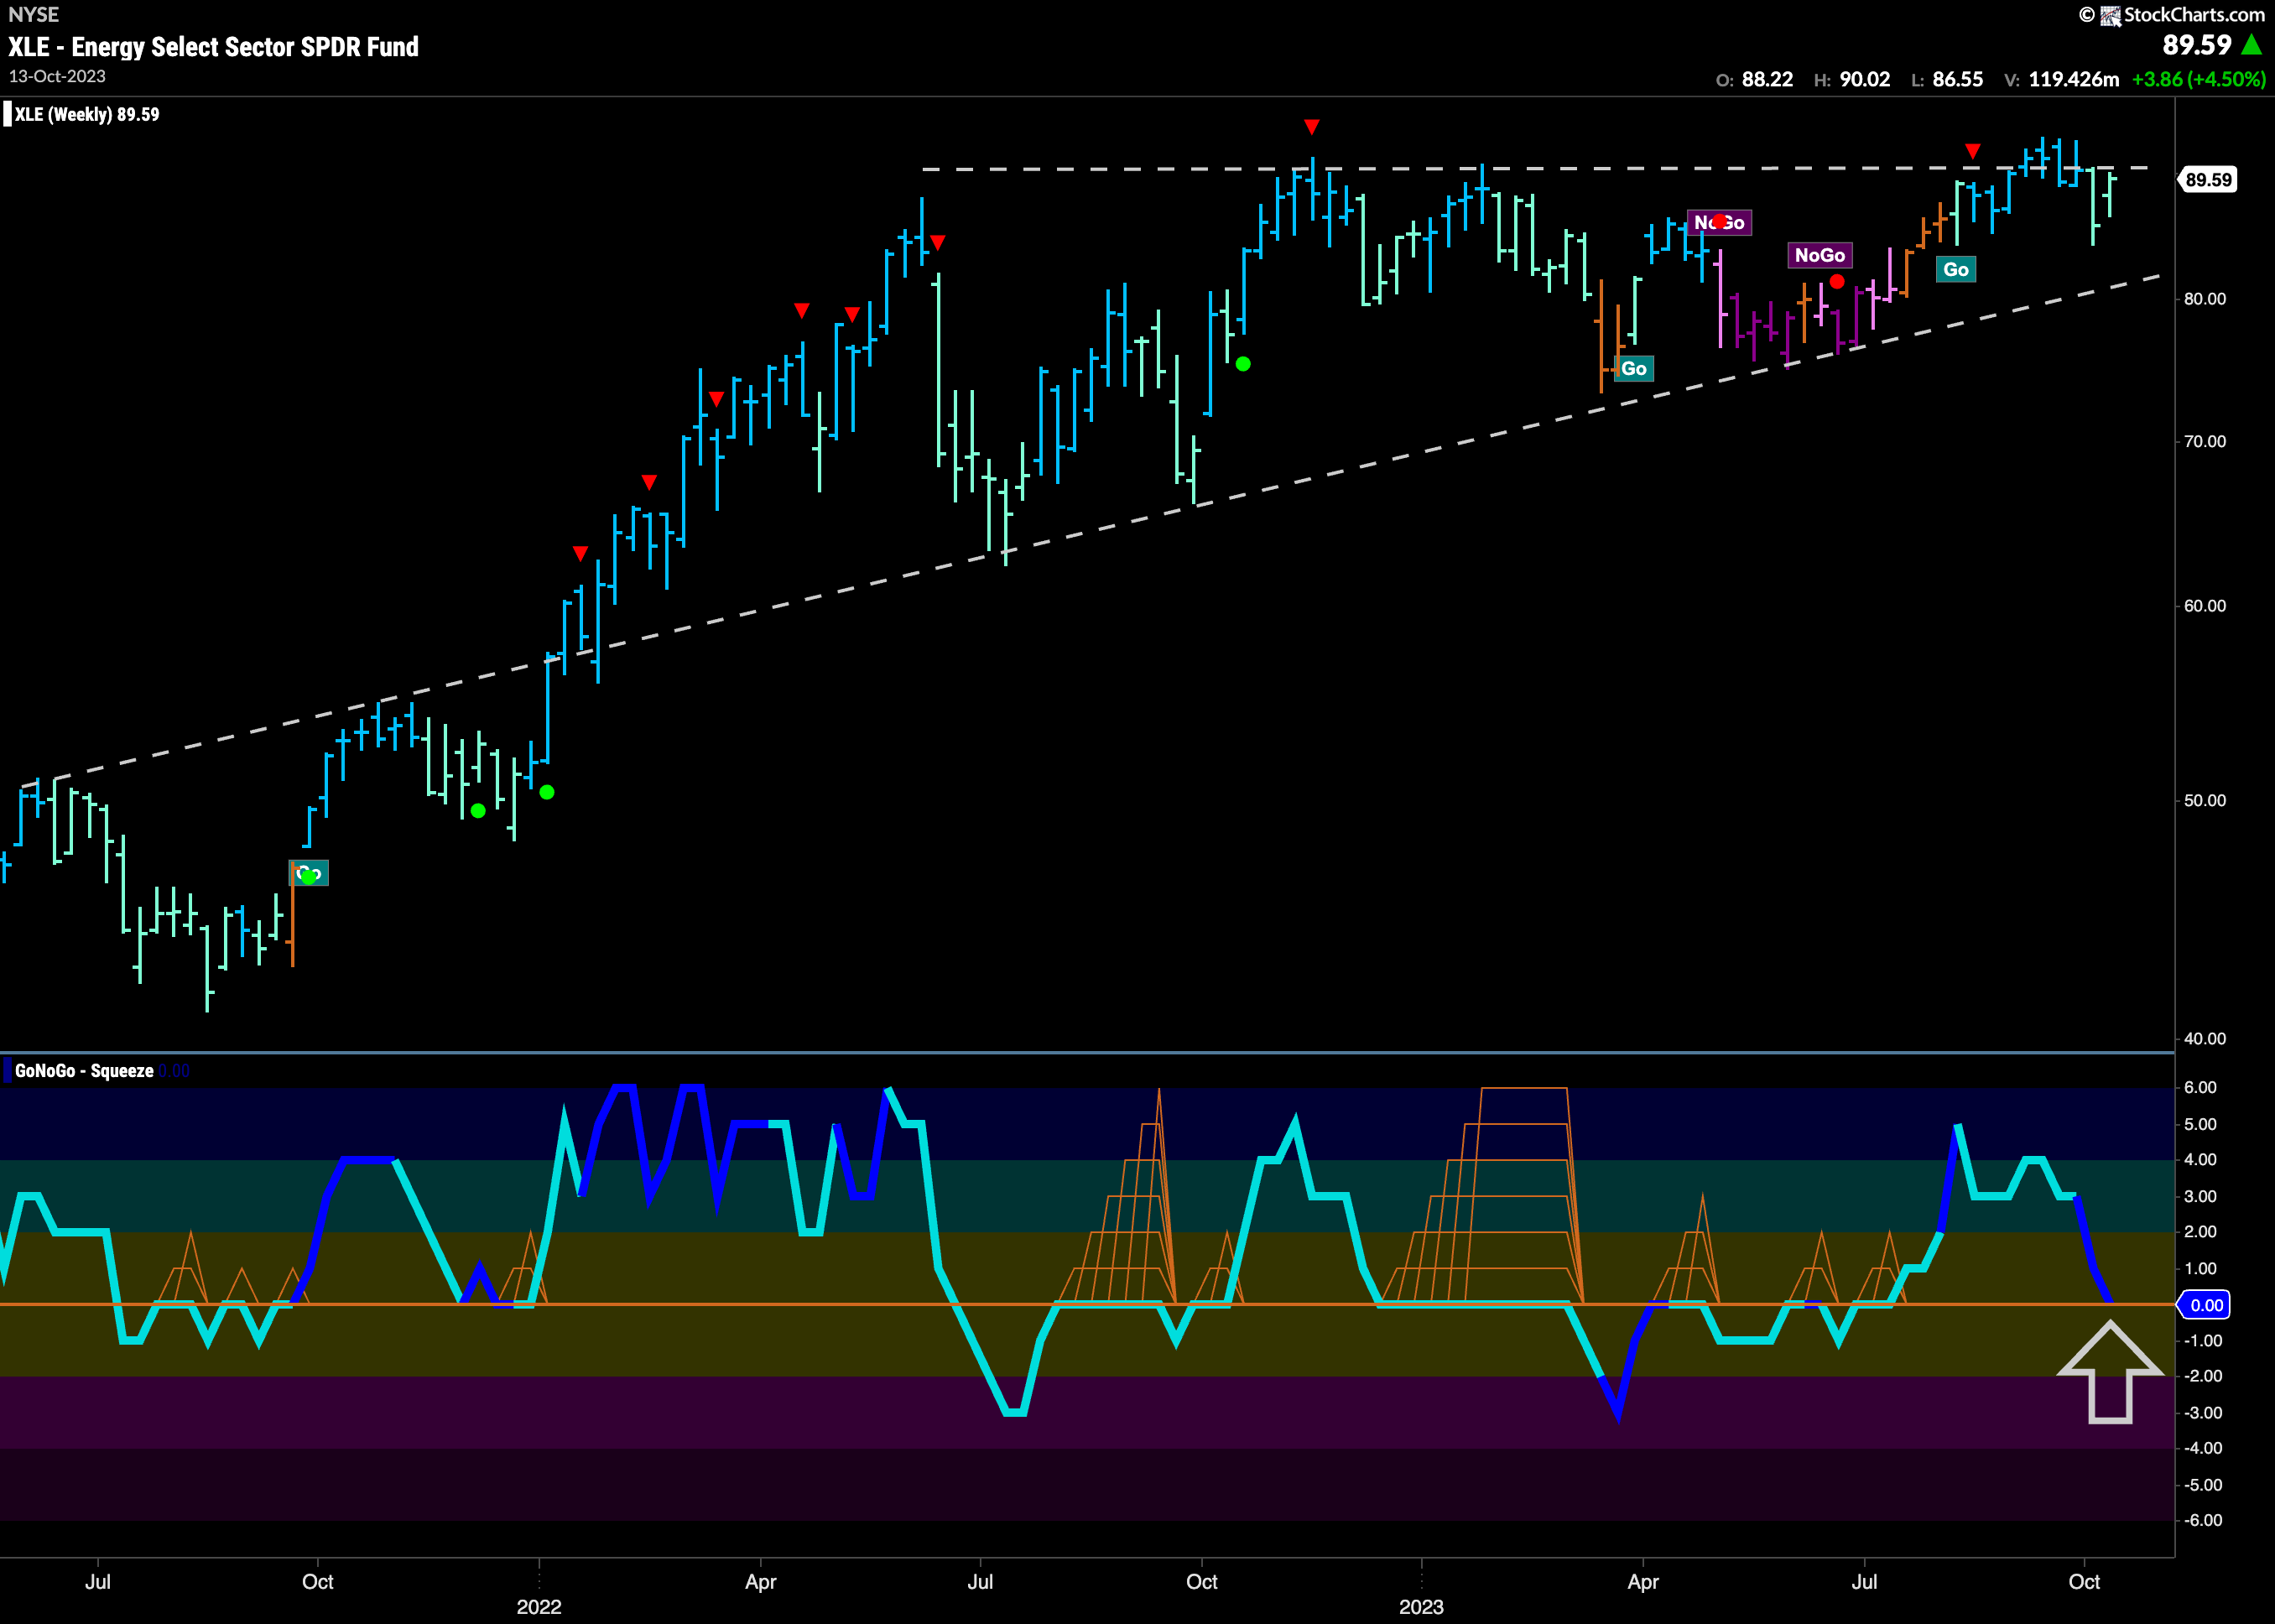
$XLE has returned to relative outperformance as seen in the GoNoGo Sector RelMap above. The chart below shows the weekly chart of $XLE and you can see we are in a very large ascending triangle continuation pattern. This pattern would be completed with a breakout above the horizontal bound. We see that price is testing that level once again, and GoNoGo Oscillator is testing the zero line from above. We will want to see the oscillator find support here. That could give price the push it needs to move to new highs.
Energy Sub-Group RelMap
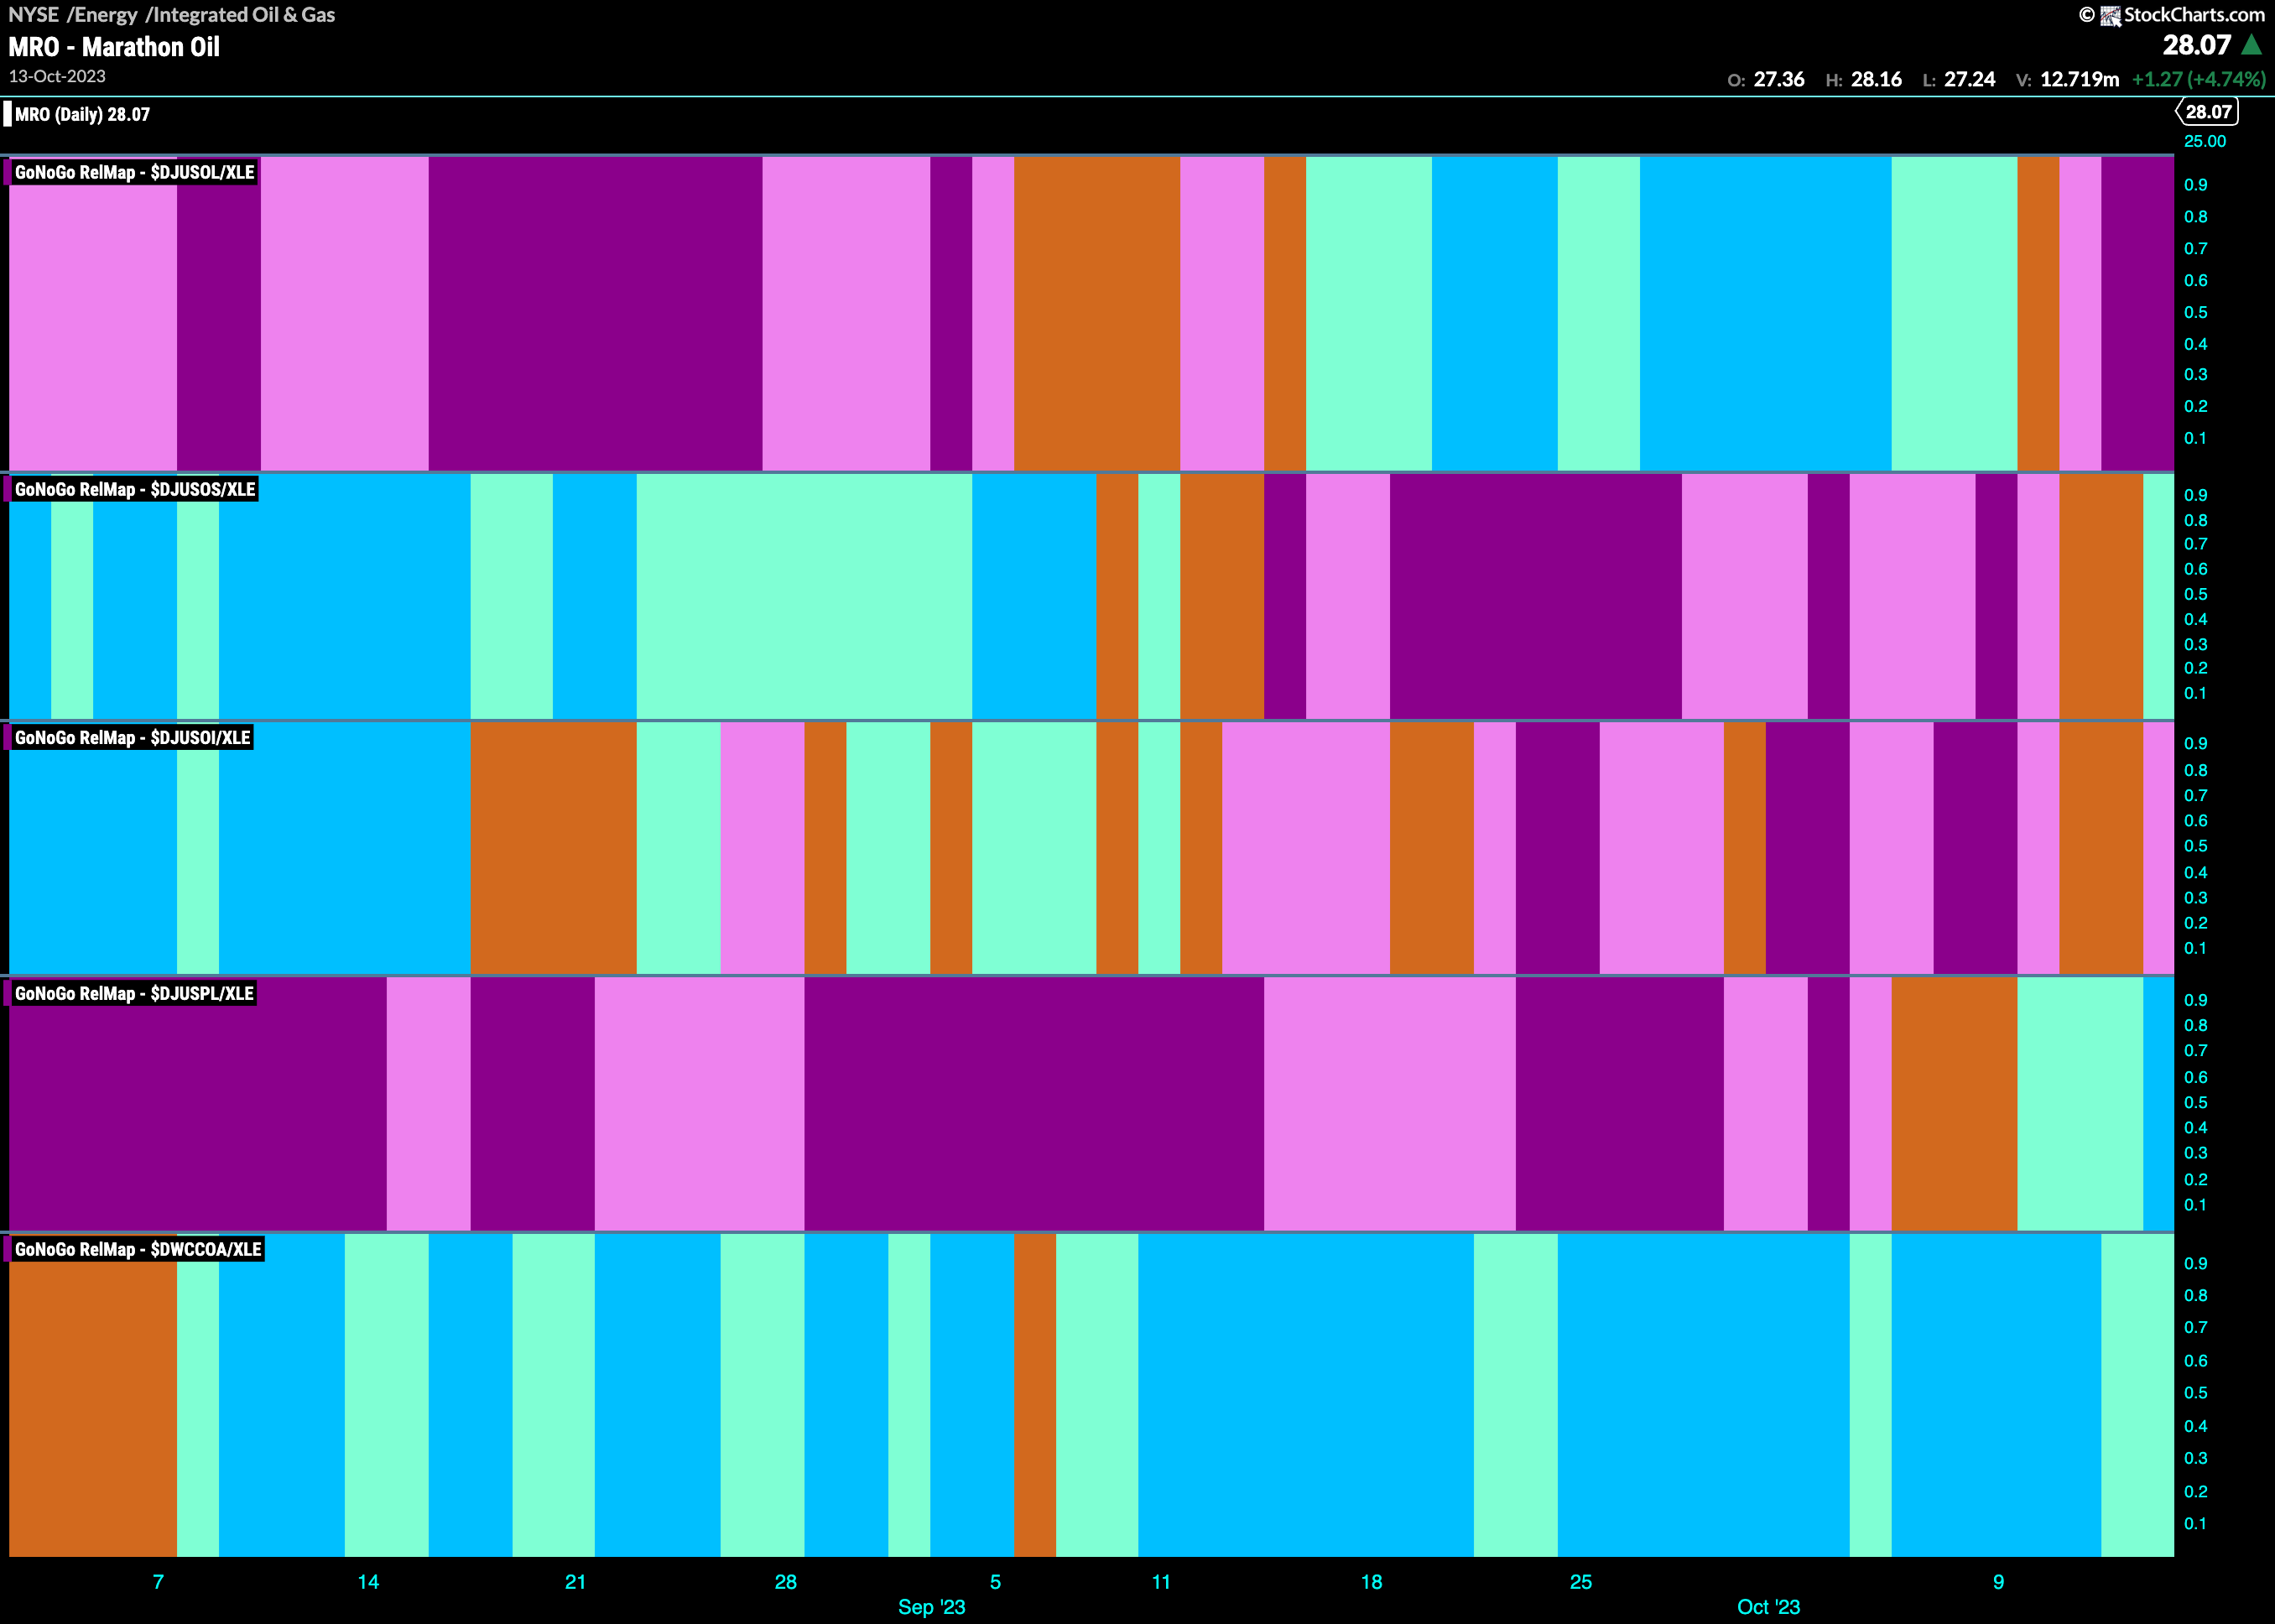
The GoNoGo Sector RelMap above shows the relative outperformance of the energy sector. The energy sub group map below shows that the pipelines group has emerged as a leader. The fourth panel shows a strong blue bar as the week ended.
Williams Cos., Breaks Higher
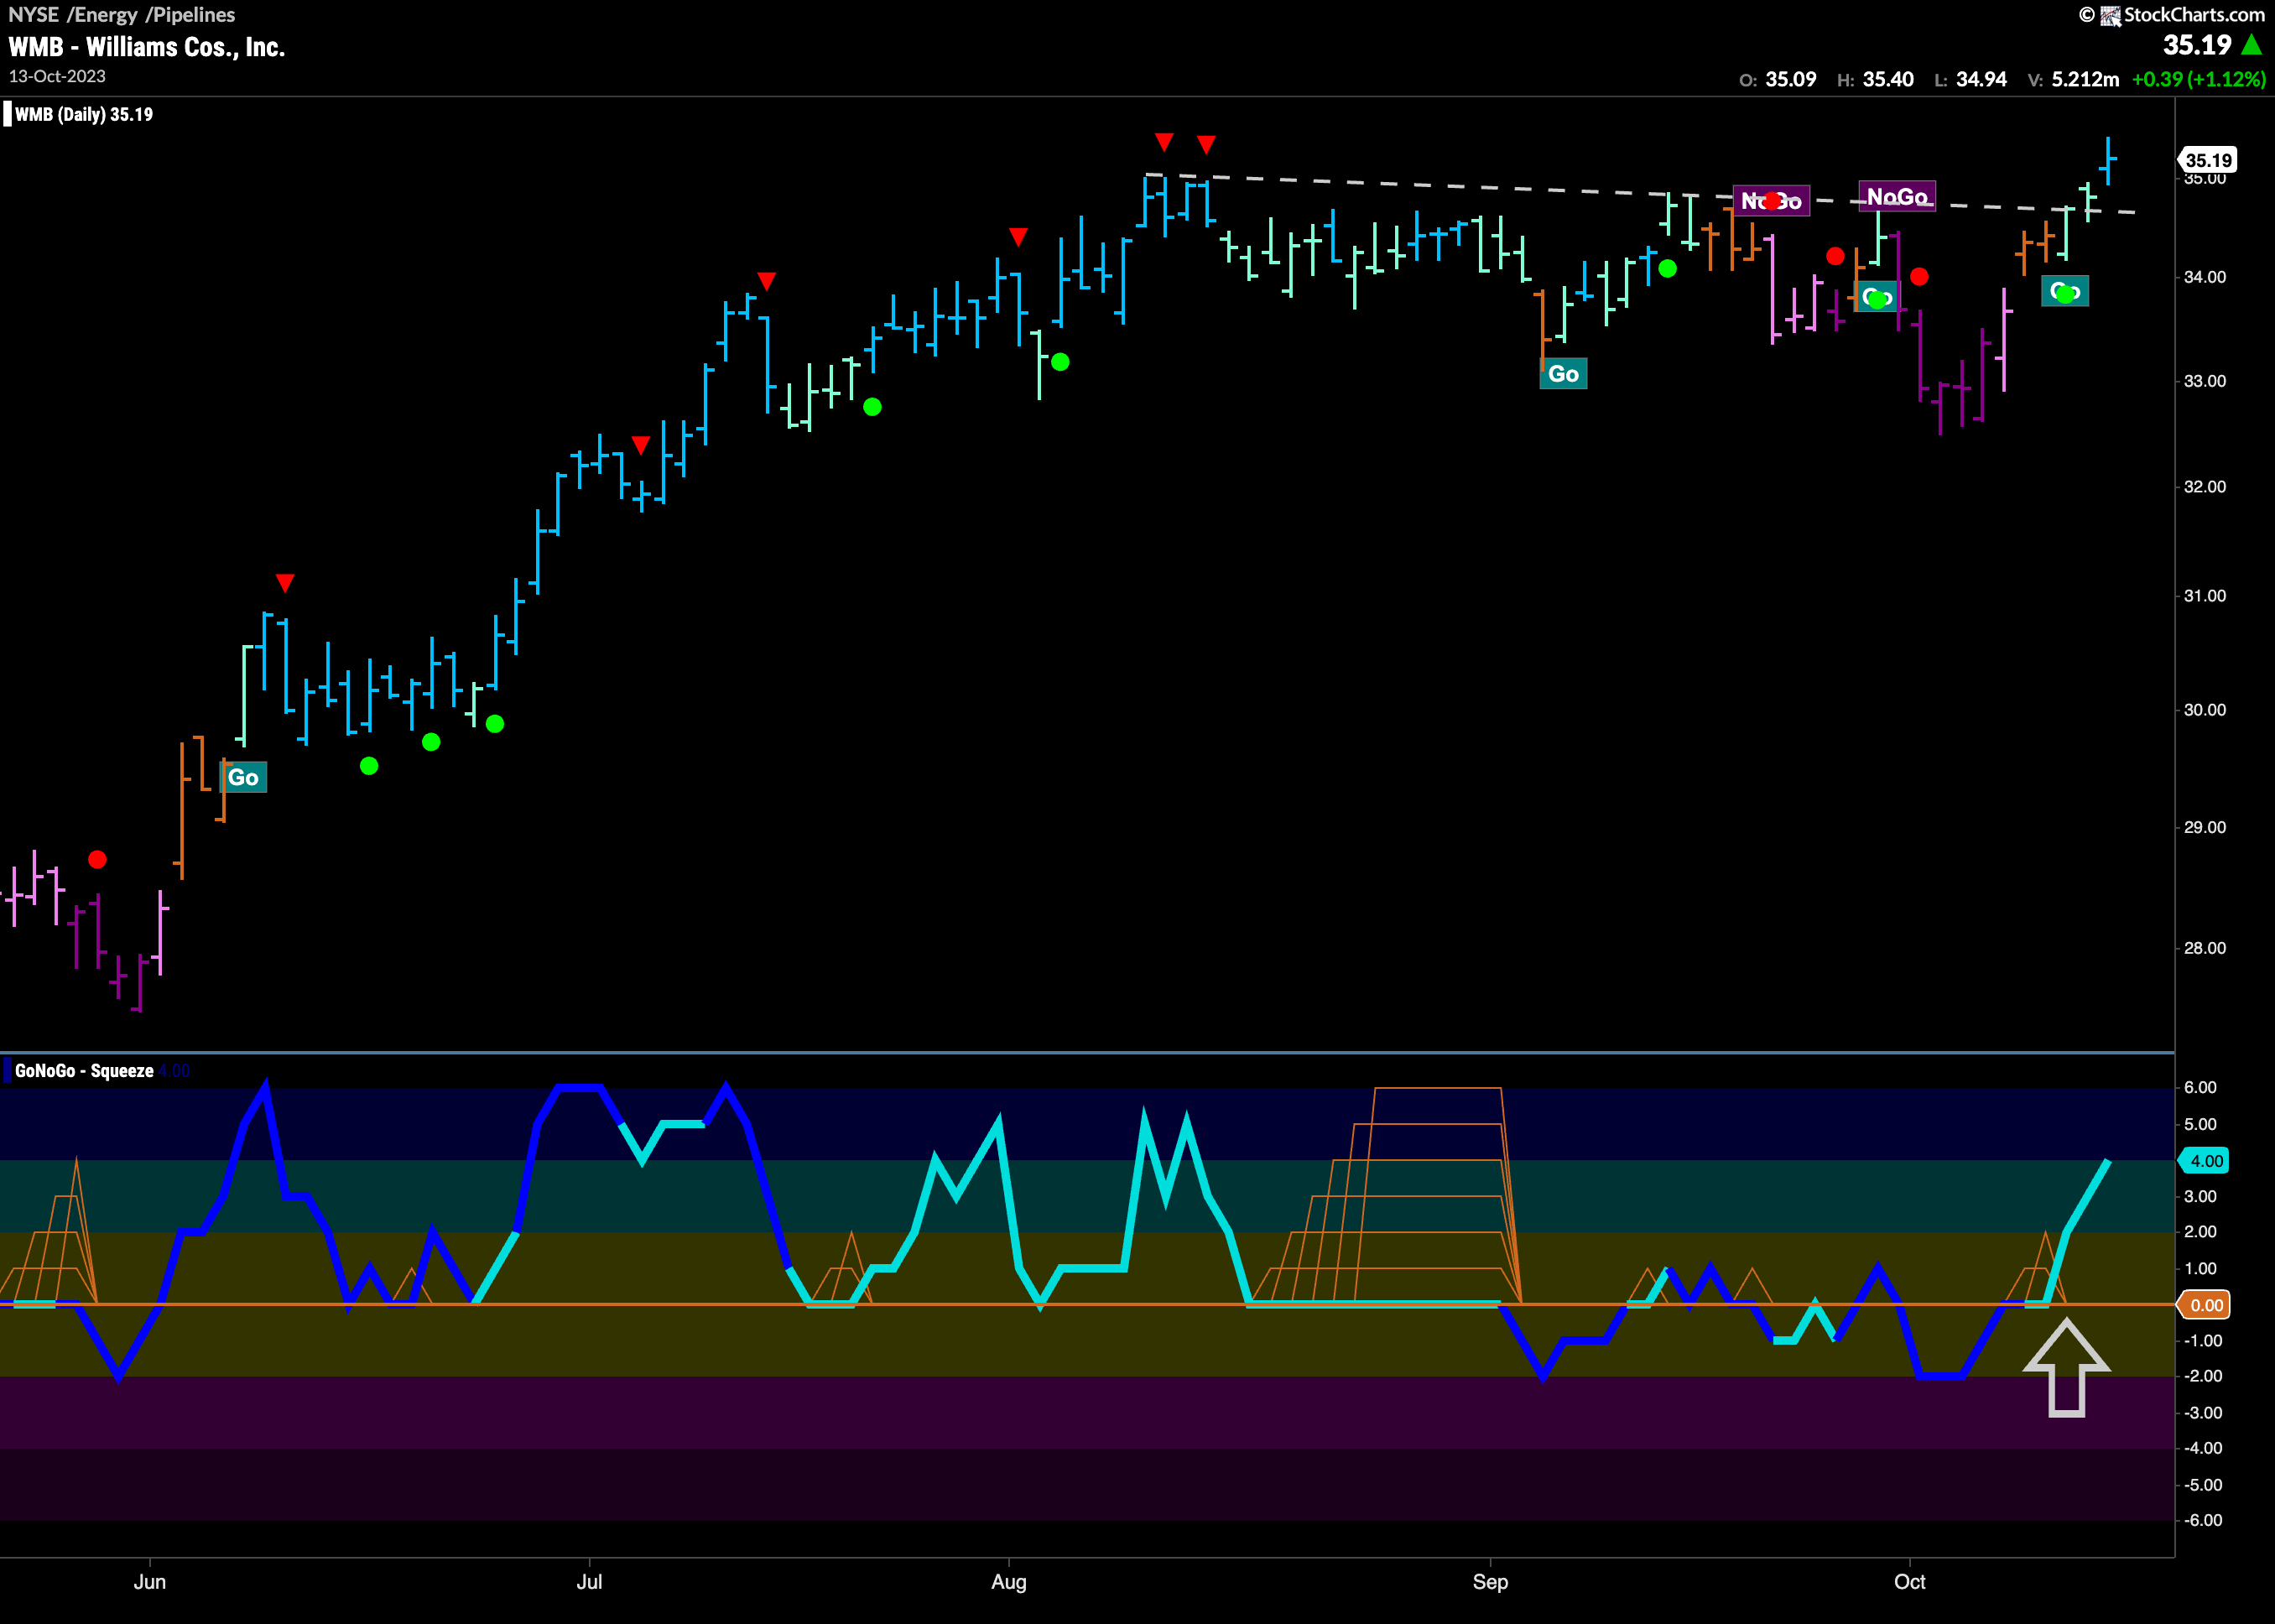
One of the securities in the pipelines index is $WMB. The chart below shows that it has broken out above a downward sloping trend line. The most recent bar is also strong blue as the new “Go” trend intensifies. GoNogo Oscillator has also been able to clearly distance itself from the zero line for the first time in a while. We will look to see if this spurs price even higher.
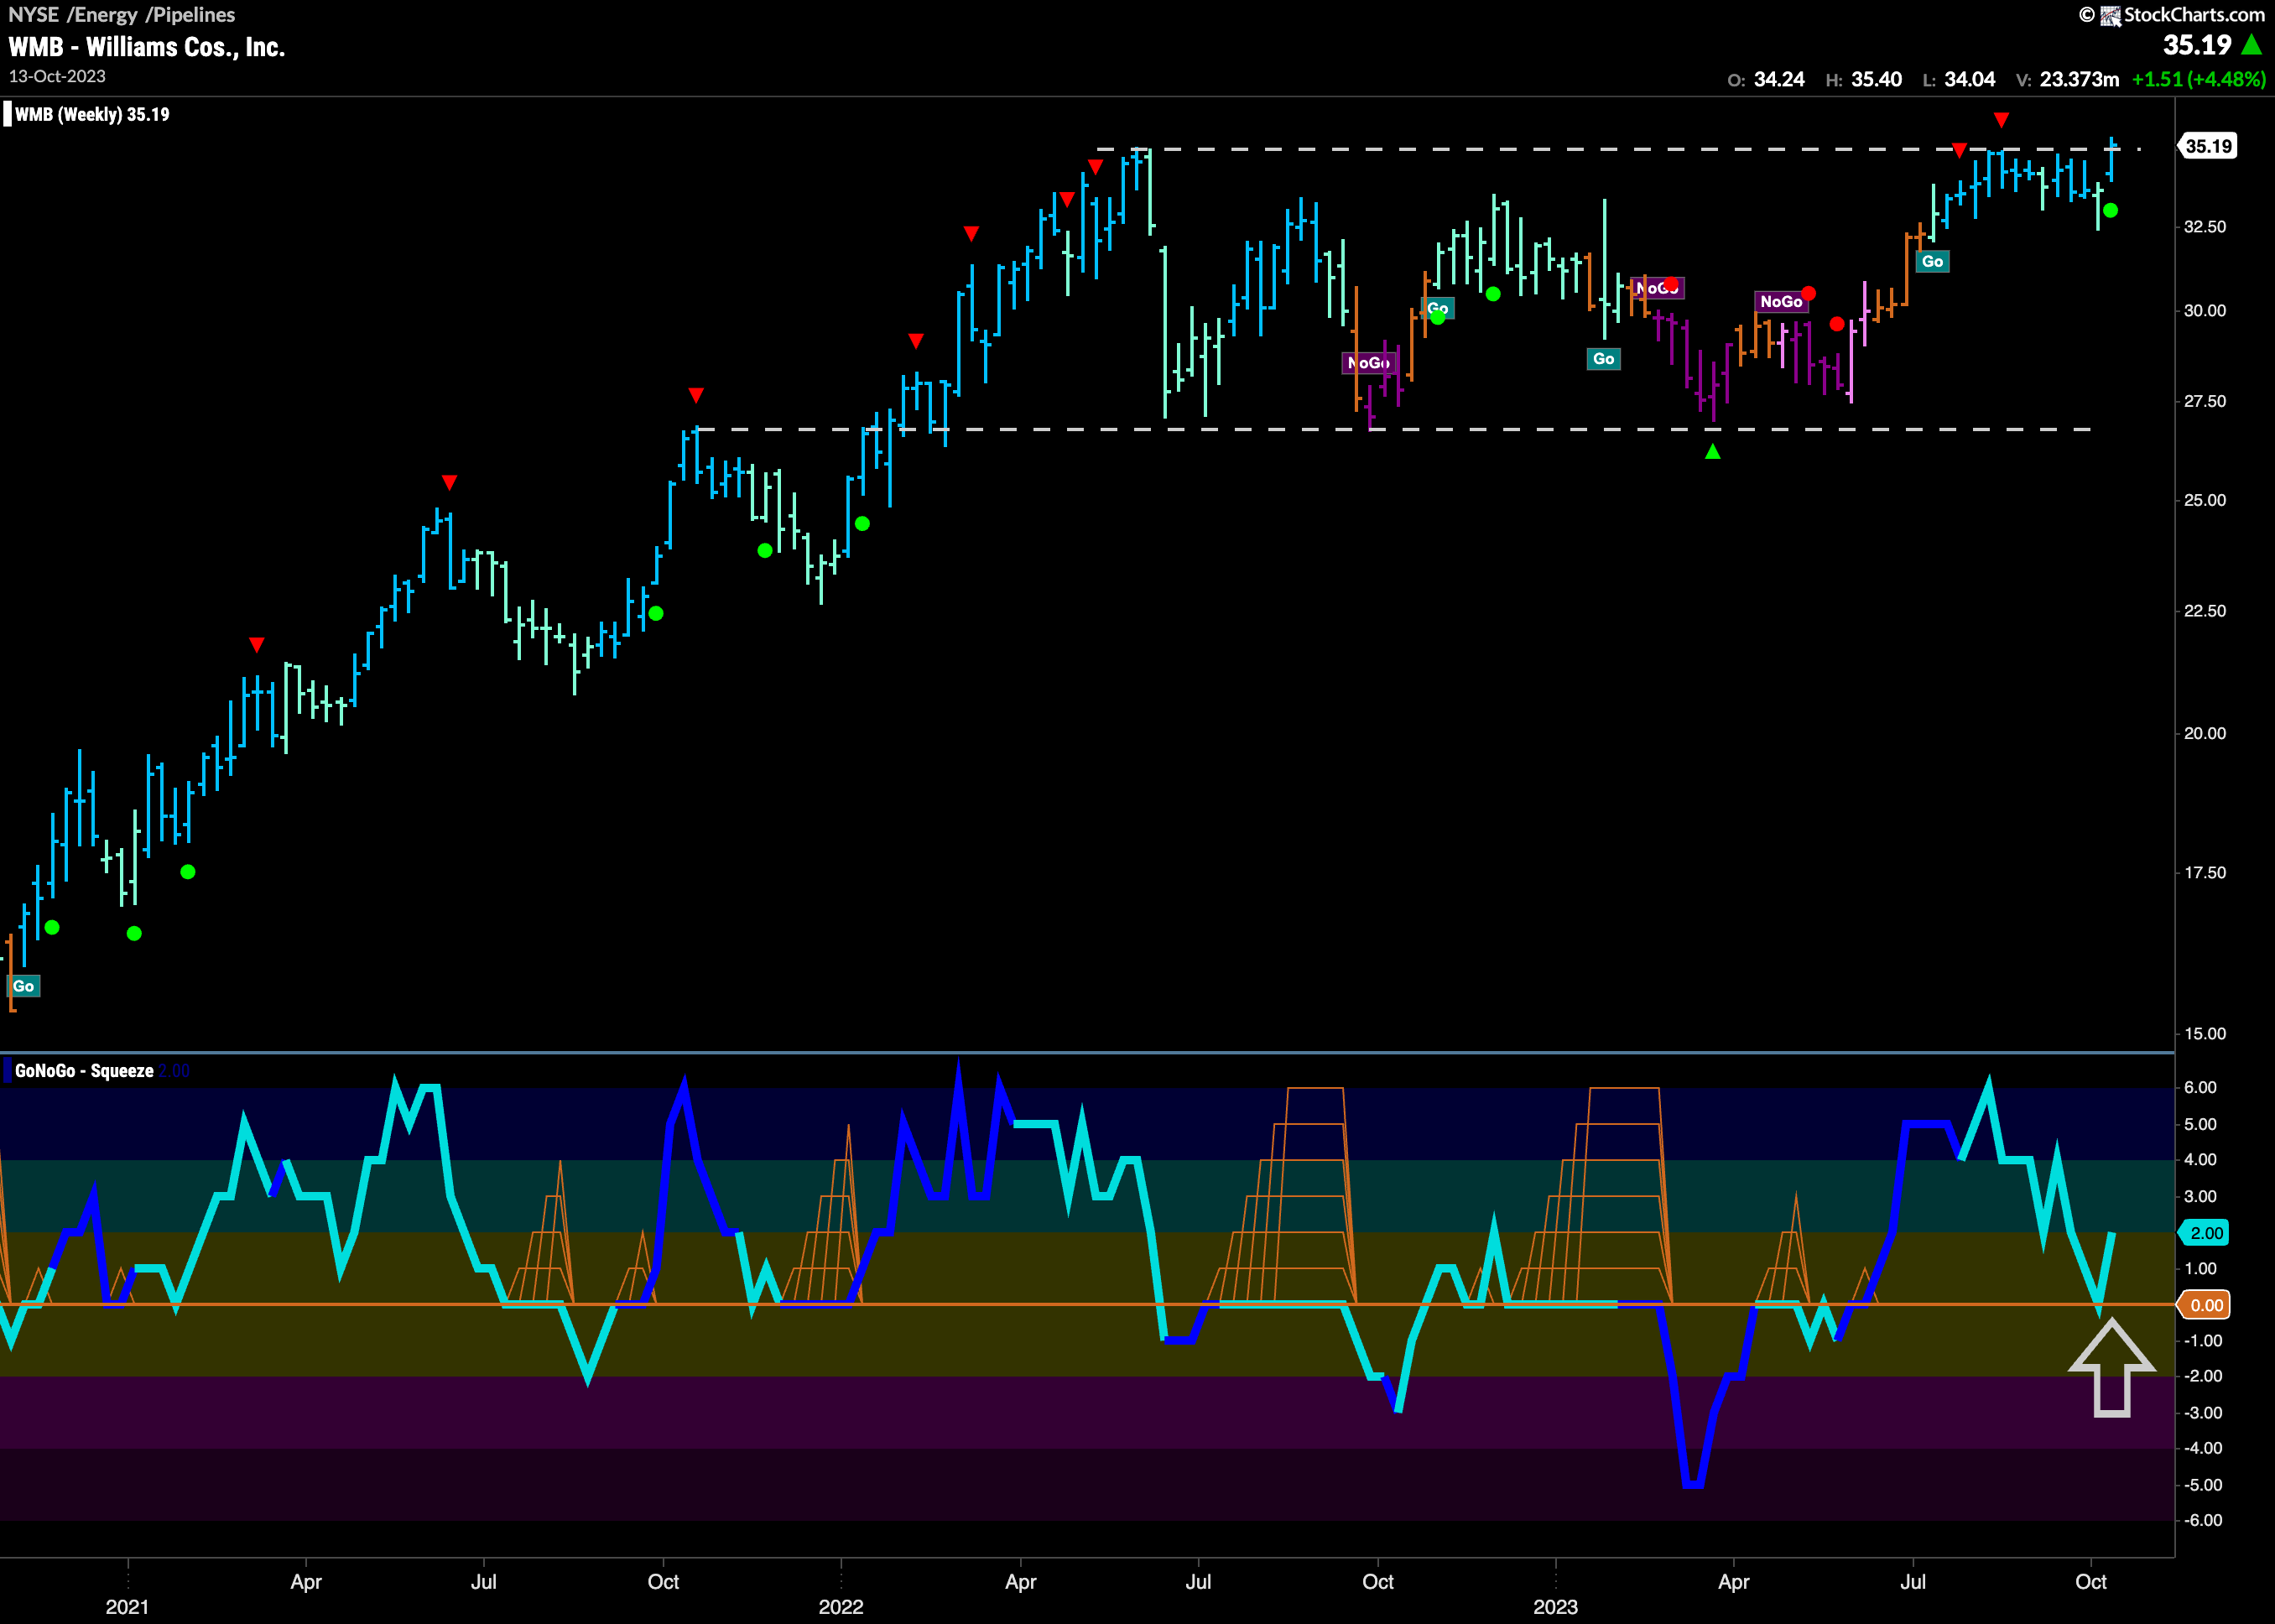
A look at the weekly chart shows just how important any further price gains could be. If we can set a new higher high that would also break out of a large channel that has seen price trading mostly sideways for over a year. On this longer term chart, the GoNoGo Oscillator has just found support at the zero line triggering a Go Trend Continuation Icon (green circle) and so we will watch to see if that is enough to propel price to new highs, breaking out above the horizontal resistance we see on the chart.
