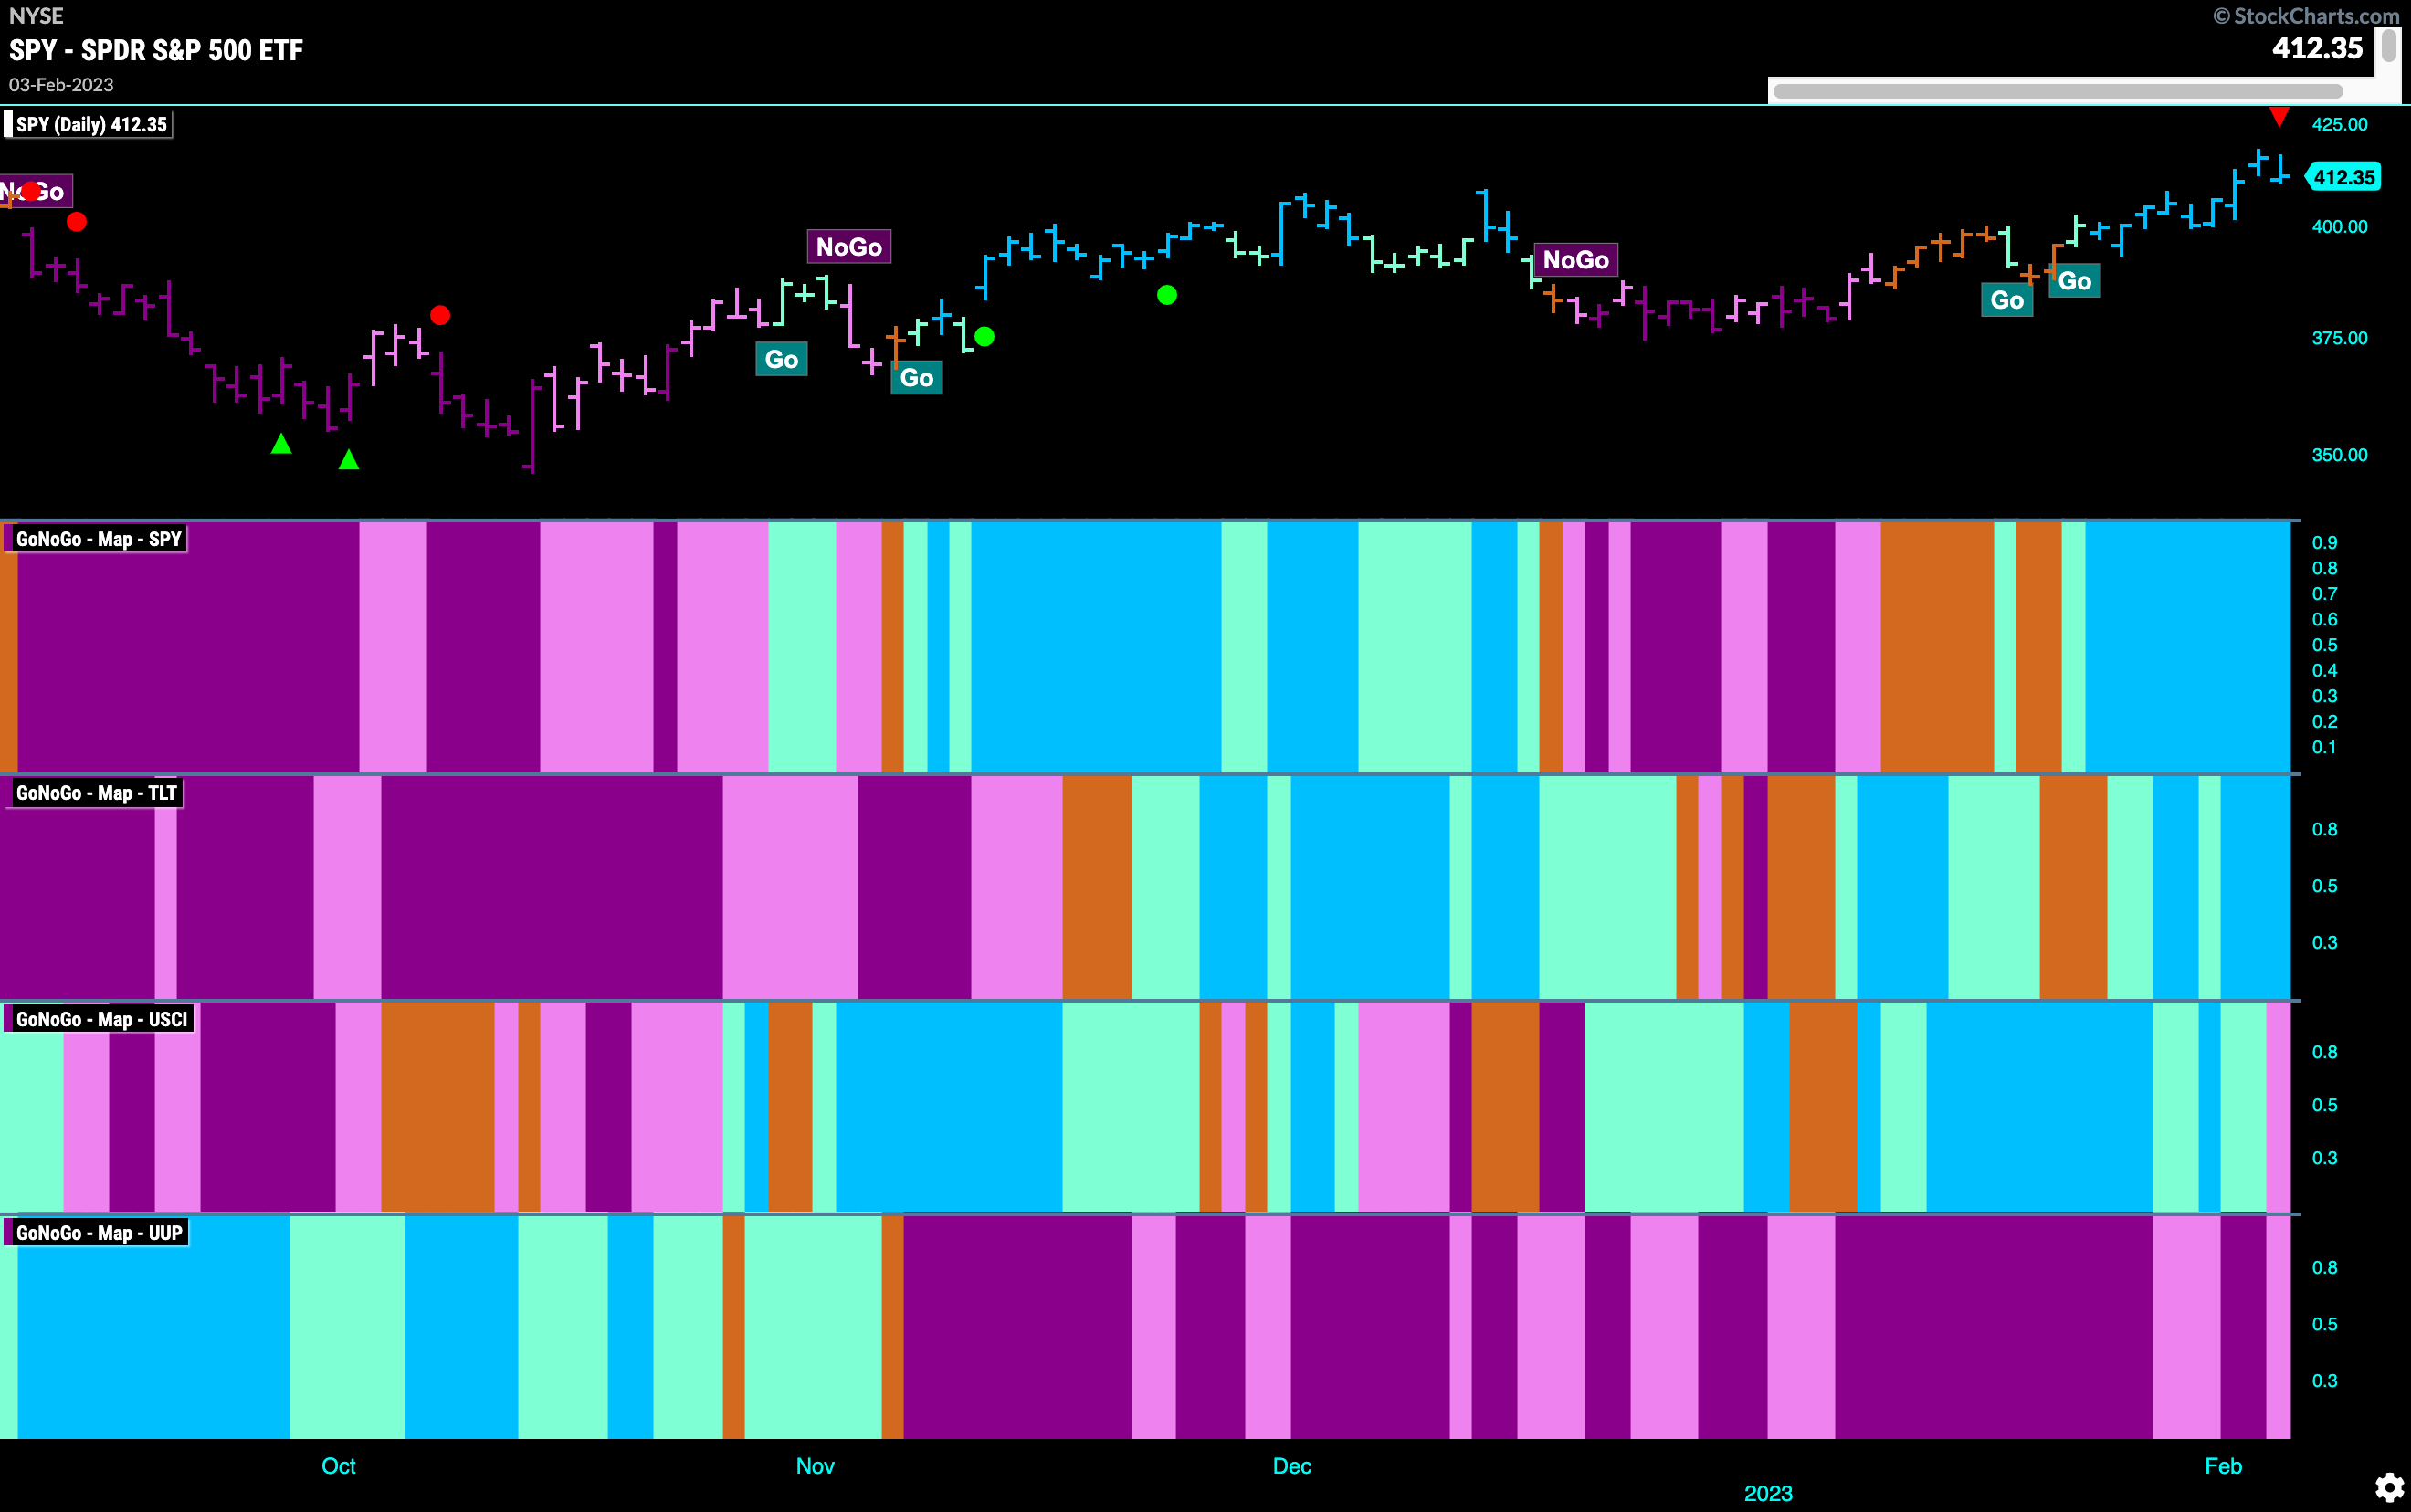
Good morning and welcome to this week’s Flight Path. Let’s take a look at the GoNoGo Asset map below. Equities were able to maintain a “Go” trend this week as we saw a string of strong blue bars. Treasury bond prices also remained in a “Go” but we saw commodities falter at the end of the week painting a weak pink “NoGo” bar. The dollar continued in its “NoGo” trend but that trend did show signs of weakness as we saw several weaker pink bars.
Equities Set New High this Week
GoNoGo Trend shows price painted a string of uninterrupted strong blue “Go” bars this week as price moved higher into Thursday. The last bar of the week saw a reaction against that and triggered a Go Countertrend Correction Icon (red arrow) that suggests in the short term it may struggle to go higher. GoNoGo Oscillator is now out of overbought territory and volume is heavy. 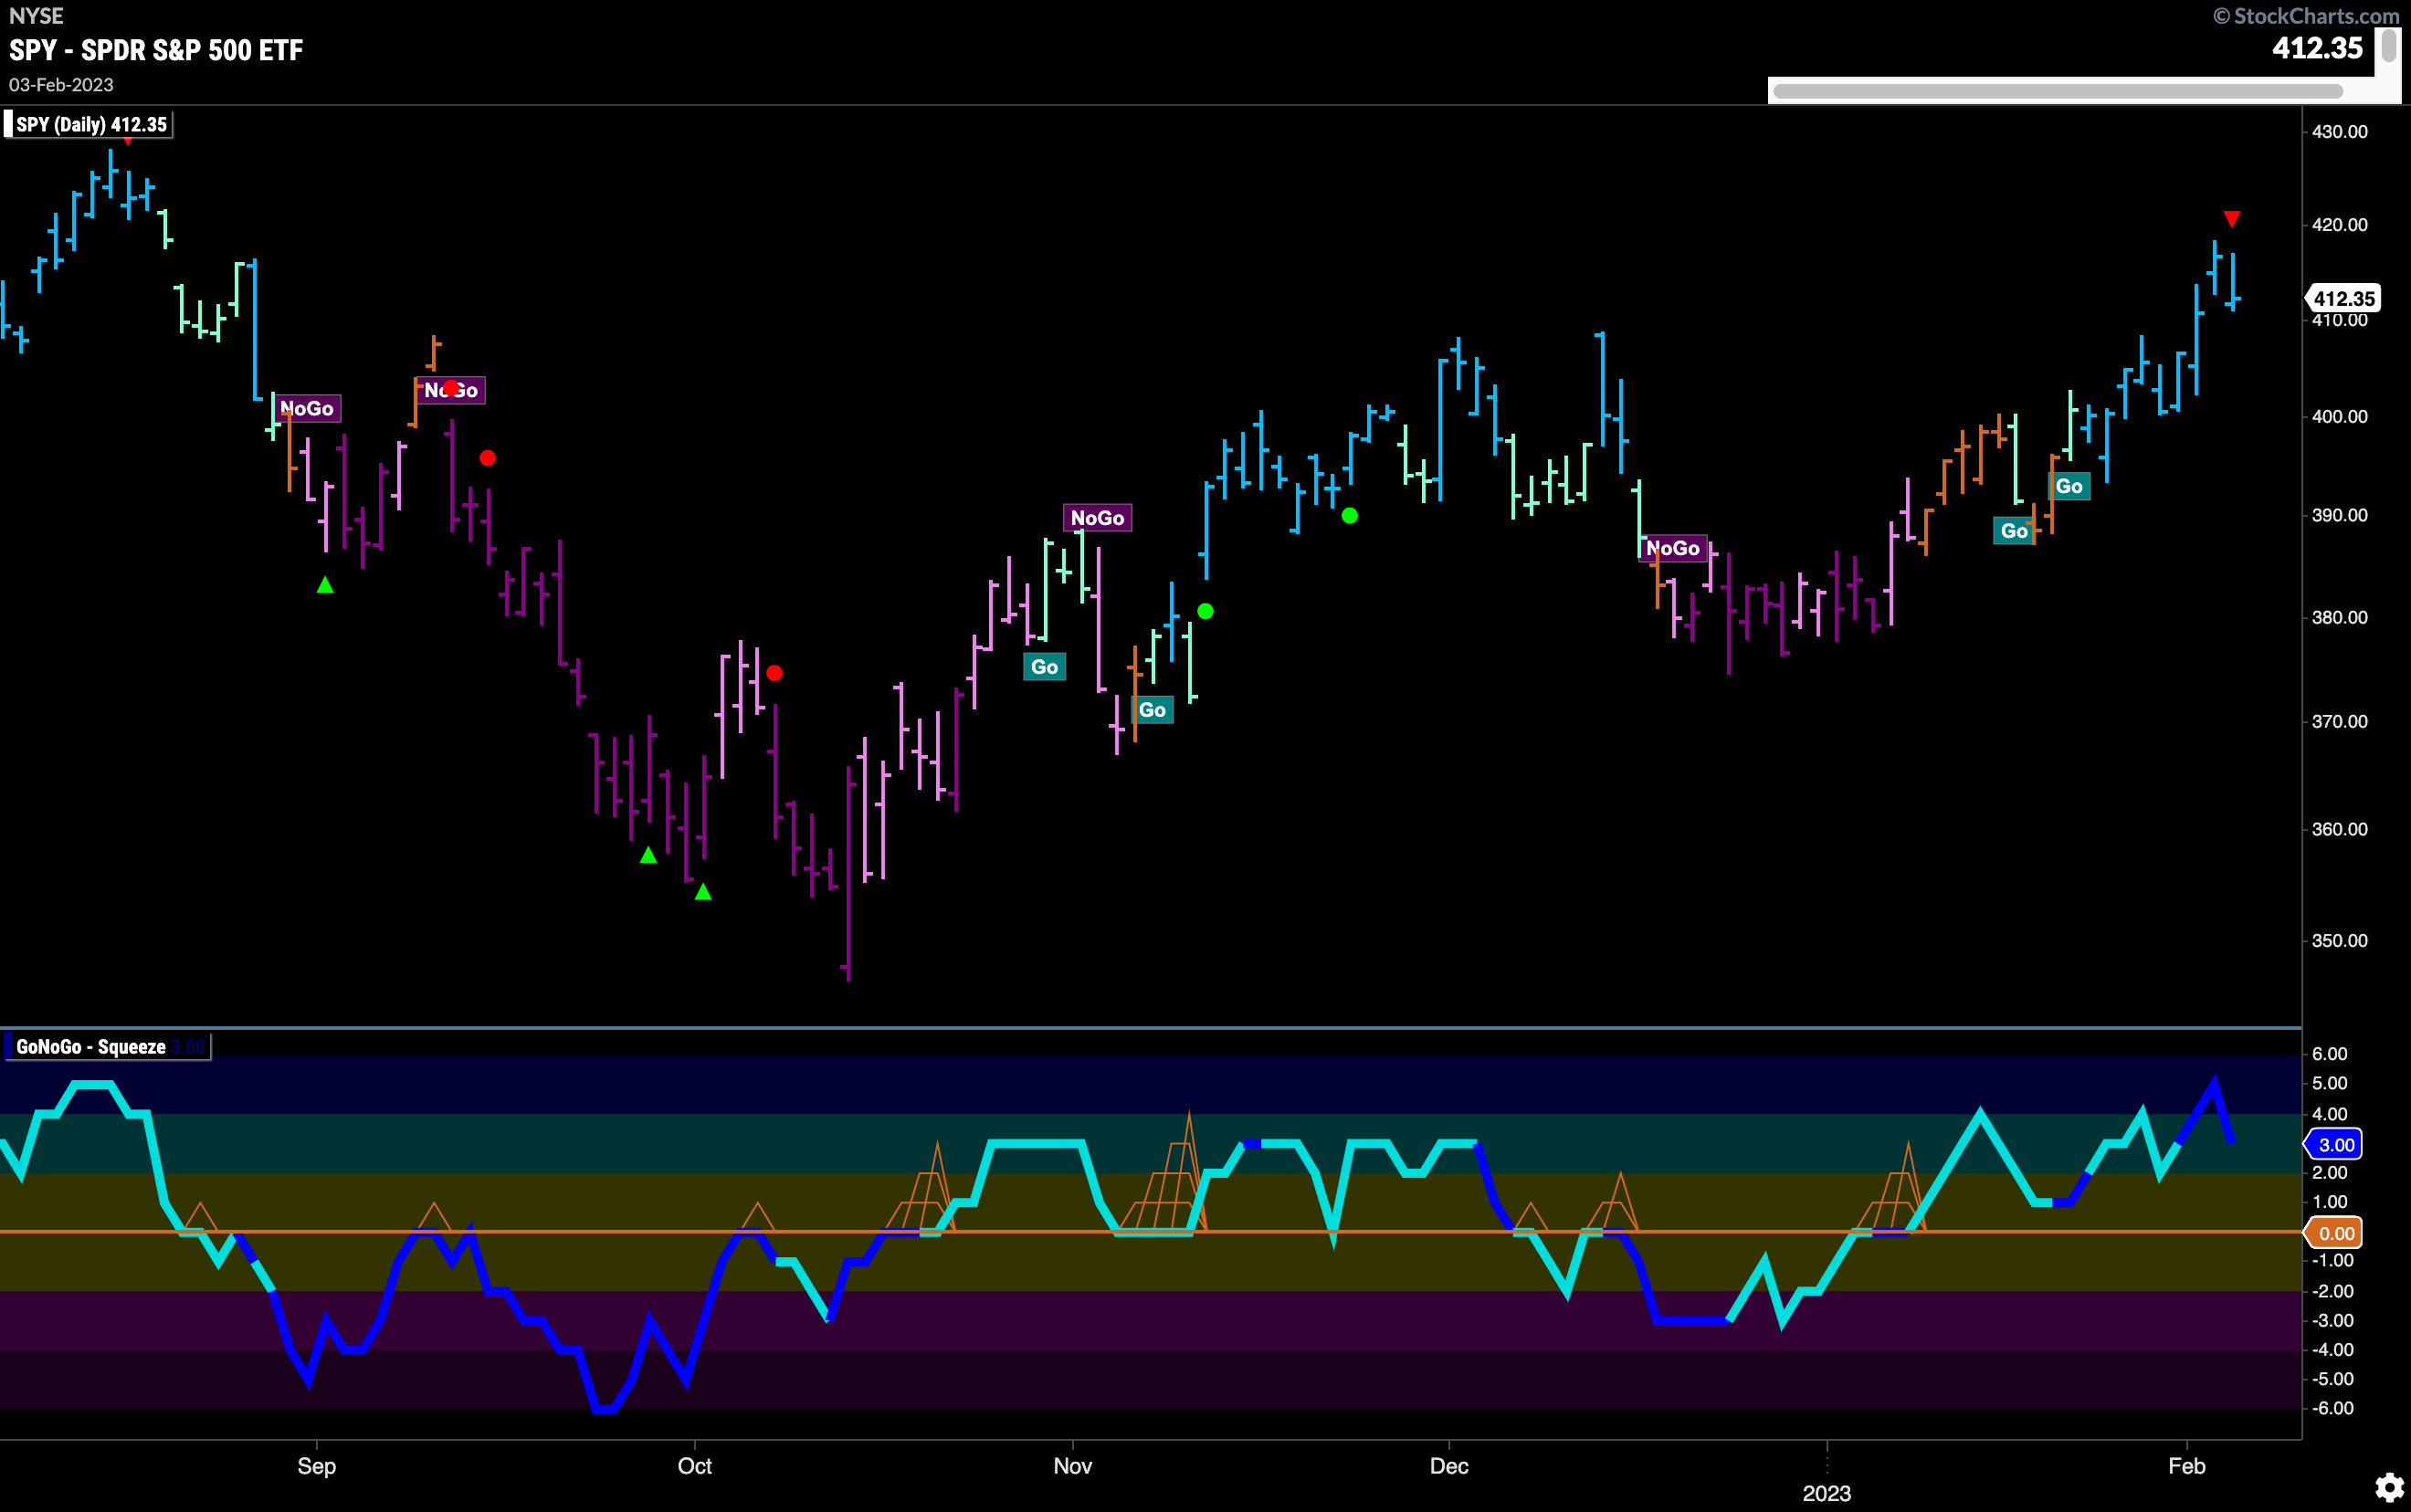
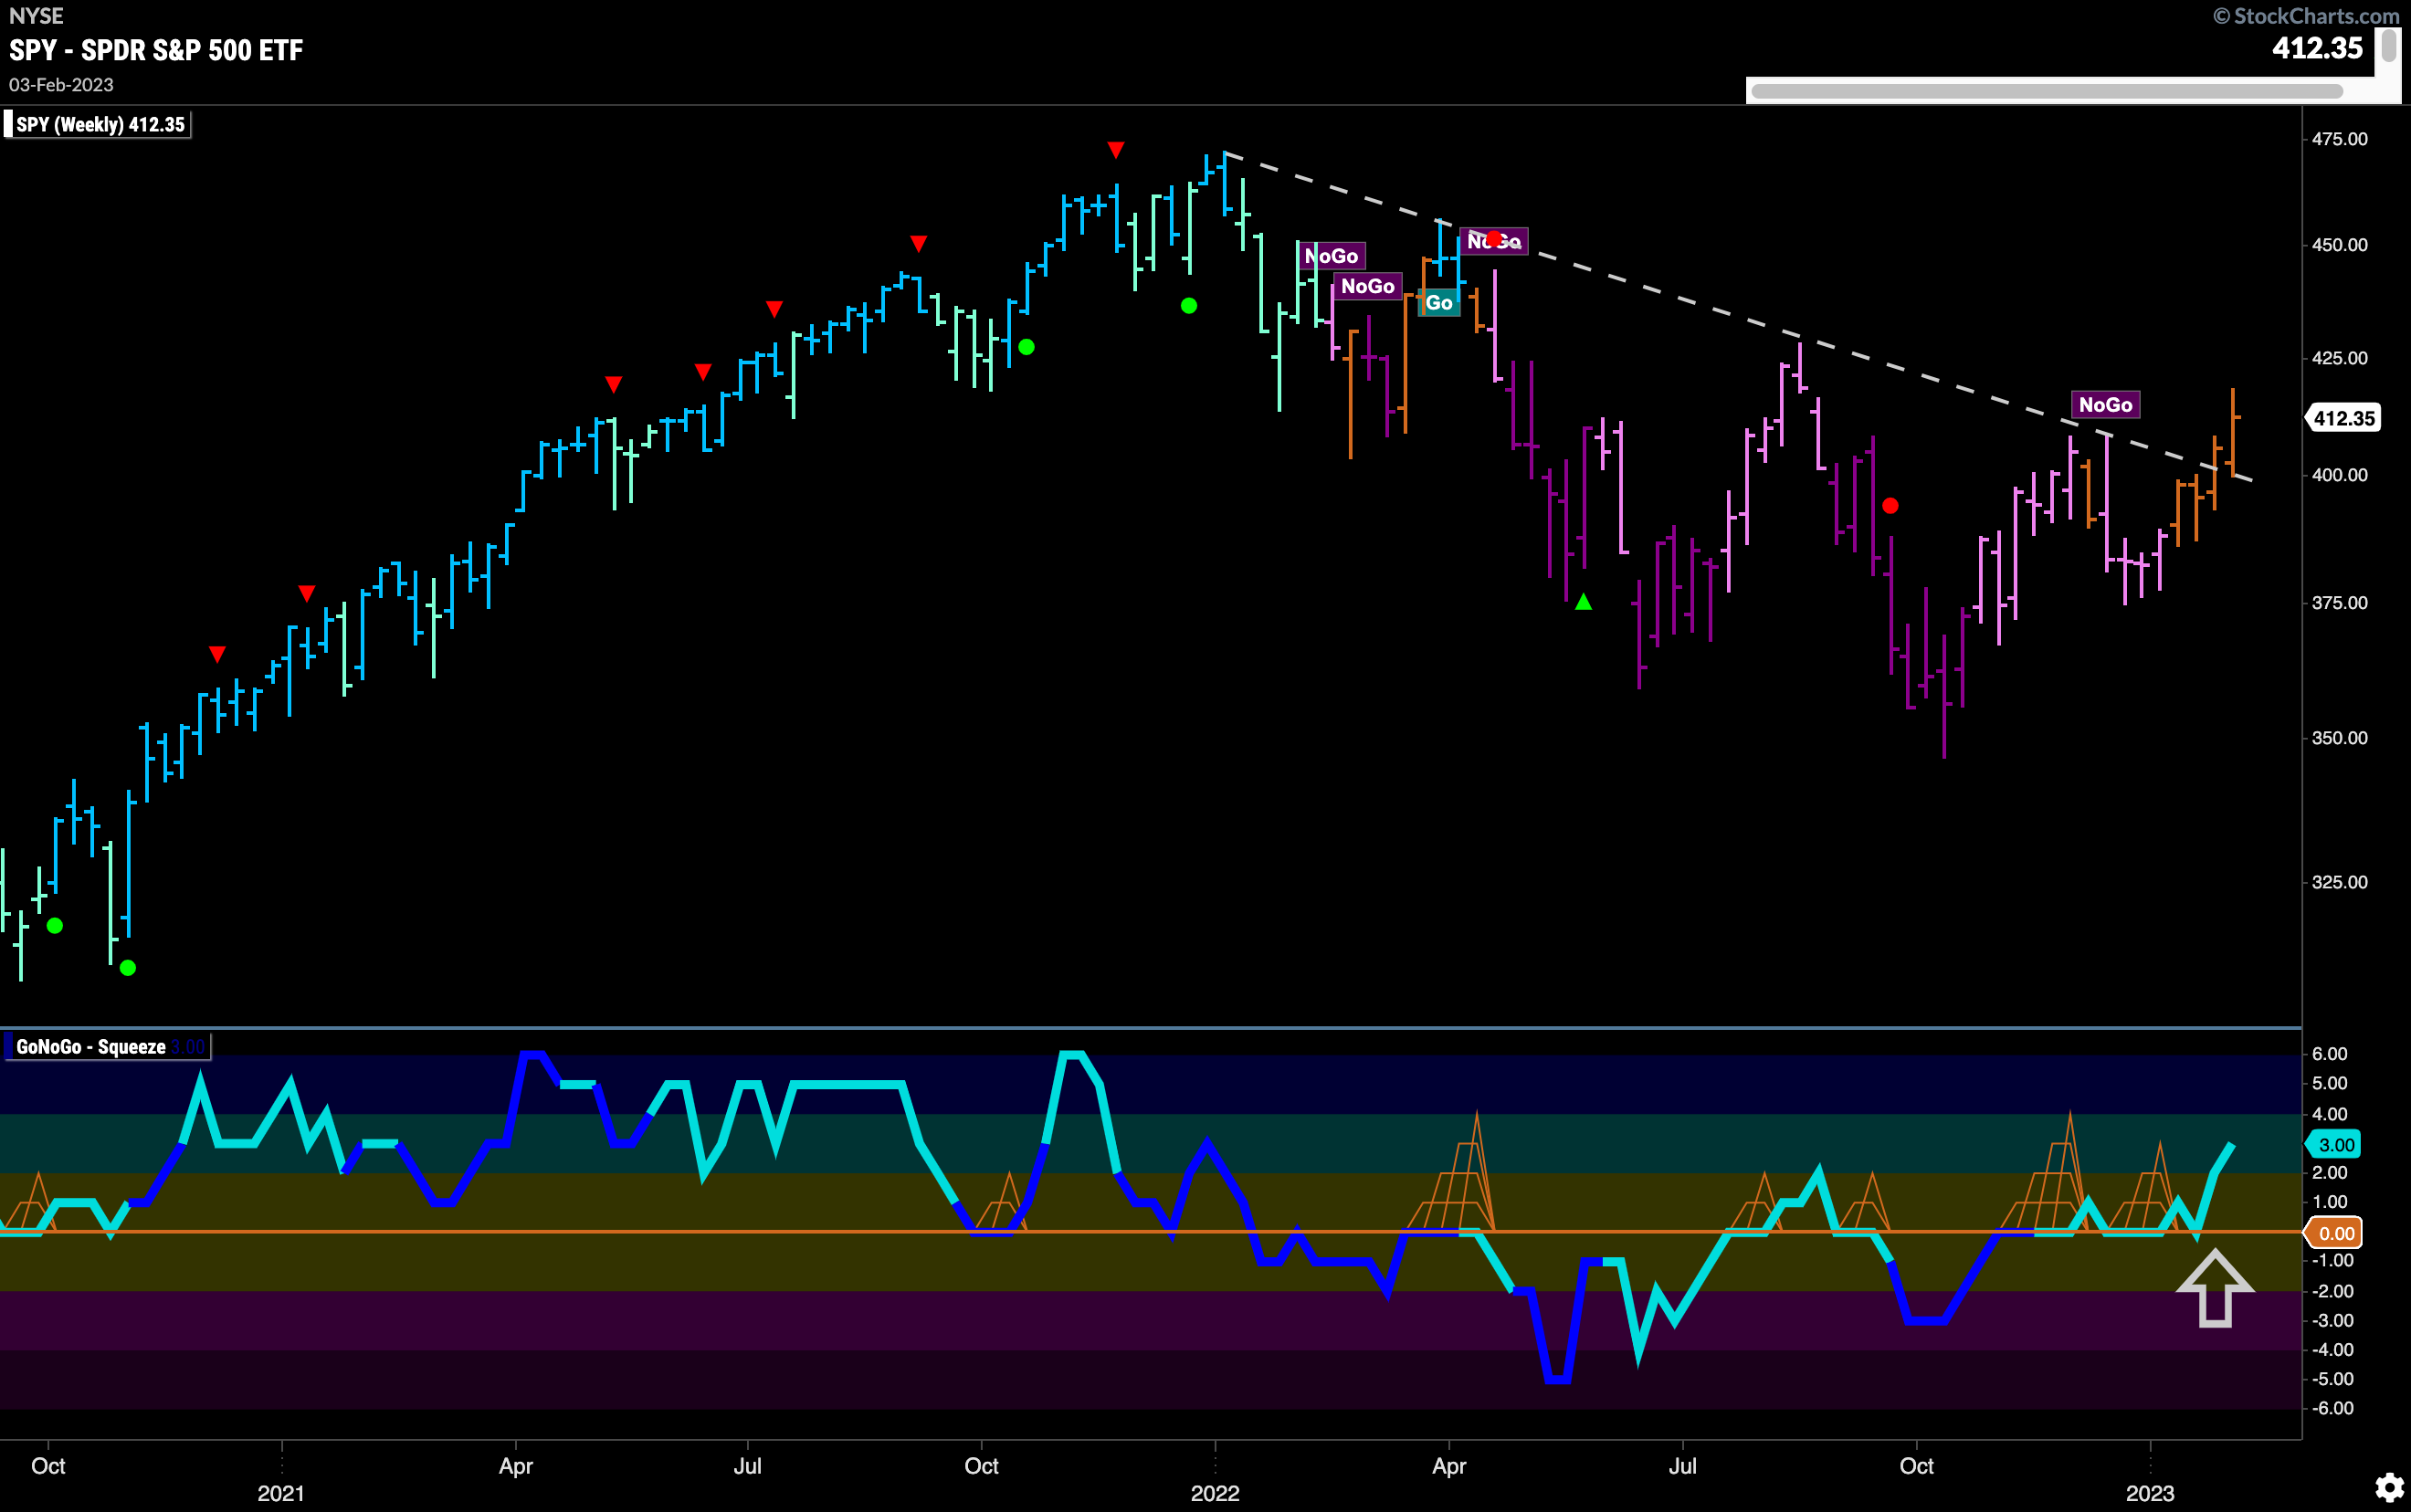
The longer term weekly chart shows a string of amber “Go Fish” bars now as price closed well above the downward sloping trend line. After struggling to move away from the zero line for a few months we saw a significant move higher into positive territory this week. If price can consolidate at or above these levels we will likely see GoNoGo Trend change in the price panel.
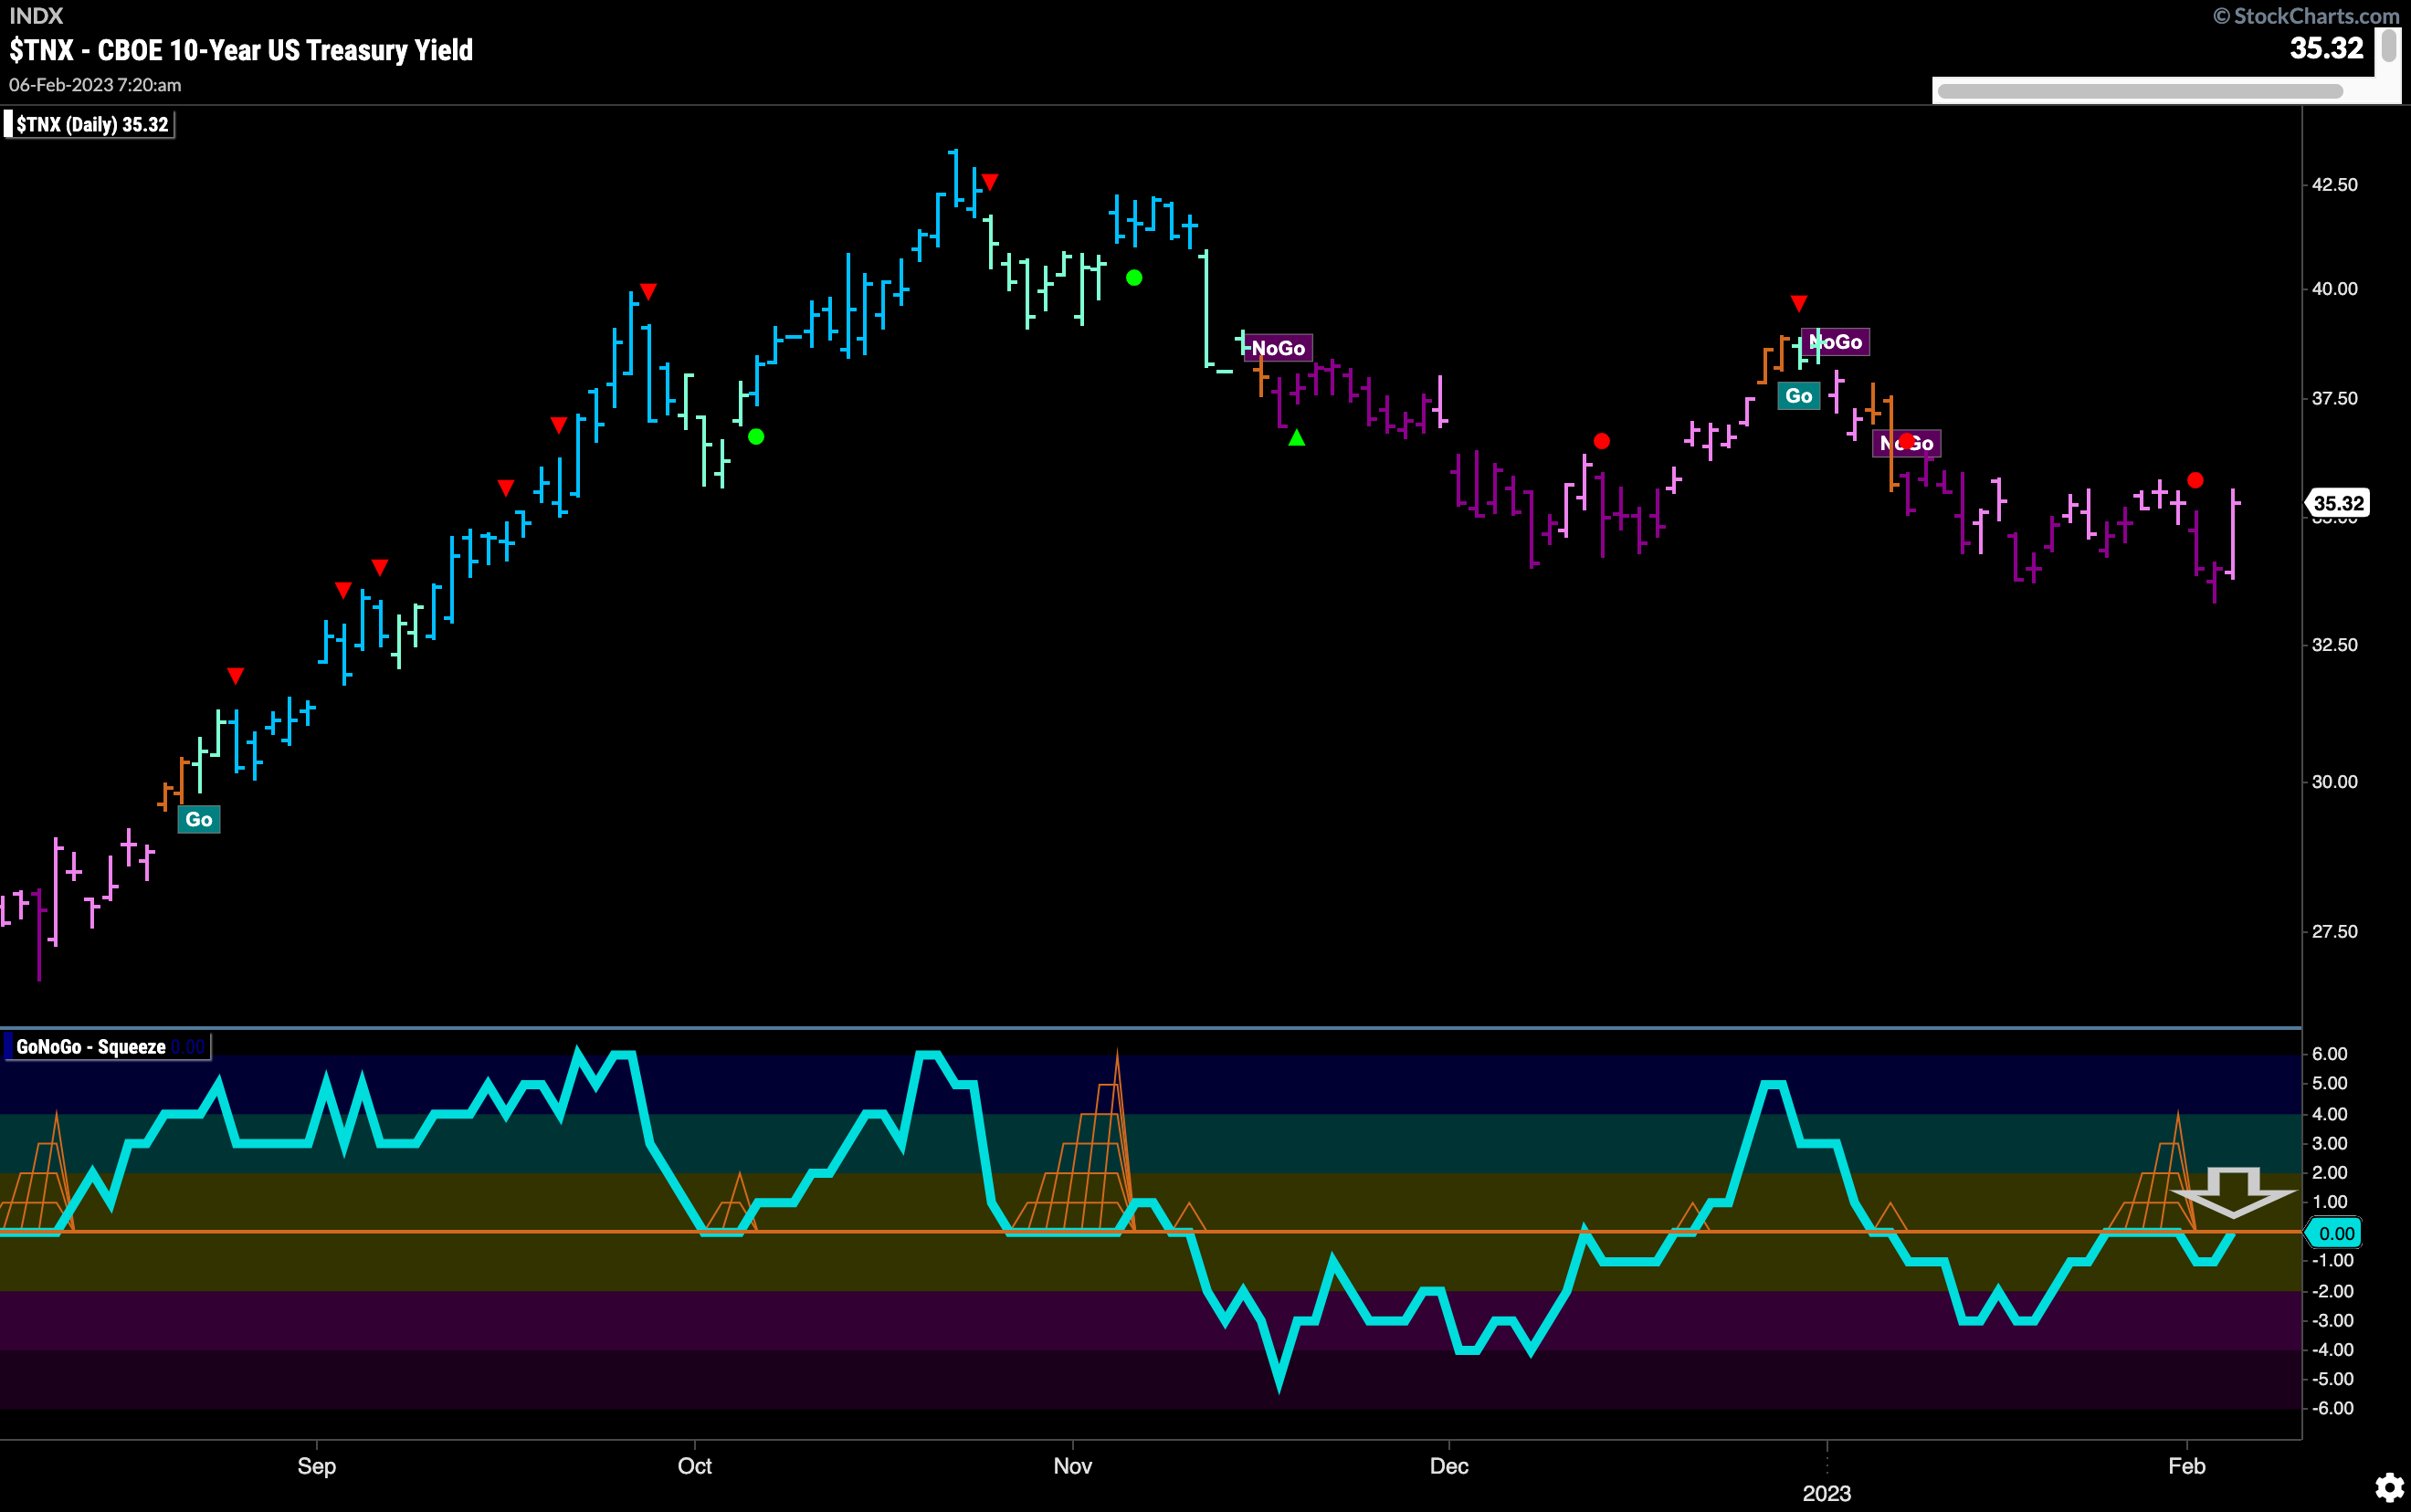
Treasury Rates Remain in “NoGo” but find Support Again
Treasury rates had a strong last bar of the week as price rallied from pattern lows and closed the day painting a pink “NoGo” bar. This caused GoNoGo Oscillator to rise to test the zero line again from below. This is an important inflection point and we will watch to see if it serves as resistance here. If it does, and the oscillator moves back into negative territory then we will know that momentum has remained on the side of the “NoGo” and can expect an attempt at new lows. If the opposite happens, and price moves enough to send the oscillator into positive territory then that would likely be a threat to the “NoGo”.
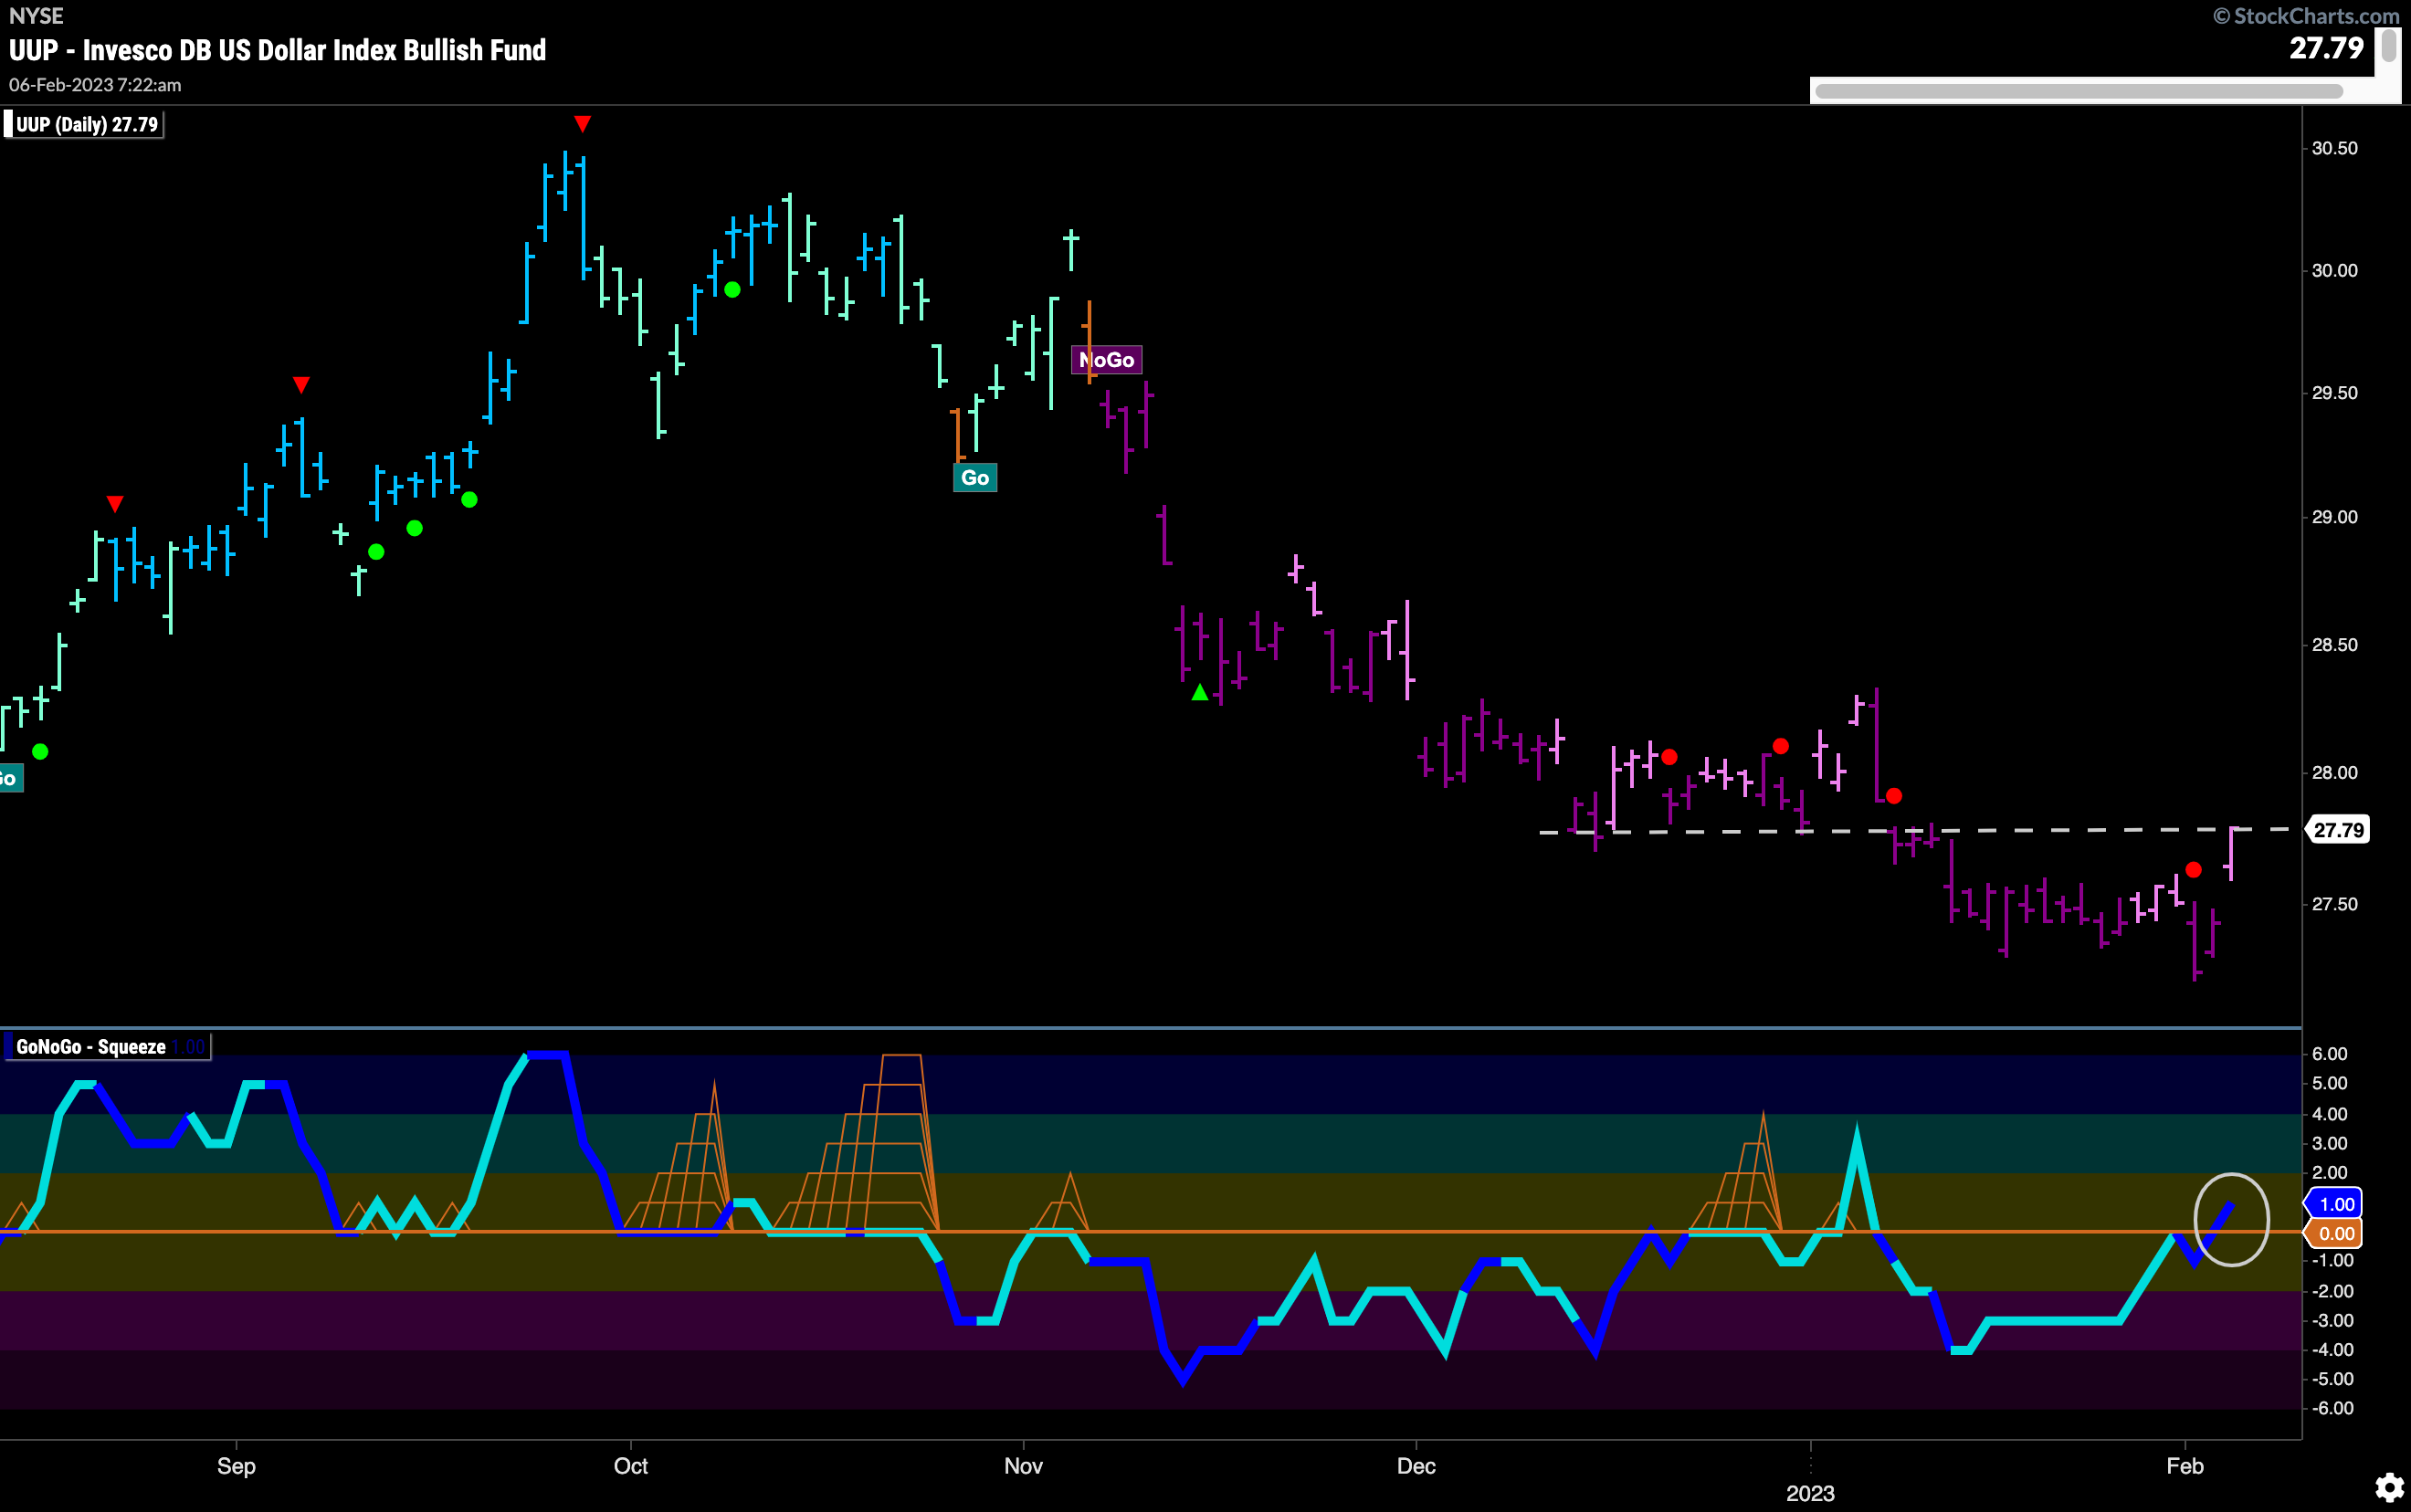
The Dollar Testing Resistance After Strong End to the Week
As we saw with rates, the dollar had a strong day Friday. The concept of polarity is playing out here, with support from earlier in the chart perhaps becoming resistance. We are also looking at the oscillator panel closely as it has nudged into positive territory on heavy volume. We will watch to see if momentum stays positive which could give price the push it needs to move higher and that would threaten the “NoGo” trend which has until now provided a tailwind for equities and other risk assets.
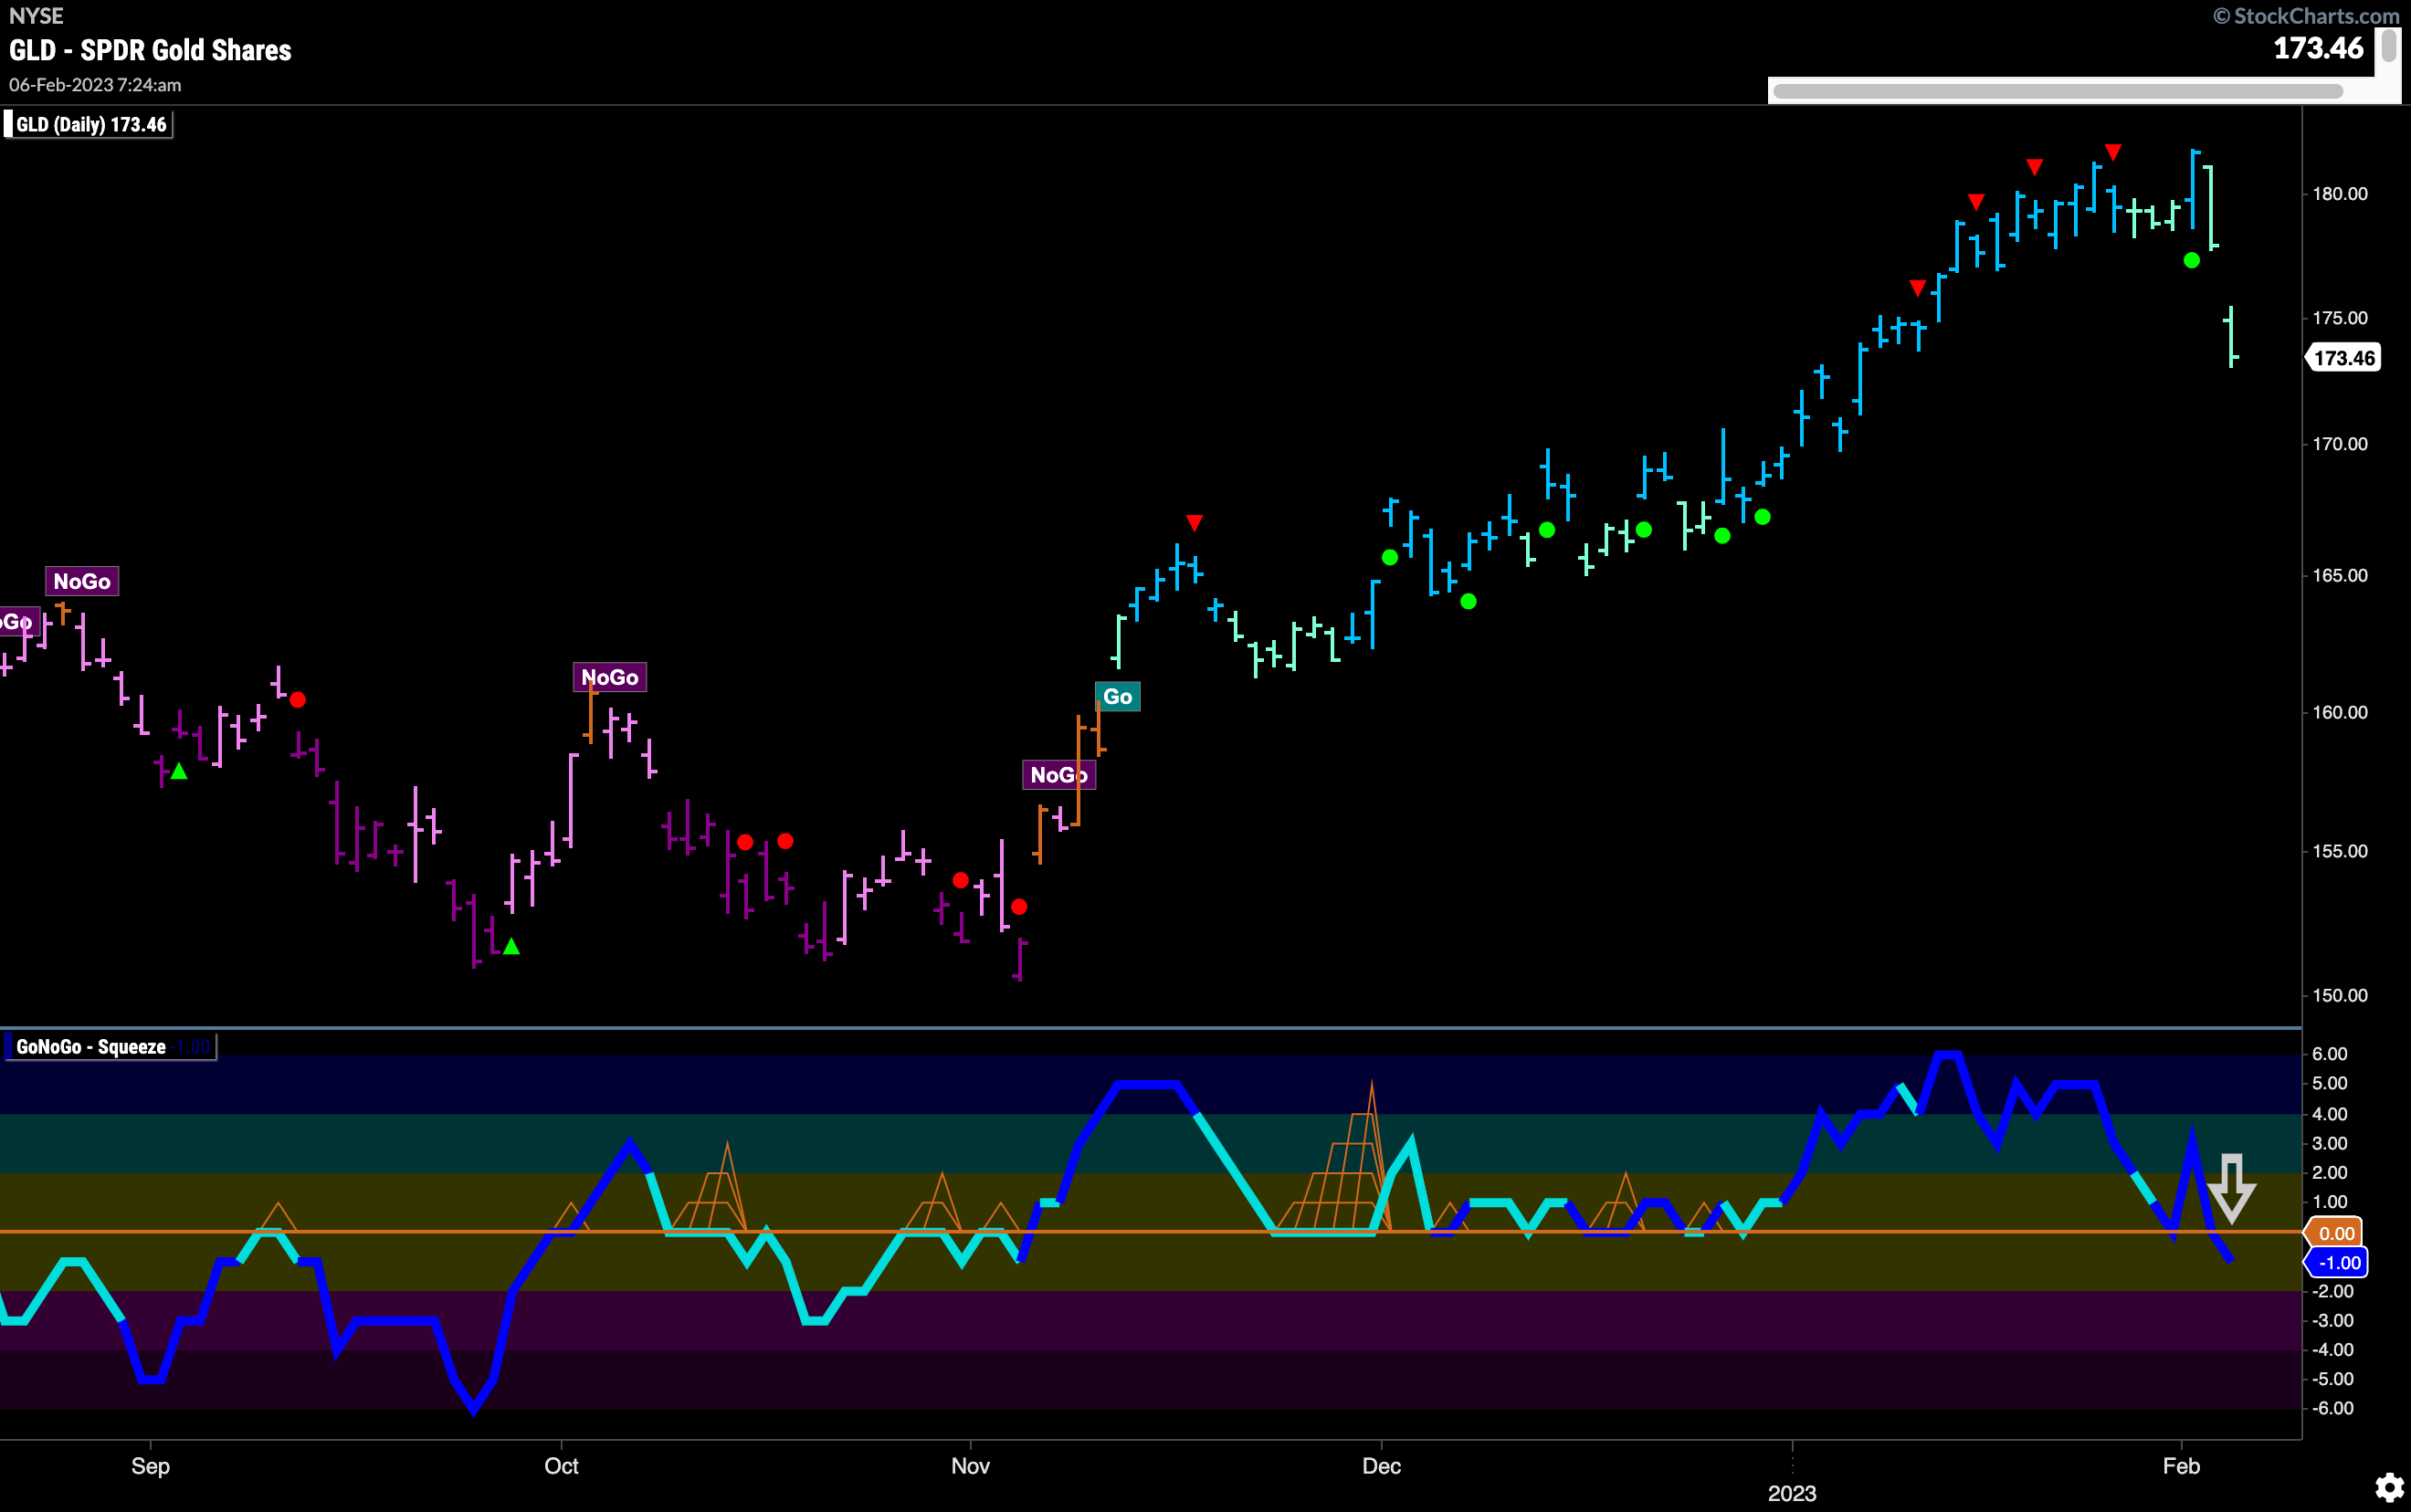
$GLD Takes a Tumble
Gold prices fell sharply on Friday and that saw GoNoGo Trend paint a second weaker aqua “Go” bar. This gap lower is not a good sign for the Gold bulls as it comes with GoNoGo Oscillator breaking below the zero line on heavy volume. We will look to see if that signals further price deterioration or if the oscillator can break back into positive territory as price consolidates.
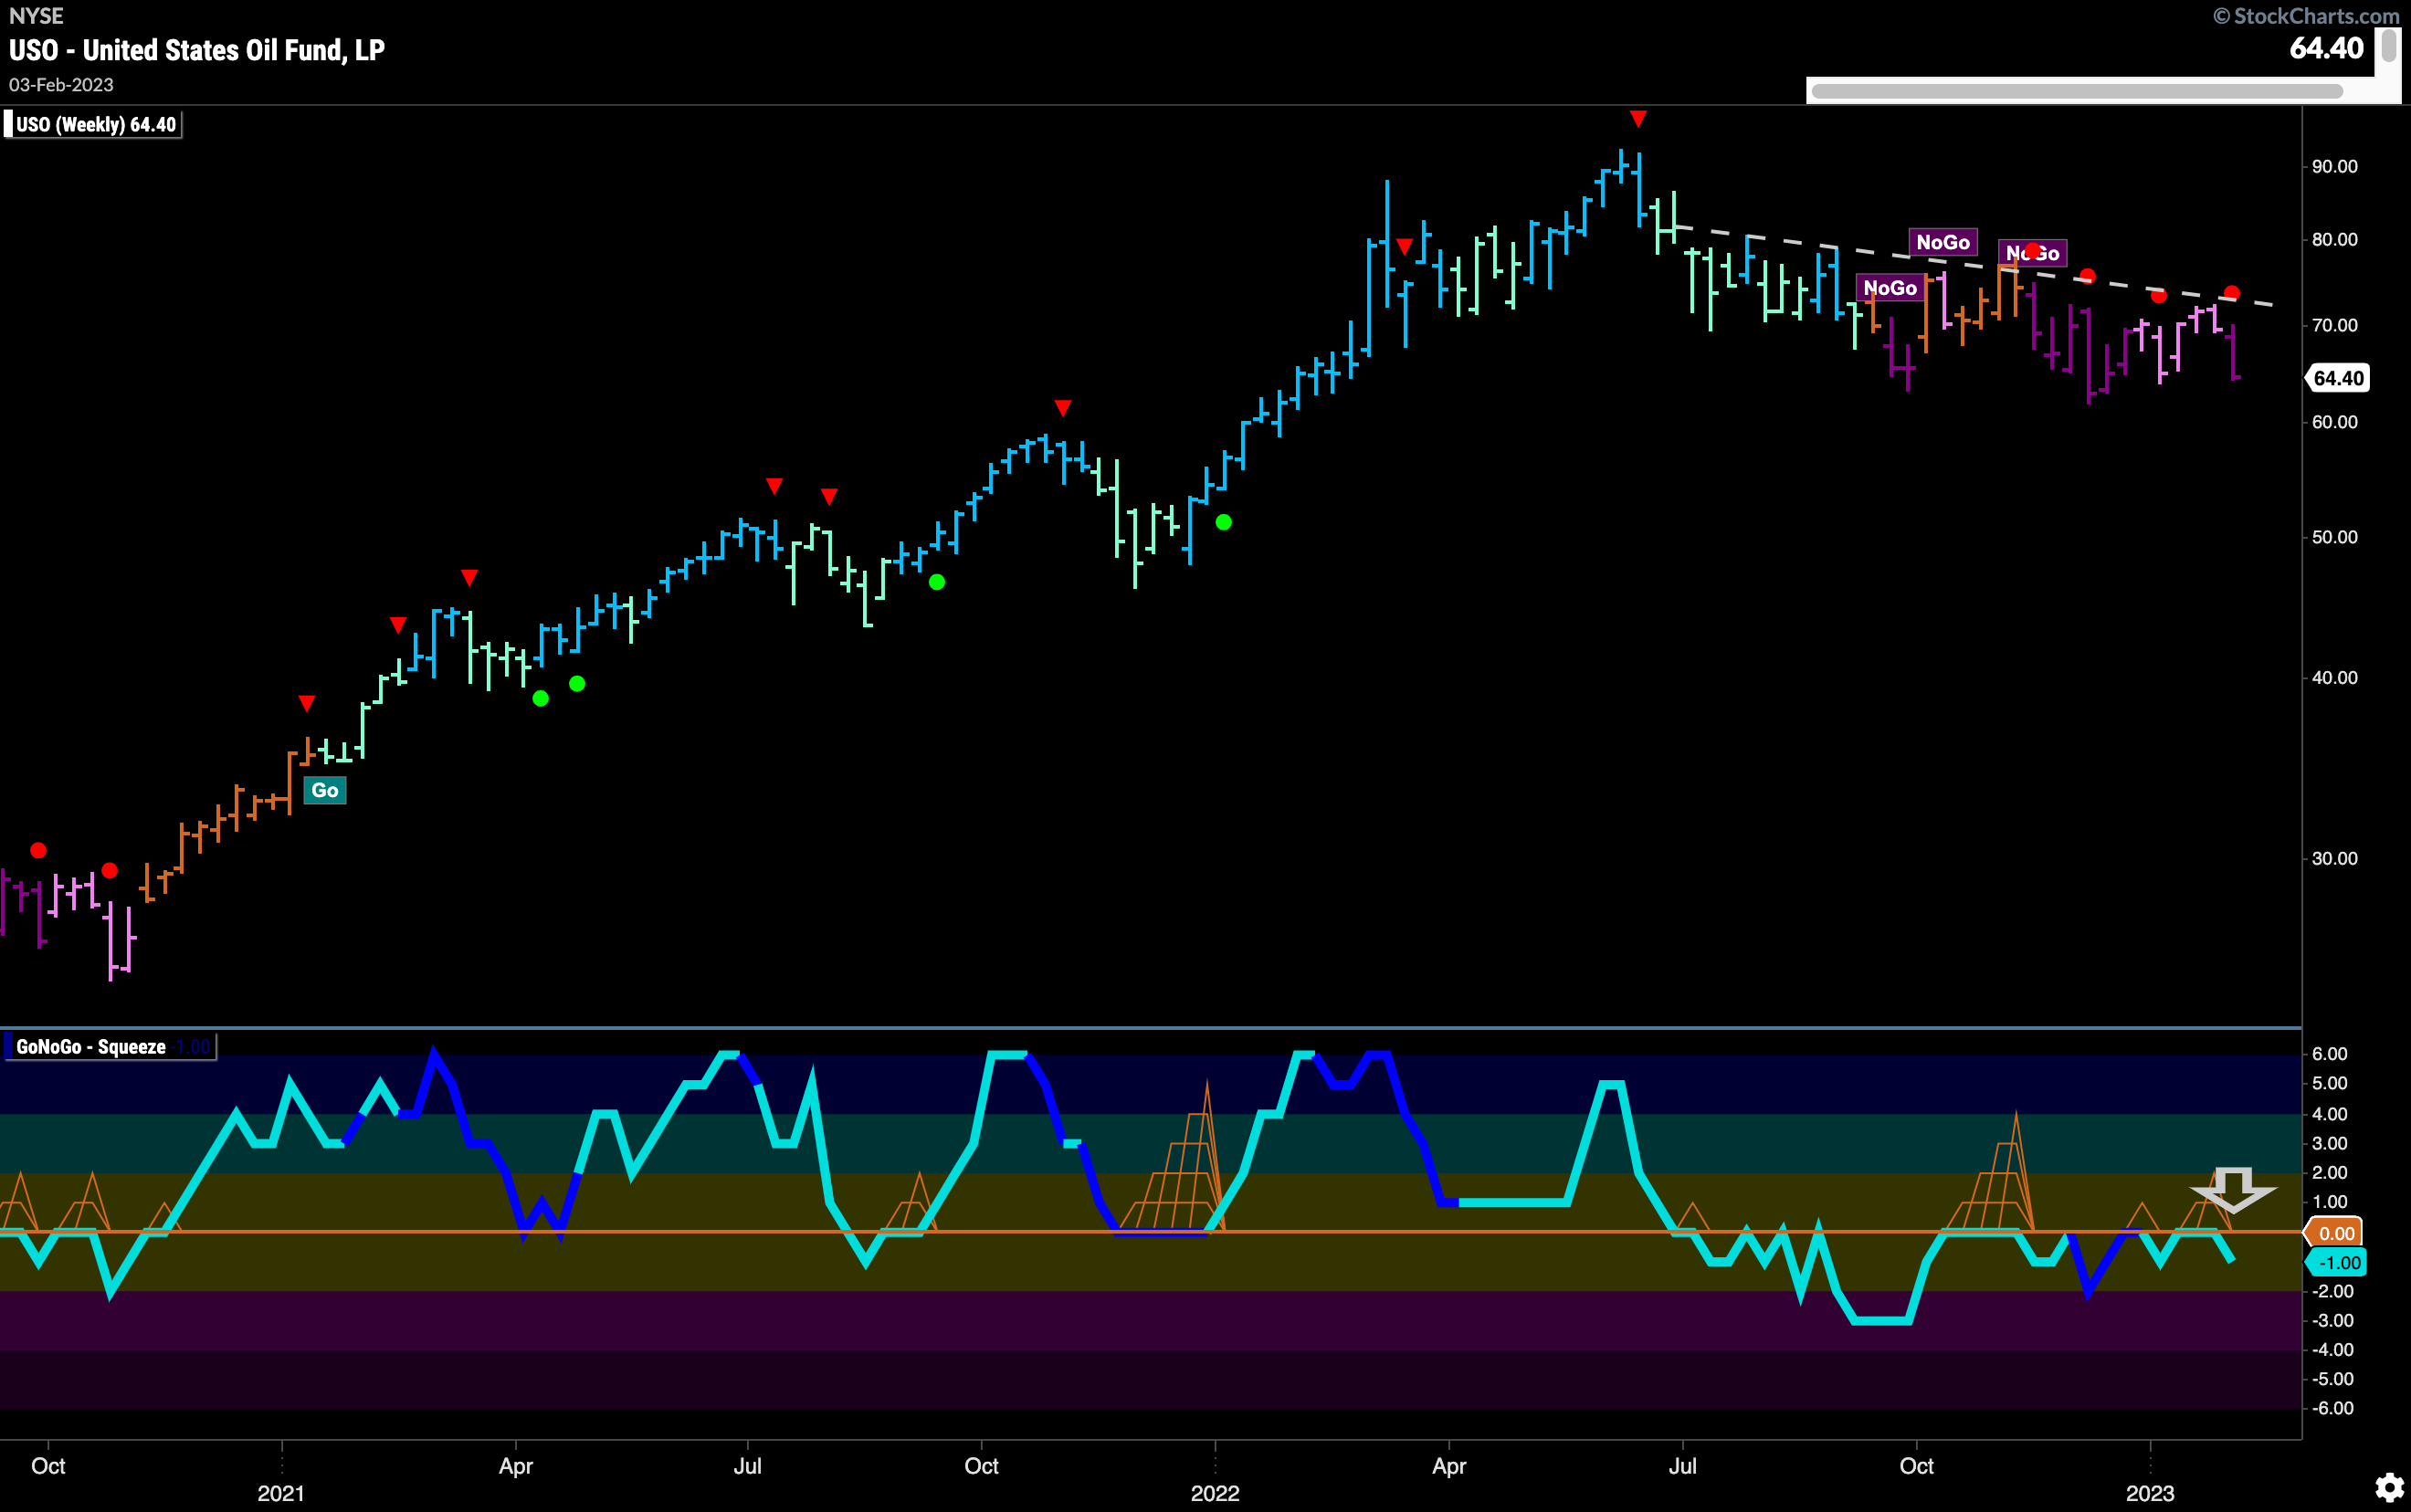
Oil Sees Long Term “NoGo” Strengthen
$USO on a weekly chart shows that downward sloping resistance held this week as price moved lower on a strong purple “NoGo” bar. GoNoGo Oscillator was turned away from the zero line again. Although still unable to make a significant break into negative territory, this continued rejection at that level shows that momentum continues to side with the “NoGo” trend.
 Sector RelMap
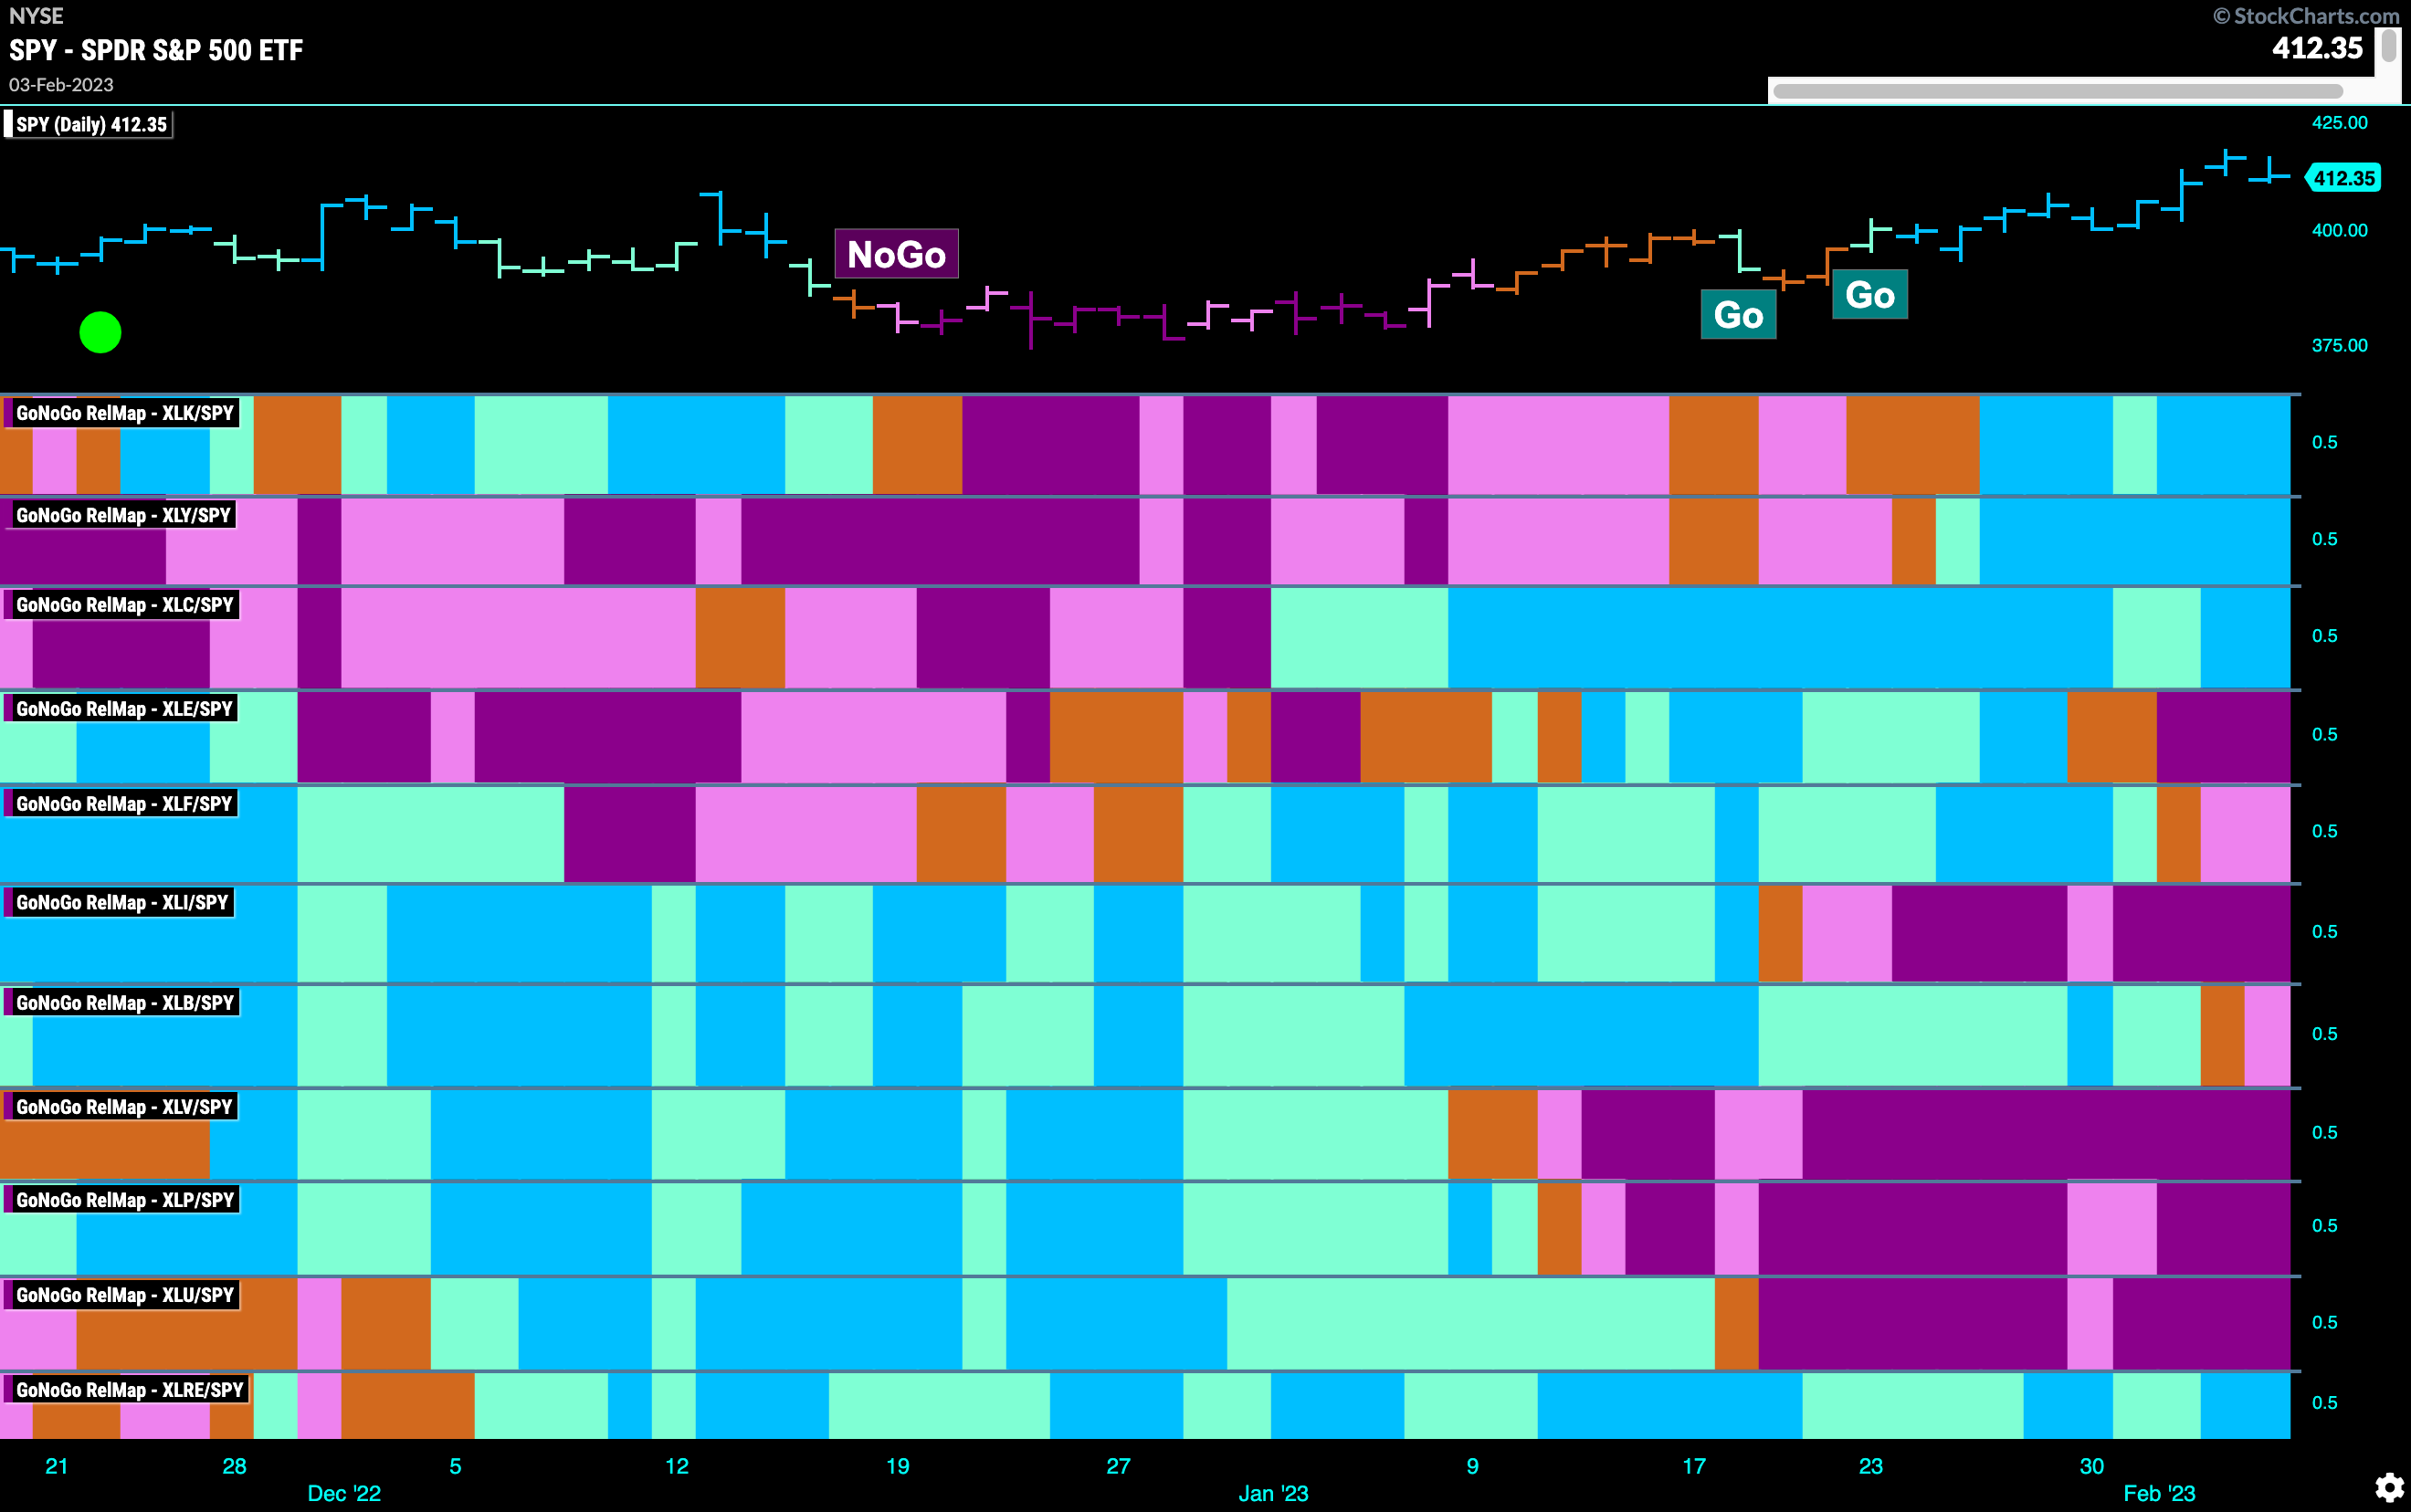
Below is the GoNoGo Sector RelMap. This GoNoGo RelMap applies the GoNoGo Trend to the relative strength ratios of the sectors to the base index. Looking at this map, we can quickly see where the relative outperformance is coming from as well as which sectors are lagging on a relative basis. 4 sectors are outperforming the base this week. $XLK, $XLY, $XLC, and $XLRE, are painting “Go” bars. This RelMap shows a significant shift as rotation into growth sectors is clear. After relatively underperforming for sometime we now see the top three panels ($XLK, $XLY, and $XLC) are now in relative “Go” trends to the base index driving it higher. The panels below show that it is the more defensive sectors that are struggling. $XLV, $XLP, and $XLU continue to paint strong purple “NoGo” bars.
Discretionary Sector Breaks Higher
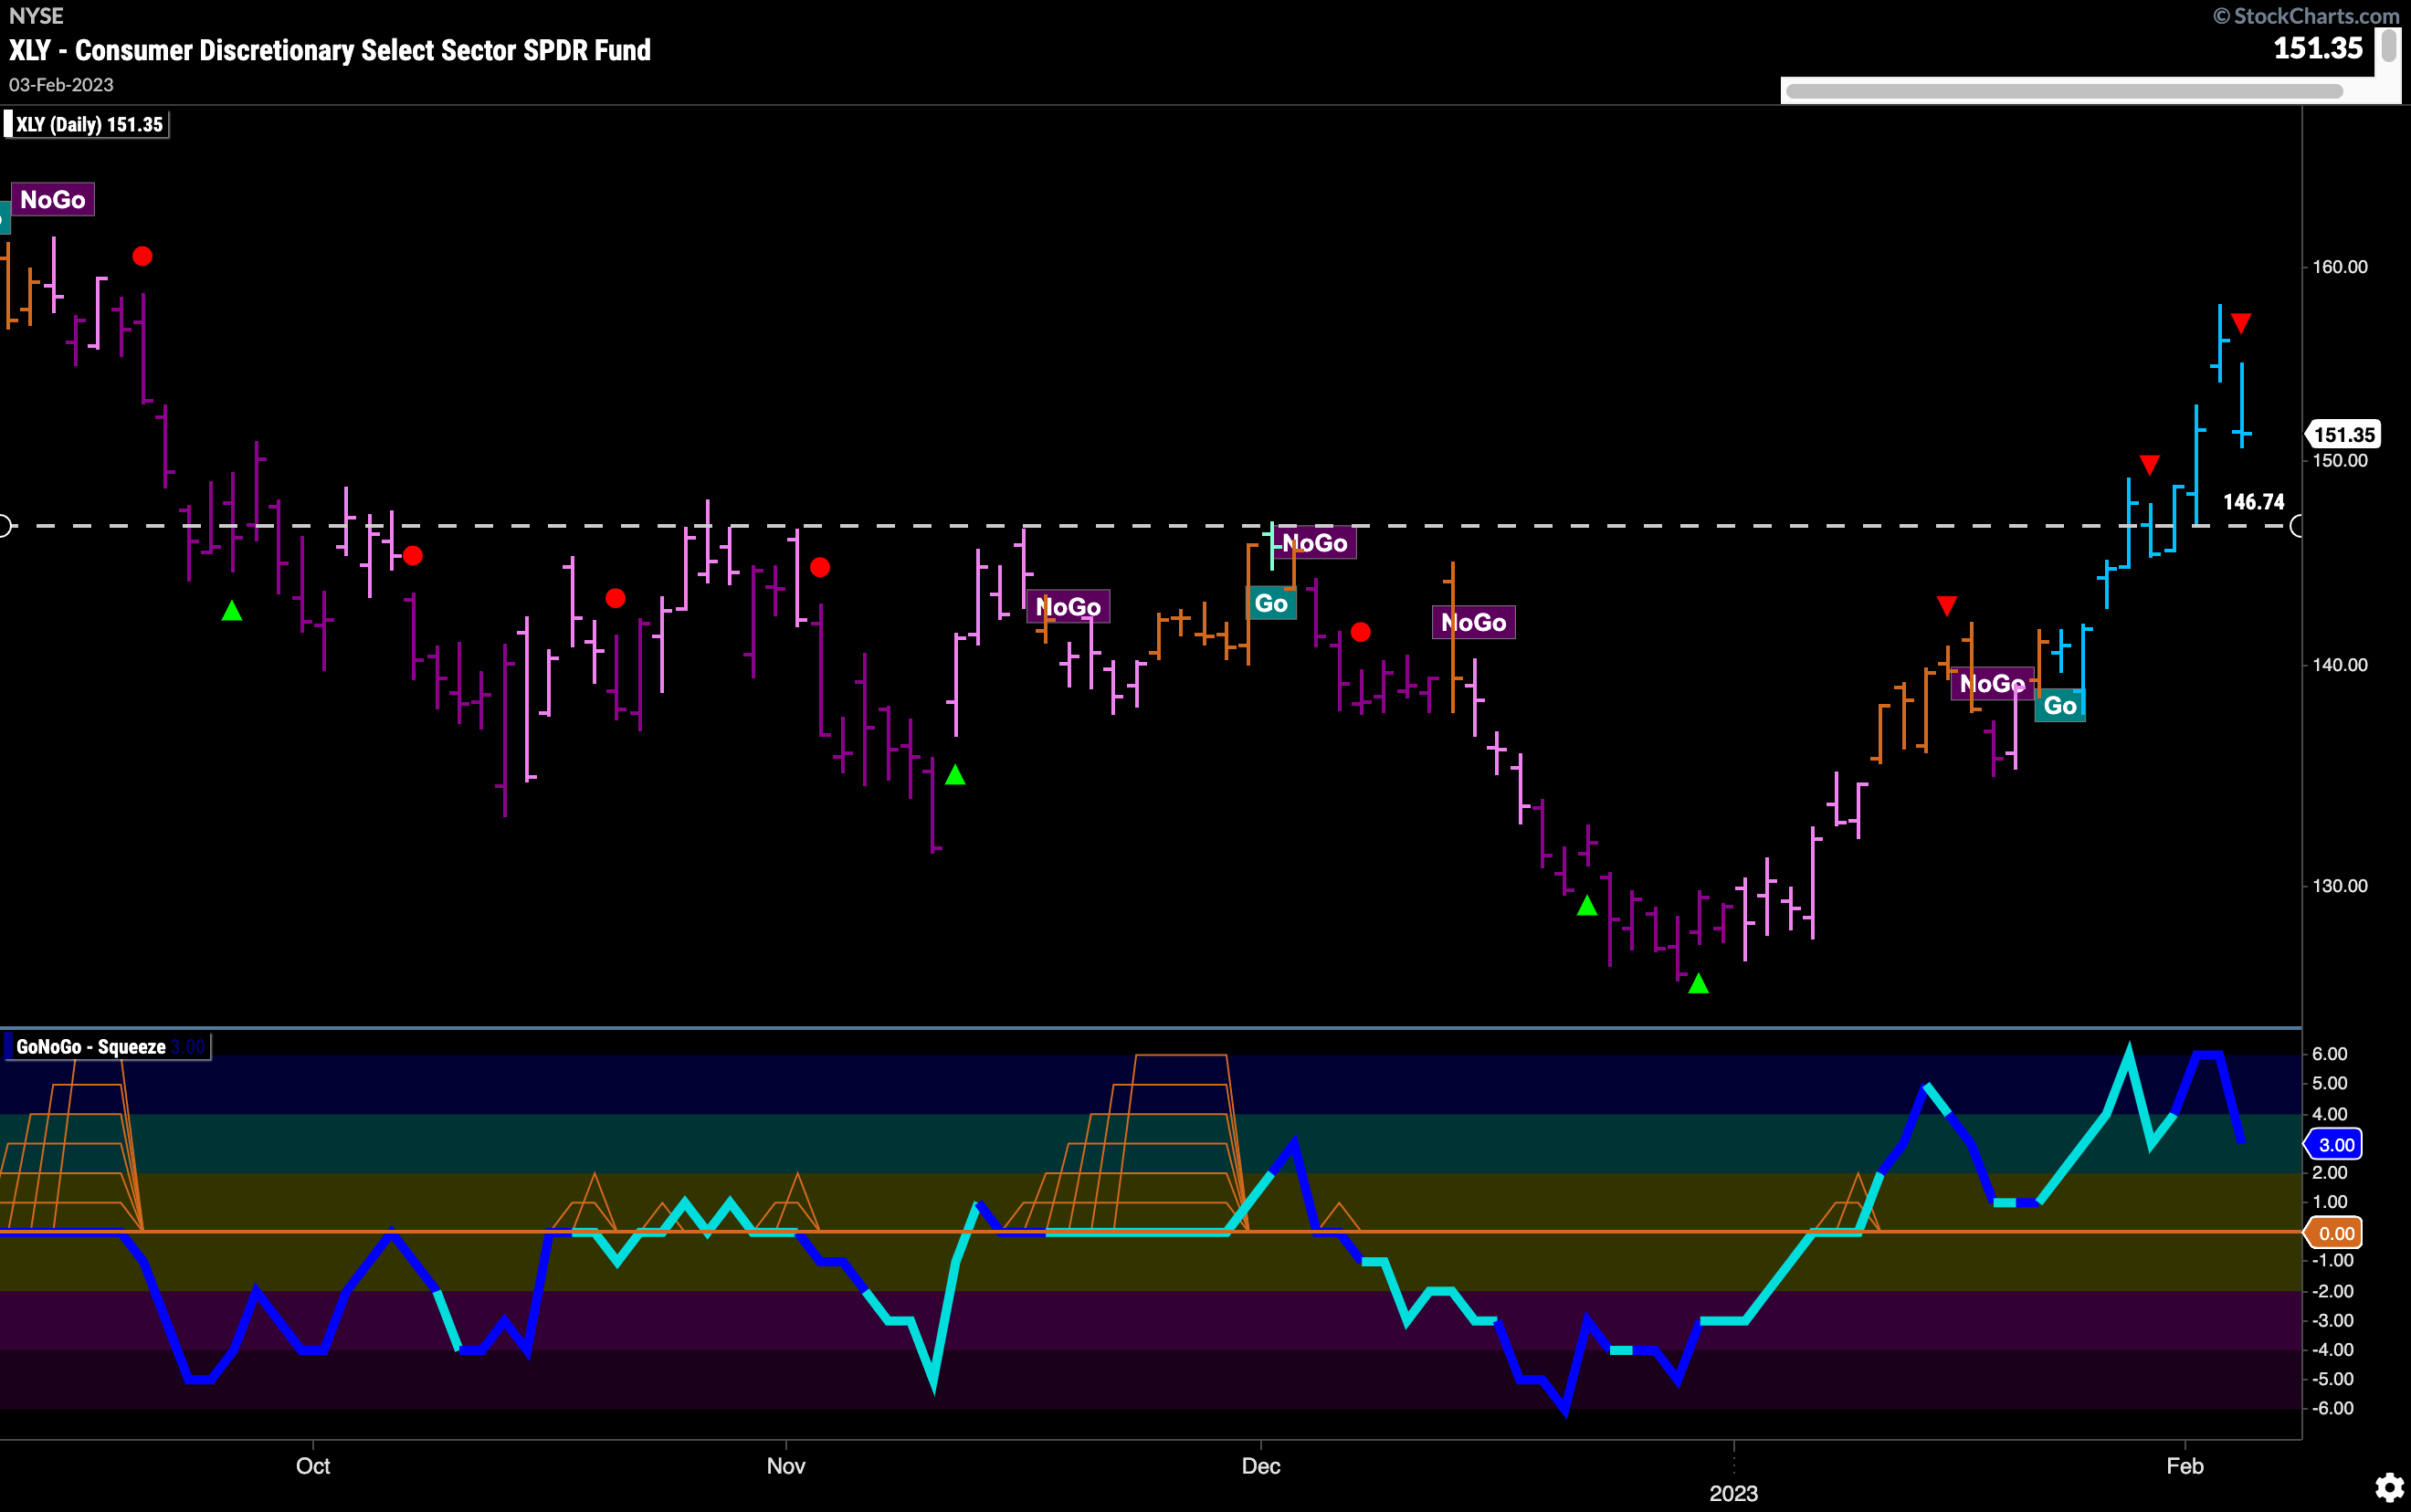
Resistance that we noted a week ago was broken this week as Wednesday’s strong bar took prices higher. Strong blue “Go” bars dominate and Friday’s correction (identified by the Go Countertrend Correction Icon) leaves price still significantly higher than the level that should now offer support. GoNoGo Oscillator has been in positive territory since breaking above zero in advance of the trend change. Now the oscillator is in positive territory but no longer overbought.
Discretionary Sub-Groups RelMap
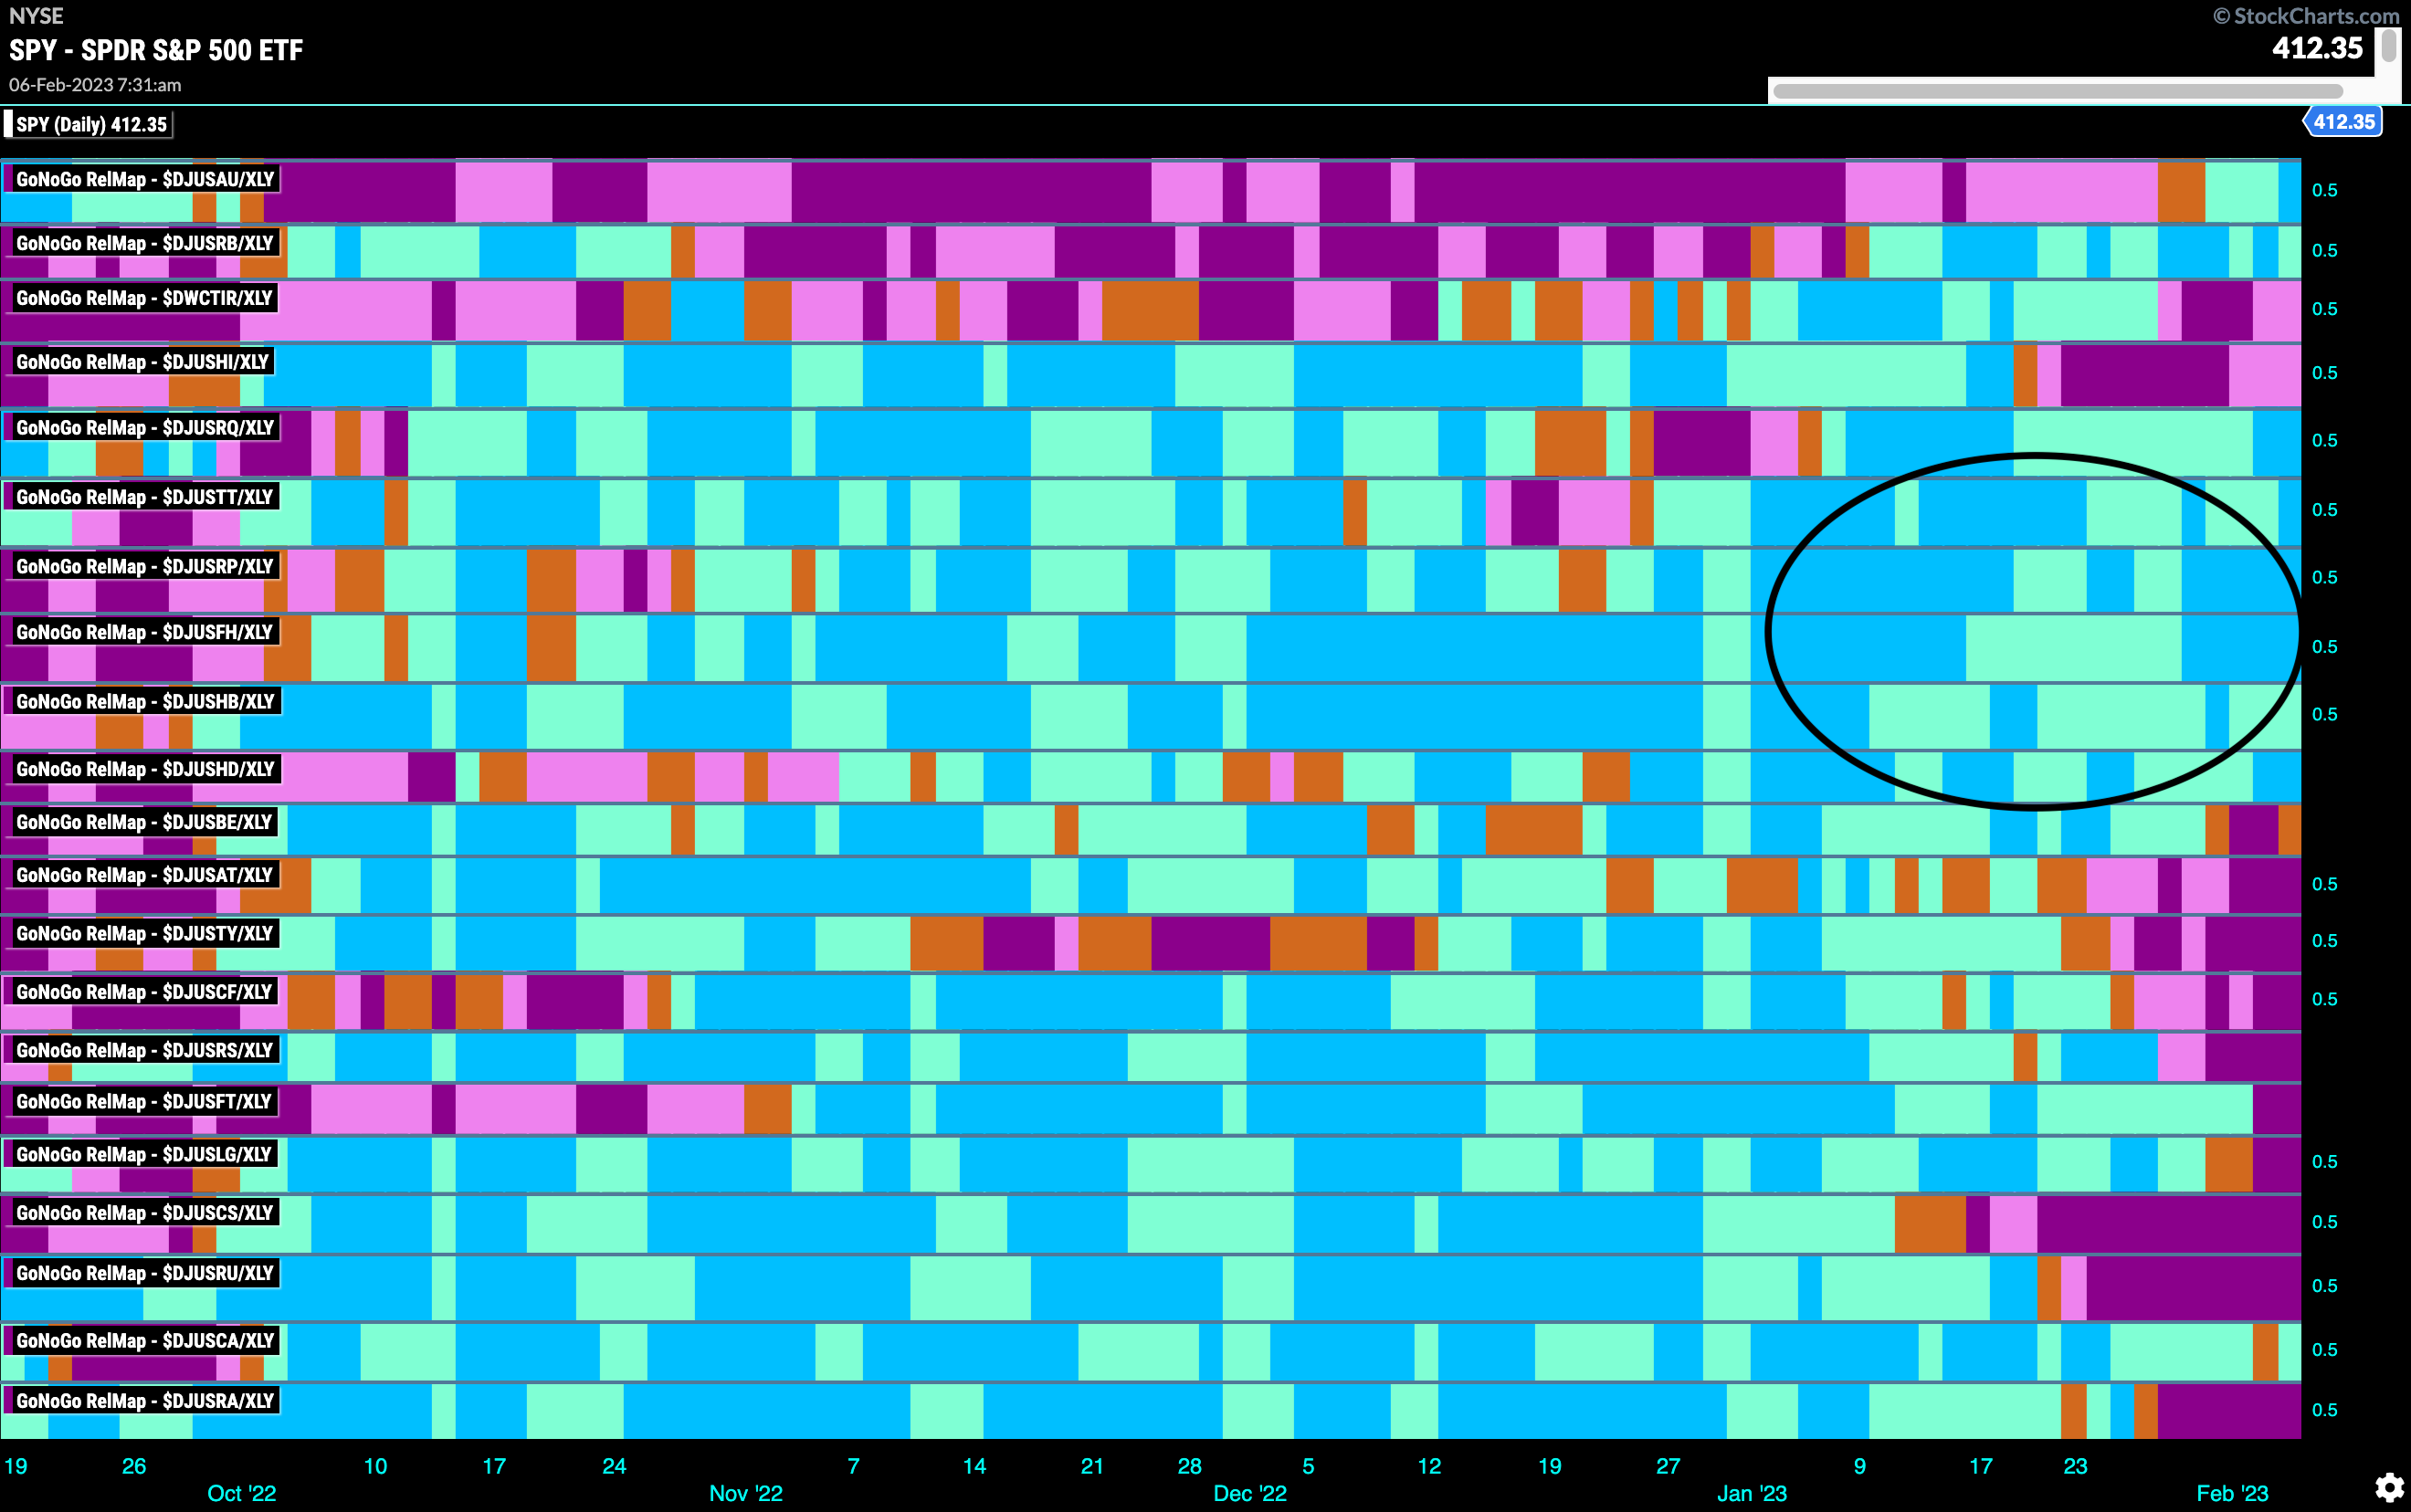
Below is the GoNoGo RelMap of all the industry groups within the discretionary sector. The GoNoGo Trend concept is applied to the ratio of each sub group to the discretionary sector. This allows us to really fish where the fish are. We know that the discretionary sector is outperforming the S&P 500. We can look under the hood of the sector to find which industries are driving that sector outperformance. Looking at the map, we can see a clear area of outperformance as several groups are in relative “Go” trends. $DJUSFH is the ticker for the Dow Jones Furnishings Index, and we can see that it has been in a persistent “Go” trend for several weeks.
Dow Jones Furnishings Index
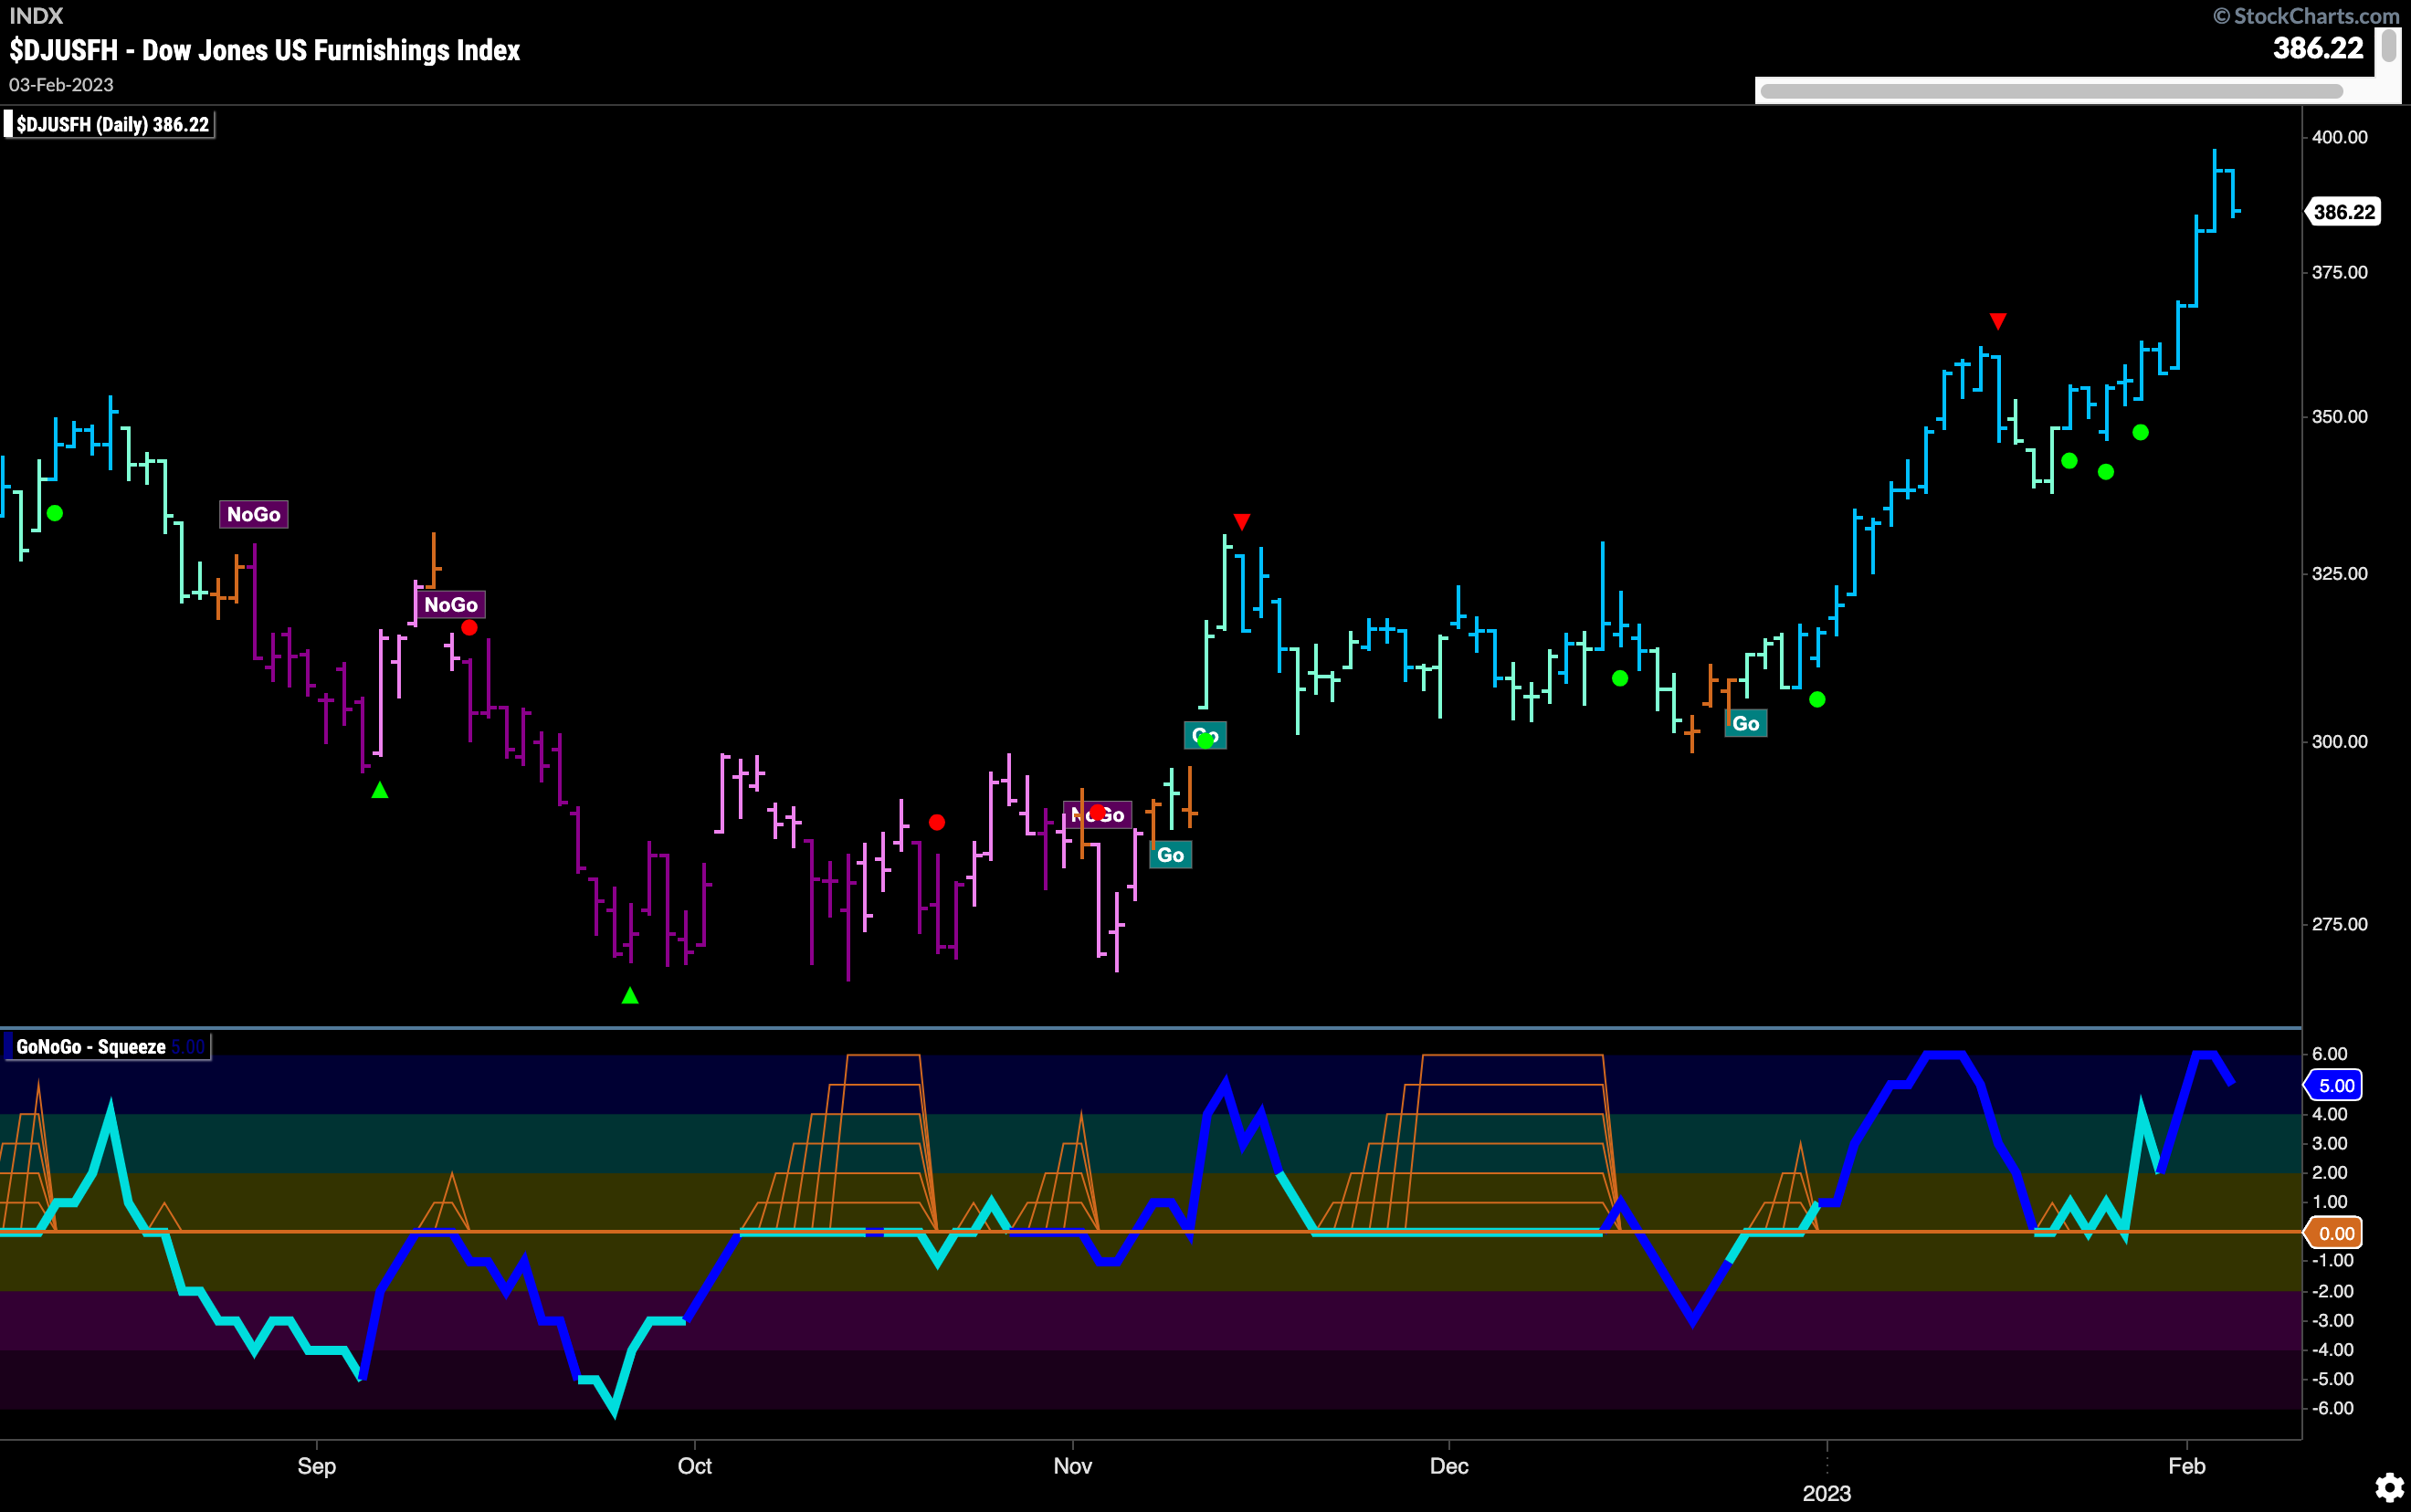
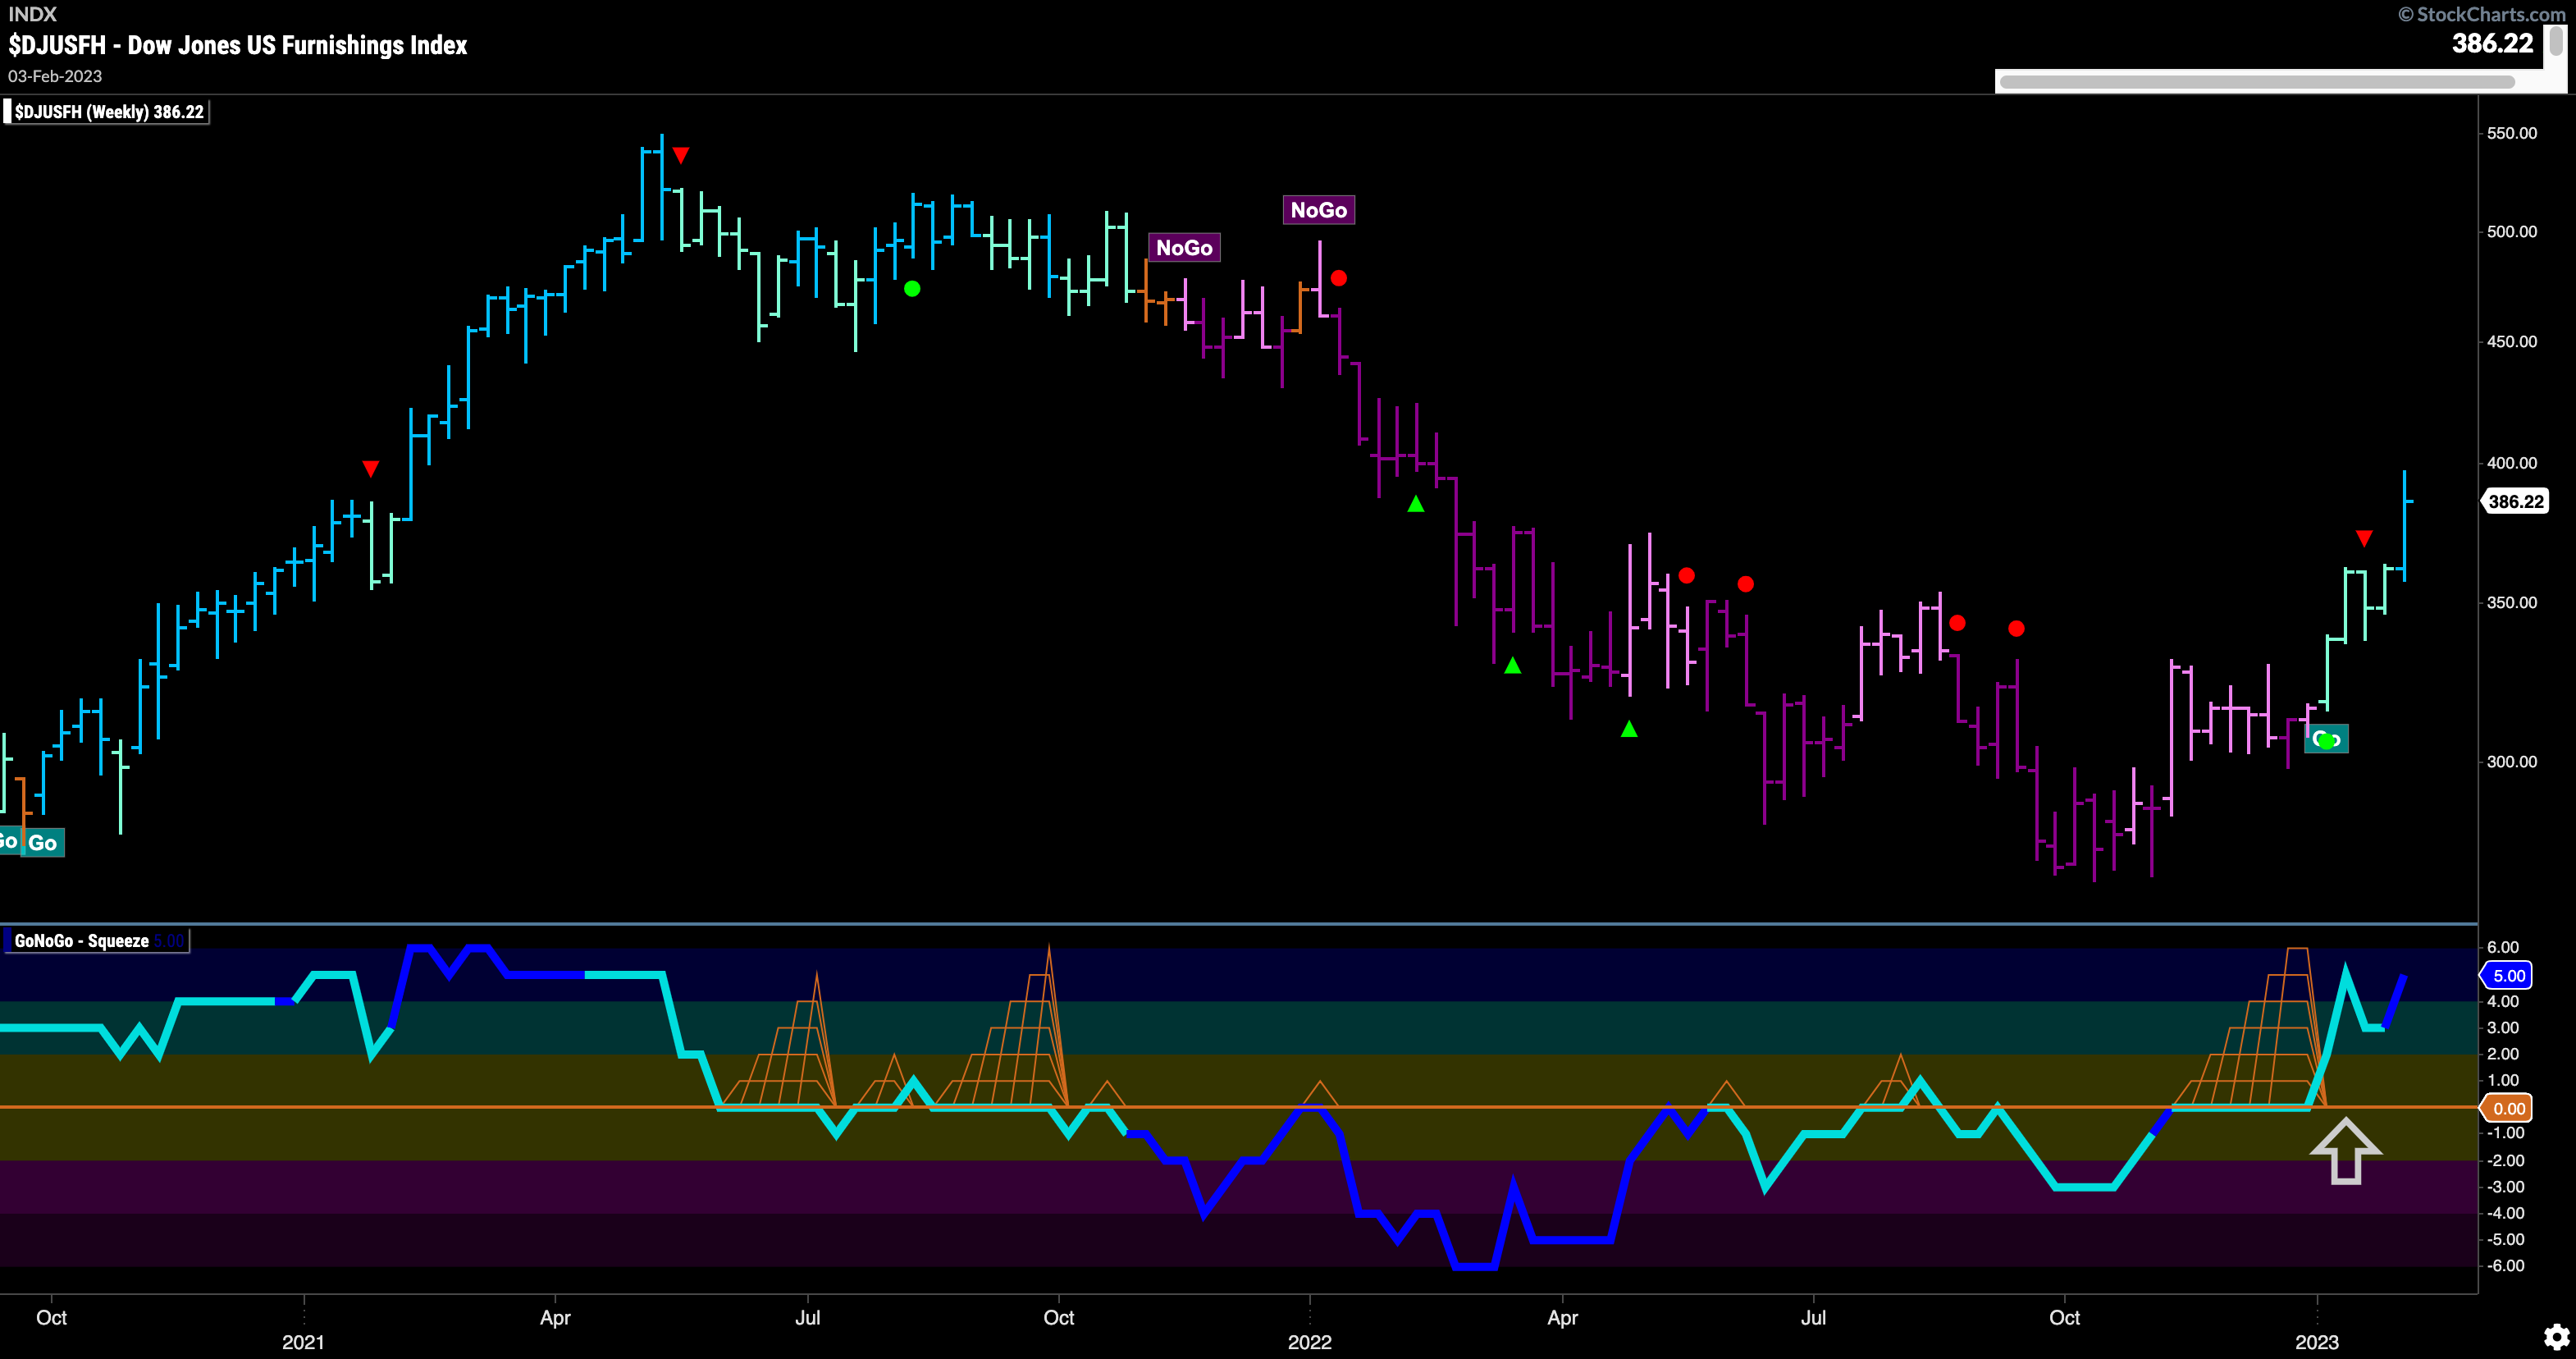
The chart below $DJUSFH with daily data. We can see how strong price action has been. After entering a “Go” trend late last year we saw a period of consolidation highlighted by the GoNoGo Squeeze climbing to its max. After breaking to new highs, we saw GoNoGo Oscillator regain positive territory and consecutive higher highs have followed. Last week saw a string of strong blue “Go” bars and GoNoGo Oscillator is now in overbought territory on heavy volume.
The weekly chart below shows that this is early days for this “Go” trend. After a few weak aqua “Go” bars, price painted a strong blue bar last week. This comes as price breaks to new highs and GoNoGo Oscillator burst out of a Max GoNoGo Squeeze into positive territory.
Tempur-pedic Looking Comfortable in “Go” trend
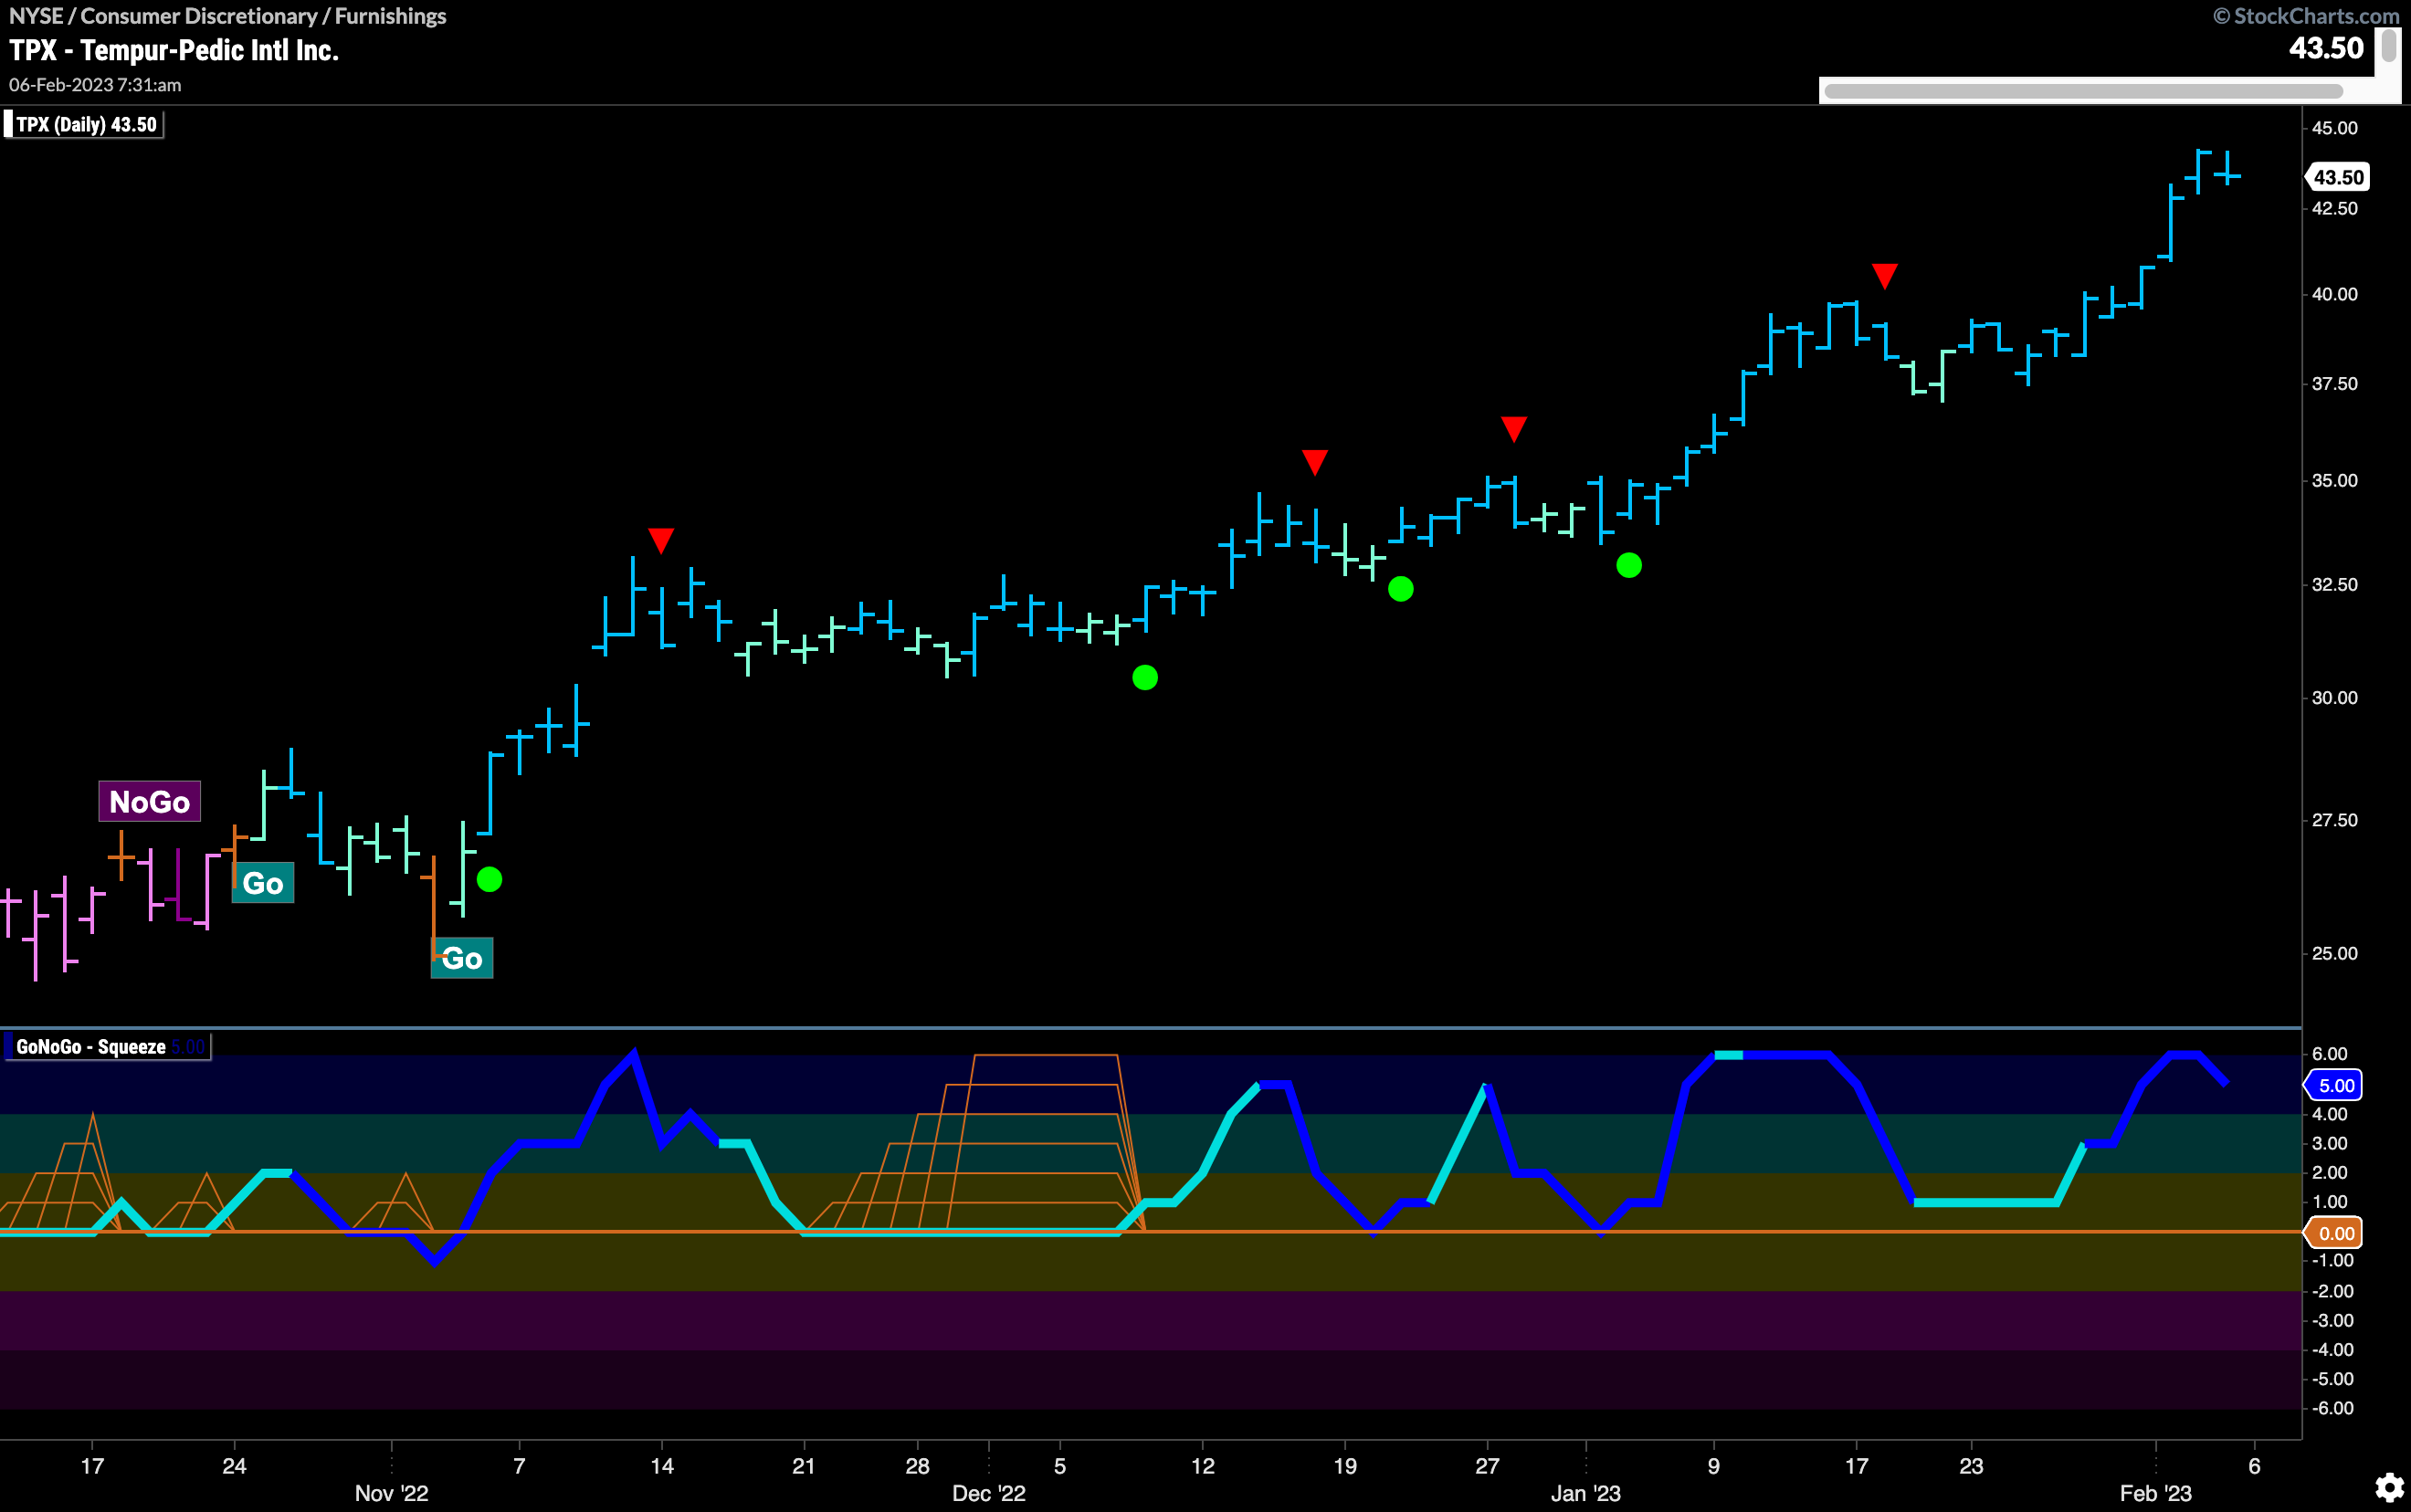
$TPX shows the trend of a company that is fully taking advantage of sector and industry group strength. Having entered a “Go” trend in November of last year it has seen a series of higher highs and higher lows. GoNoGo Oscillator for the entire time has stayed above zero finding support at that level. Investors have been able to buy any pullback each time the oscillator found support at zero. Green circles on the price chart indicated trend continuation. Now, at a new high, we will watch to see if the oscillator falls back toward the zero line potentially providing an opportunity to enter the trend again if it finds support.
About to Enter a Purple Patch?
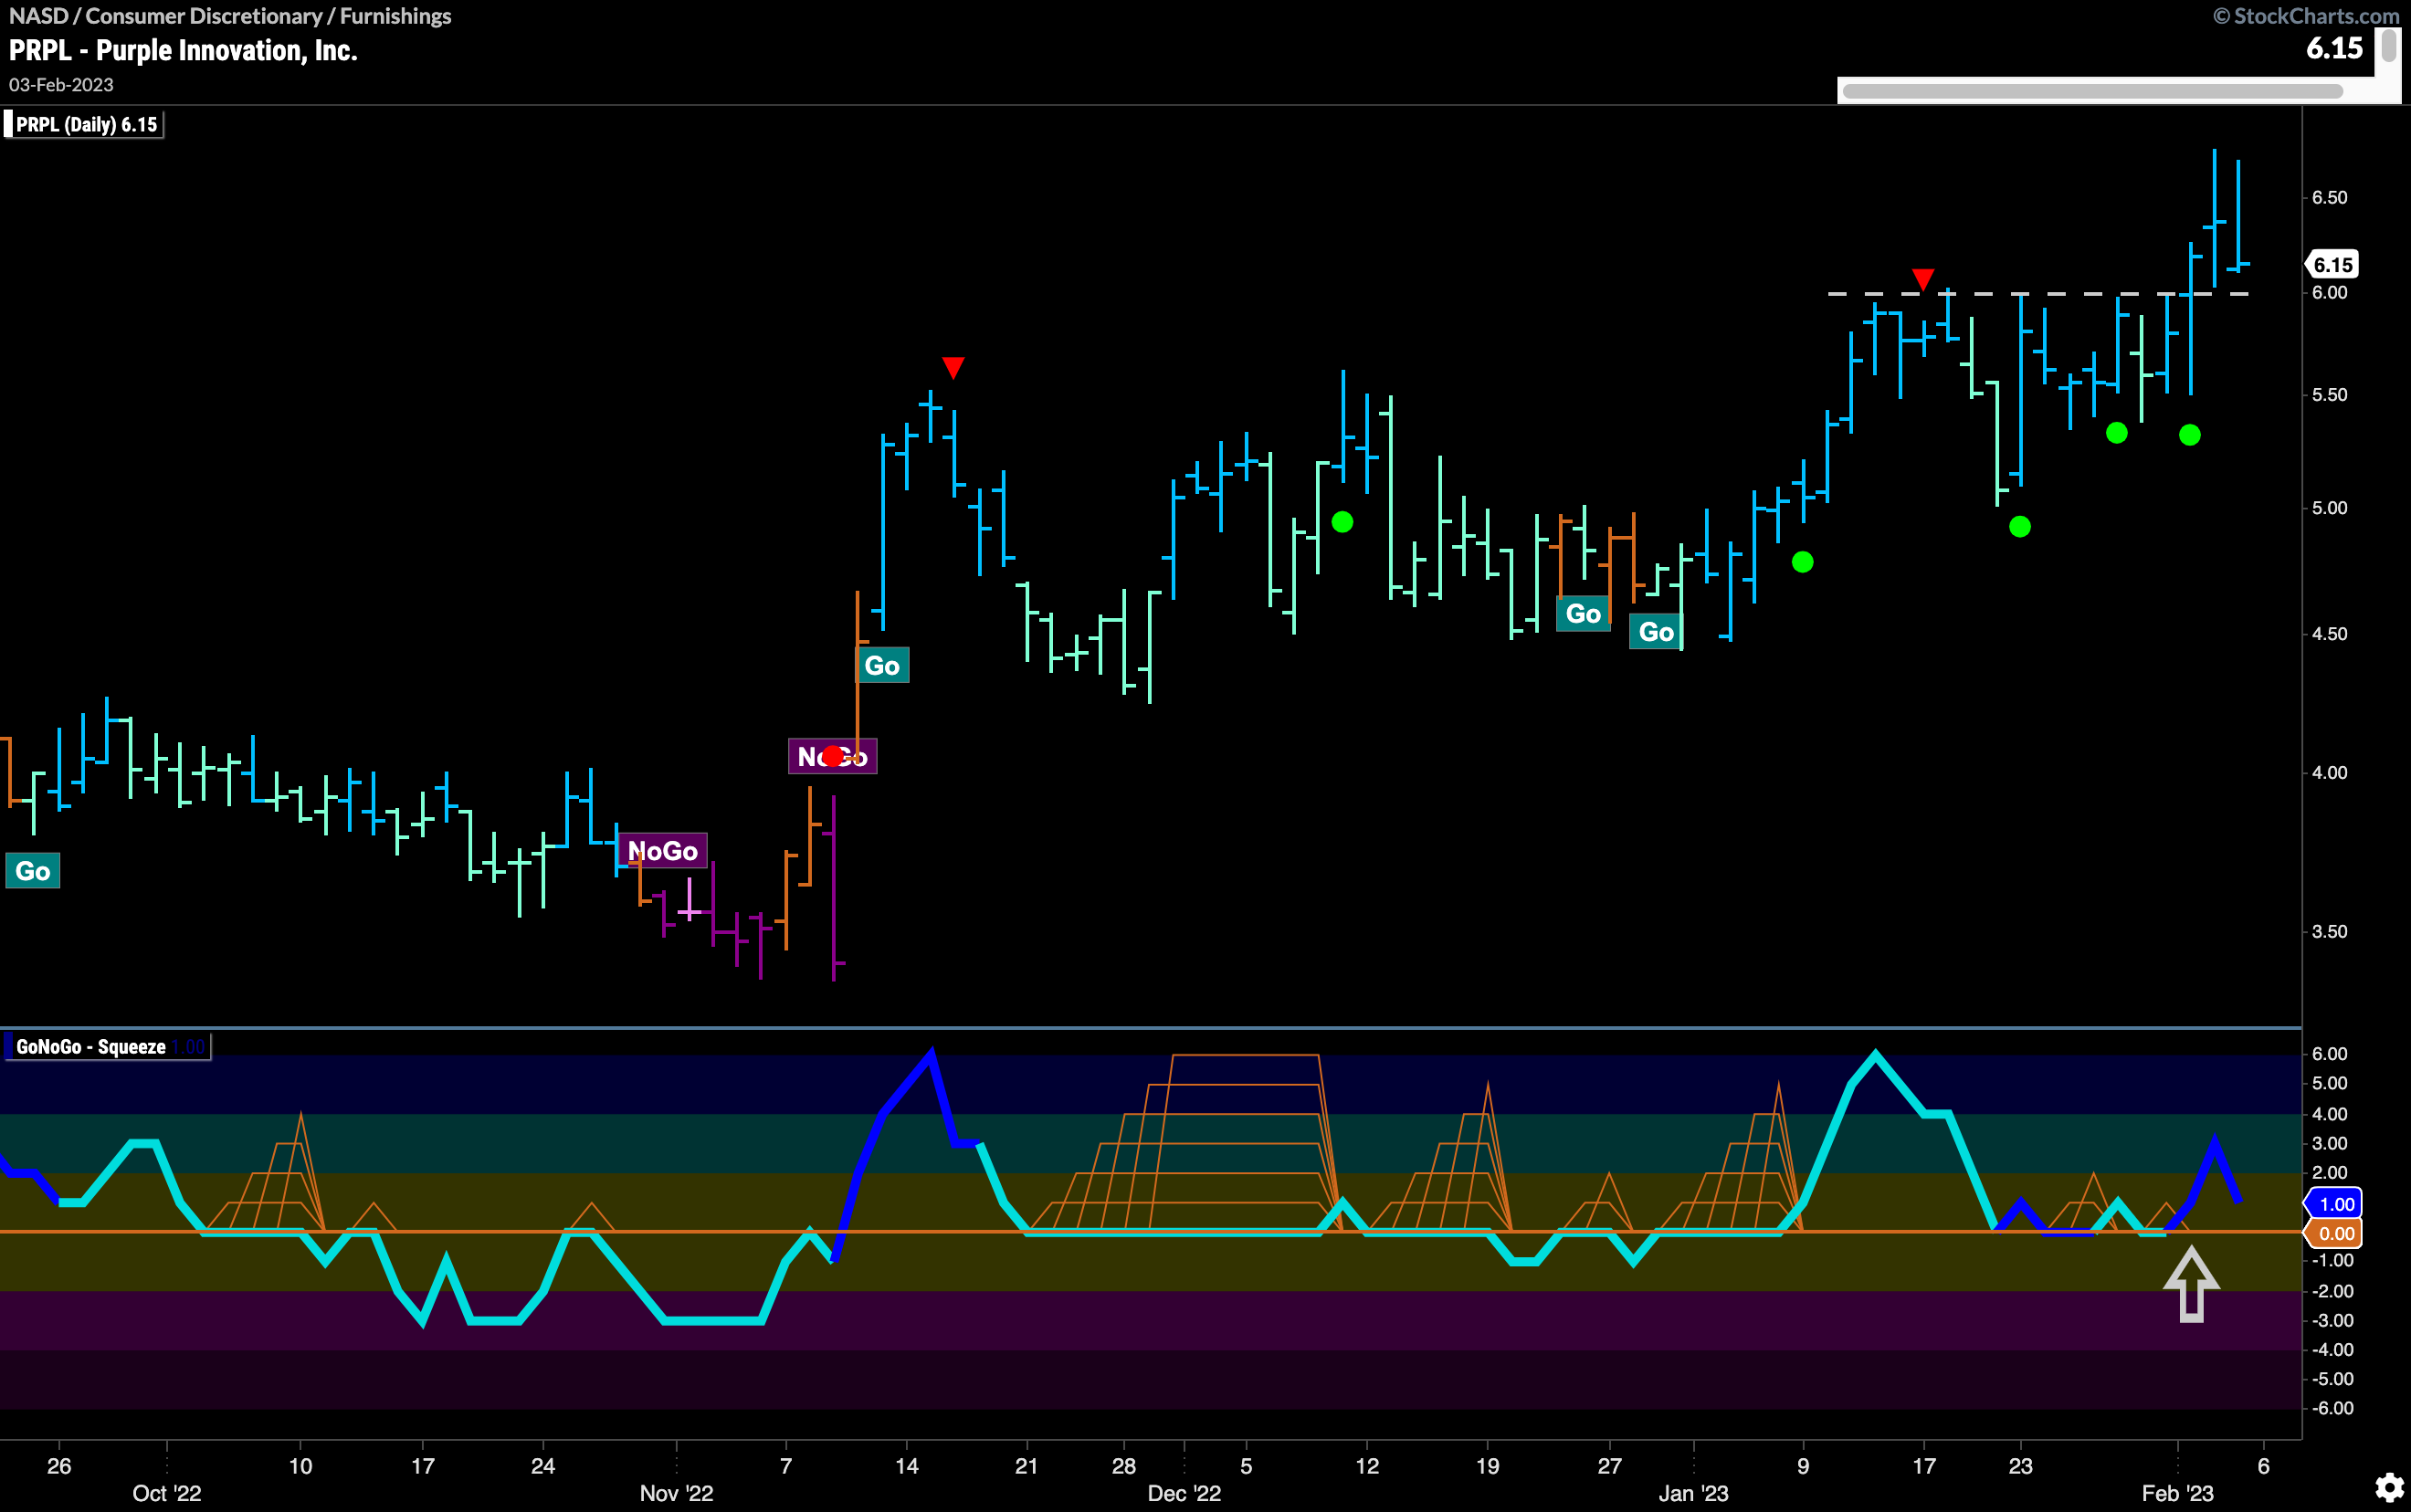
$PRPL is another mattress manufacturer in the furnishings industry group that seems poised to move higher. After surviving a messy spell that saw GoNoGo Trend paint some amber “Go Fish” bars as GoNoGo Oscillator flirted with breaking below zero, price has consolidated higher. GoNoGo Trend is painting strong blue “Go” bars and GoNoGo Oscillator has been able to consistently stay above the zero line. As price pulls back to test a level of support, we will watch to see if GoNoGo Oscillator can stay above zero and provide a relatively low risk opportunity to participate in the trend.
