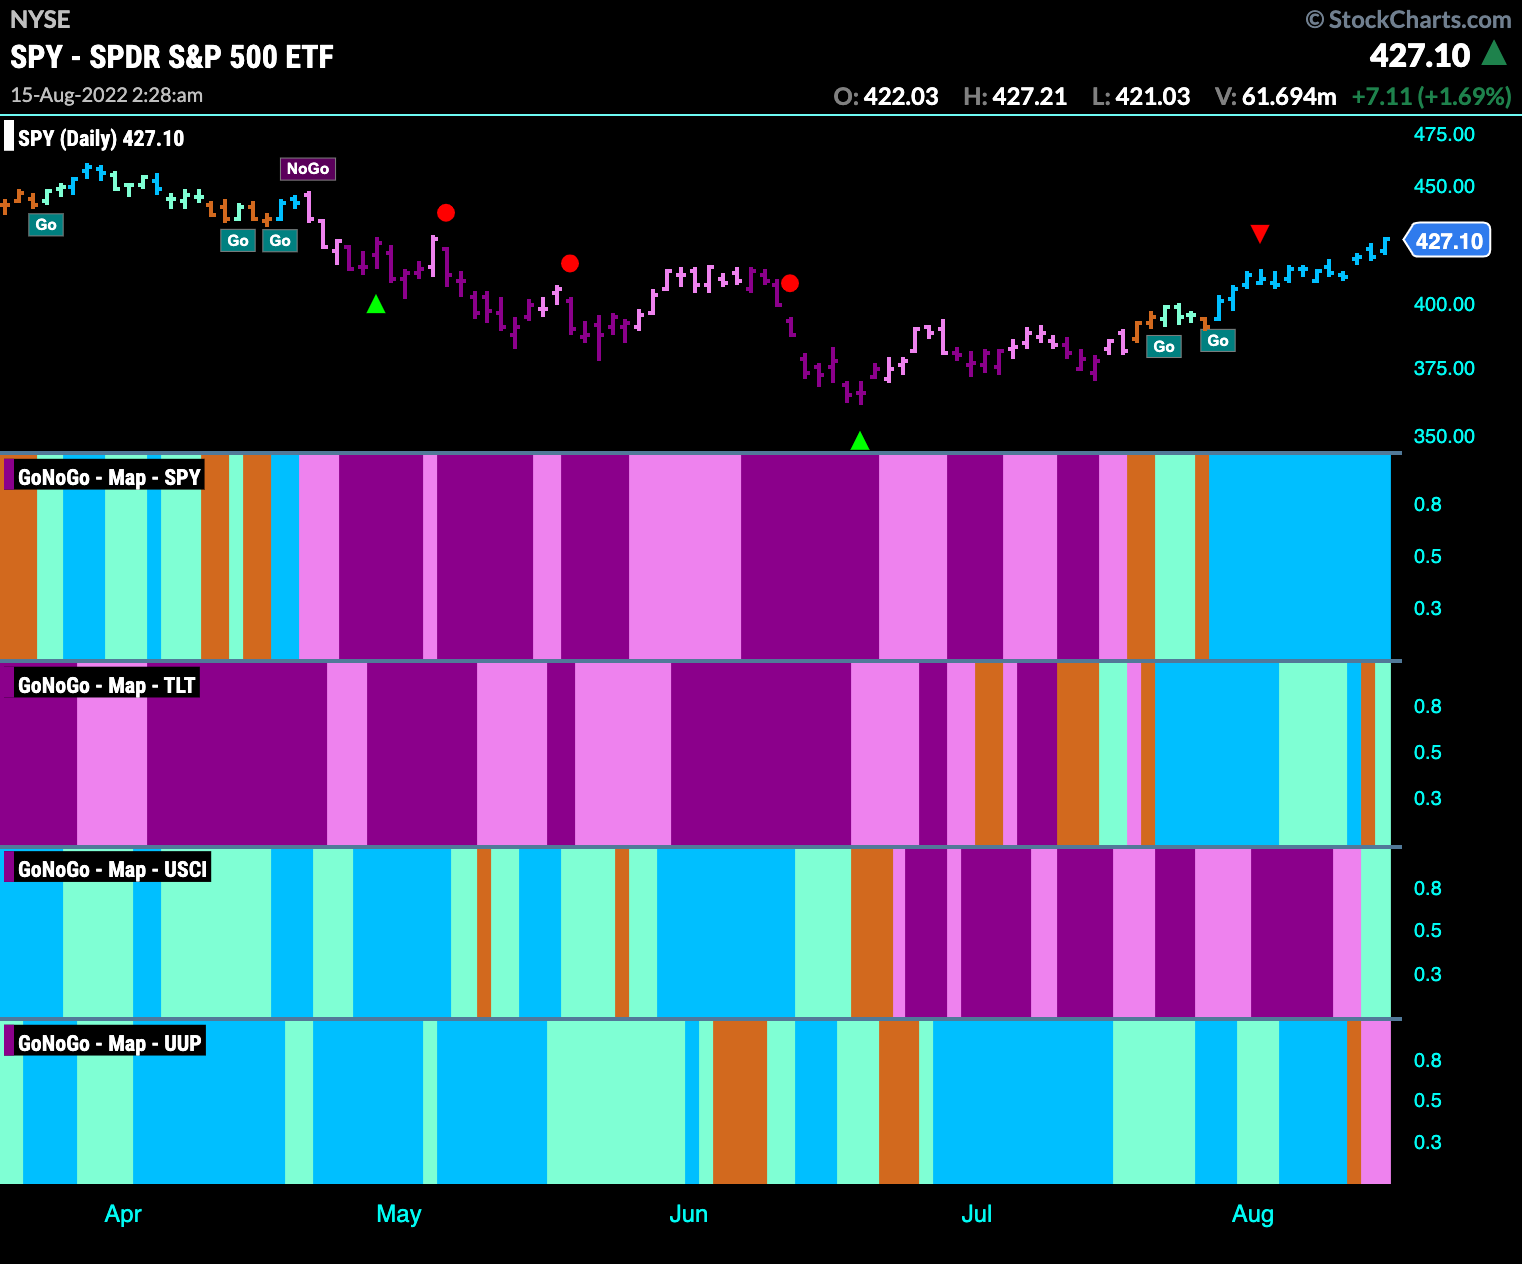
Good morning and welcome to this week’s Flight Path. Let’s take a look at the GoNoGo Asset map below. Equities continue to paint strong blue “Go” bars this week as the trend continues. Treasury bond prices struggled mid week and painted and amber “Go Fish” bar before returning to an aqua “Go” bar on Friday. Commodities have rallied, and end the week in a “Go” trend. The dollar, finally, has succumbed to a “NoGo” trend.
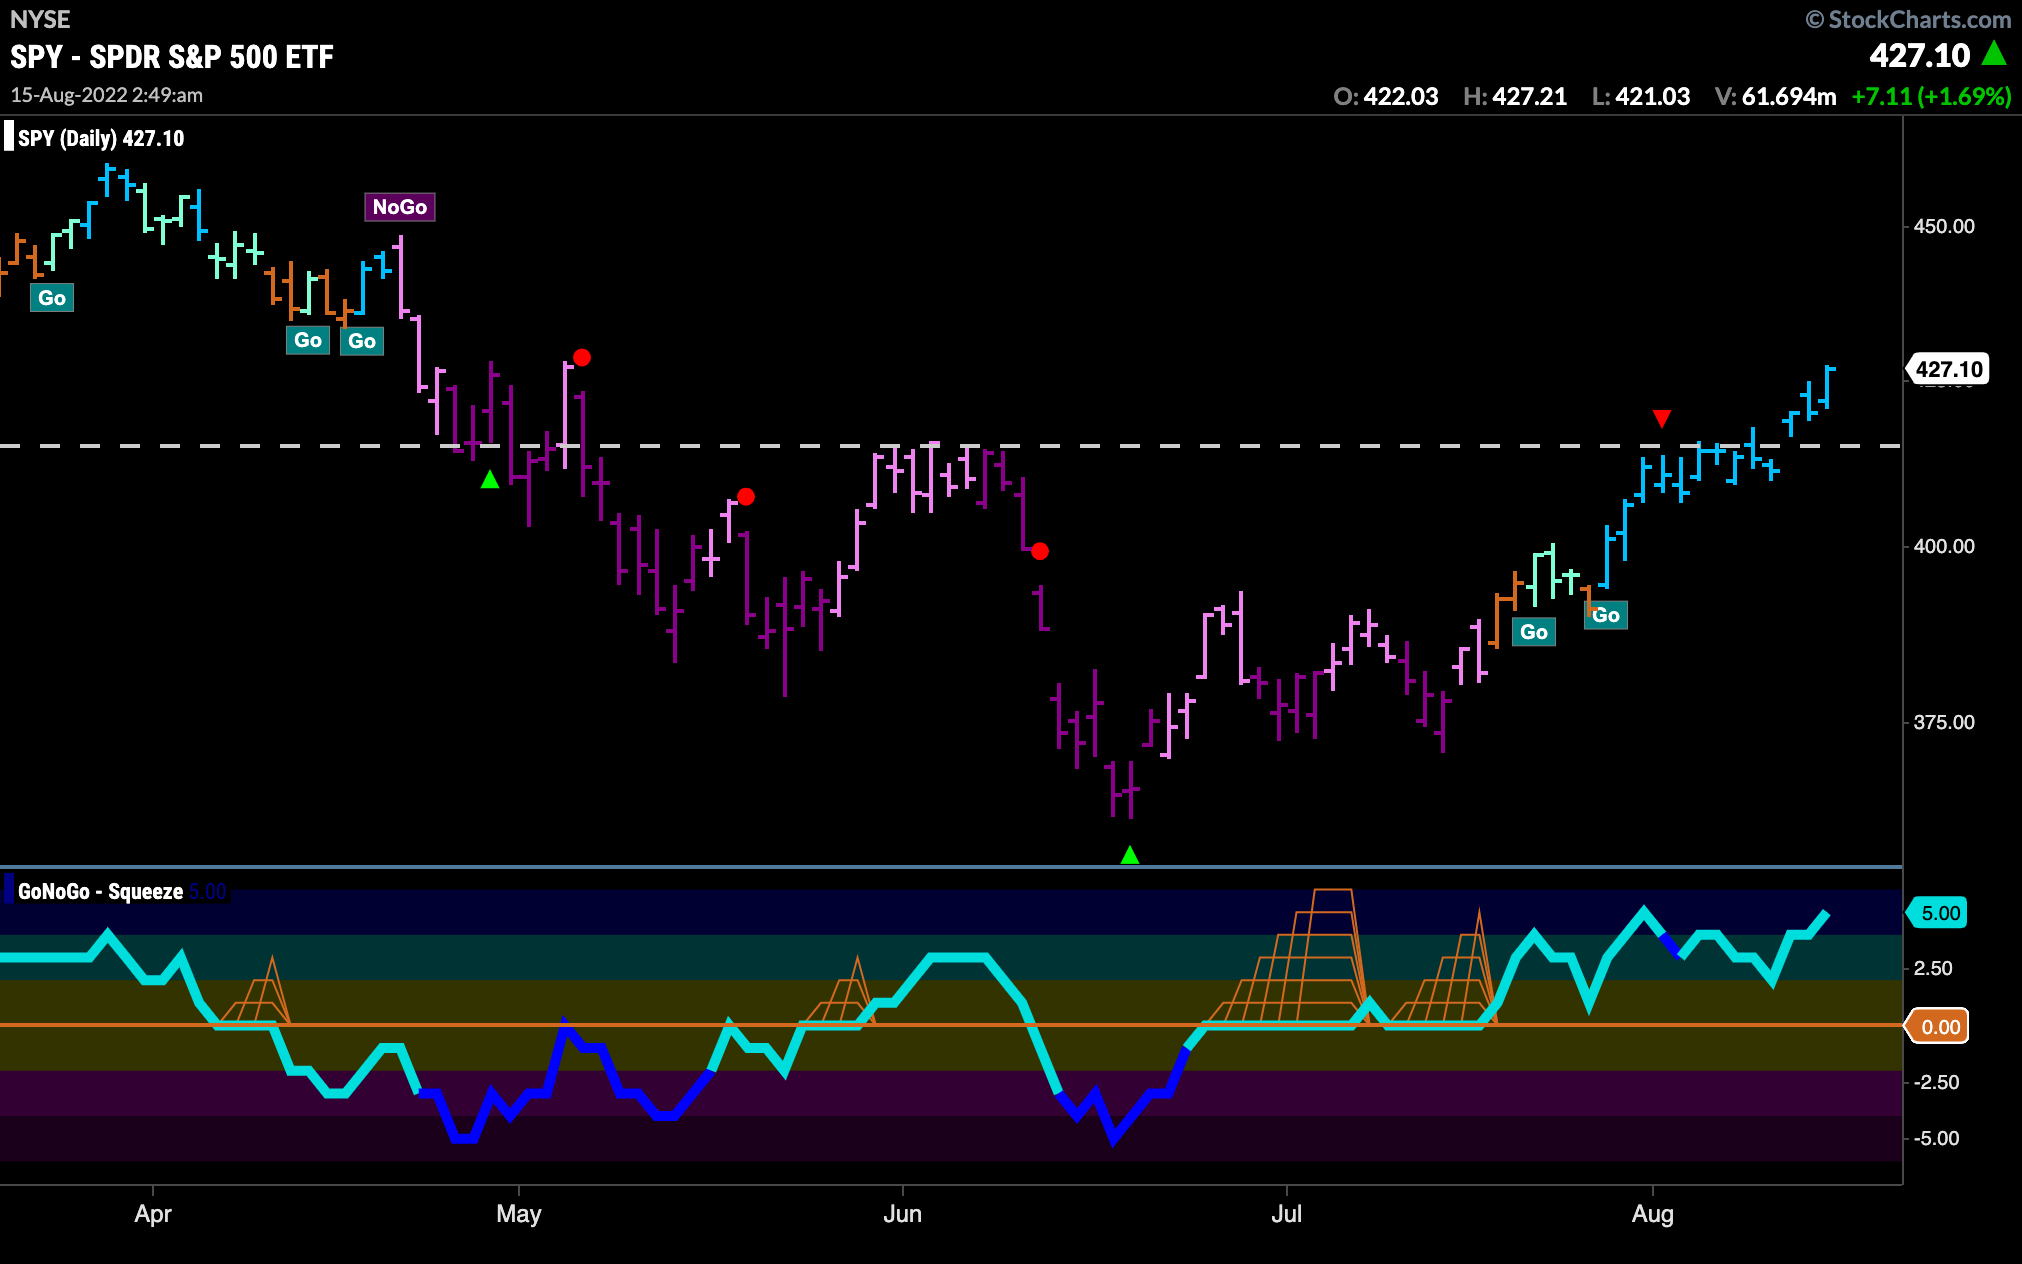
S&P 500 Bursts Through Resistance in “Go” Trend
We talked about it last week, it happened this week. Price continued to rally and as momentum stayed positive we saw a break above resistance from the June relief rally as GoNoGo Trend continued to paint strong blue “Go” bars
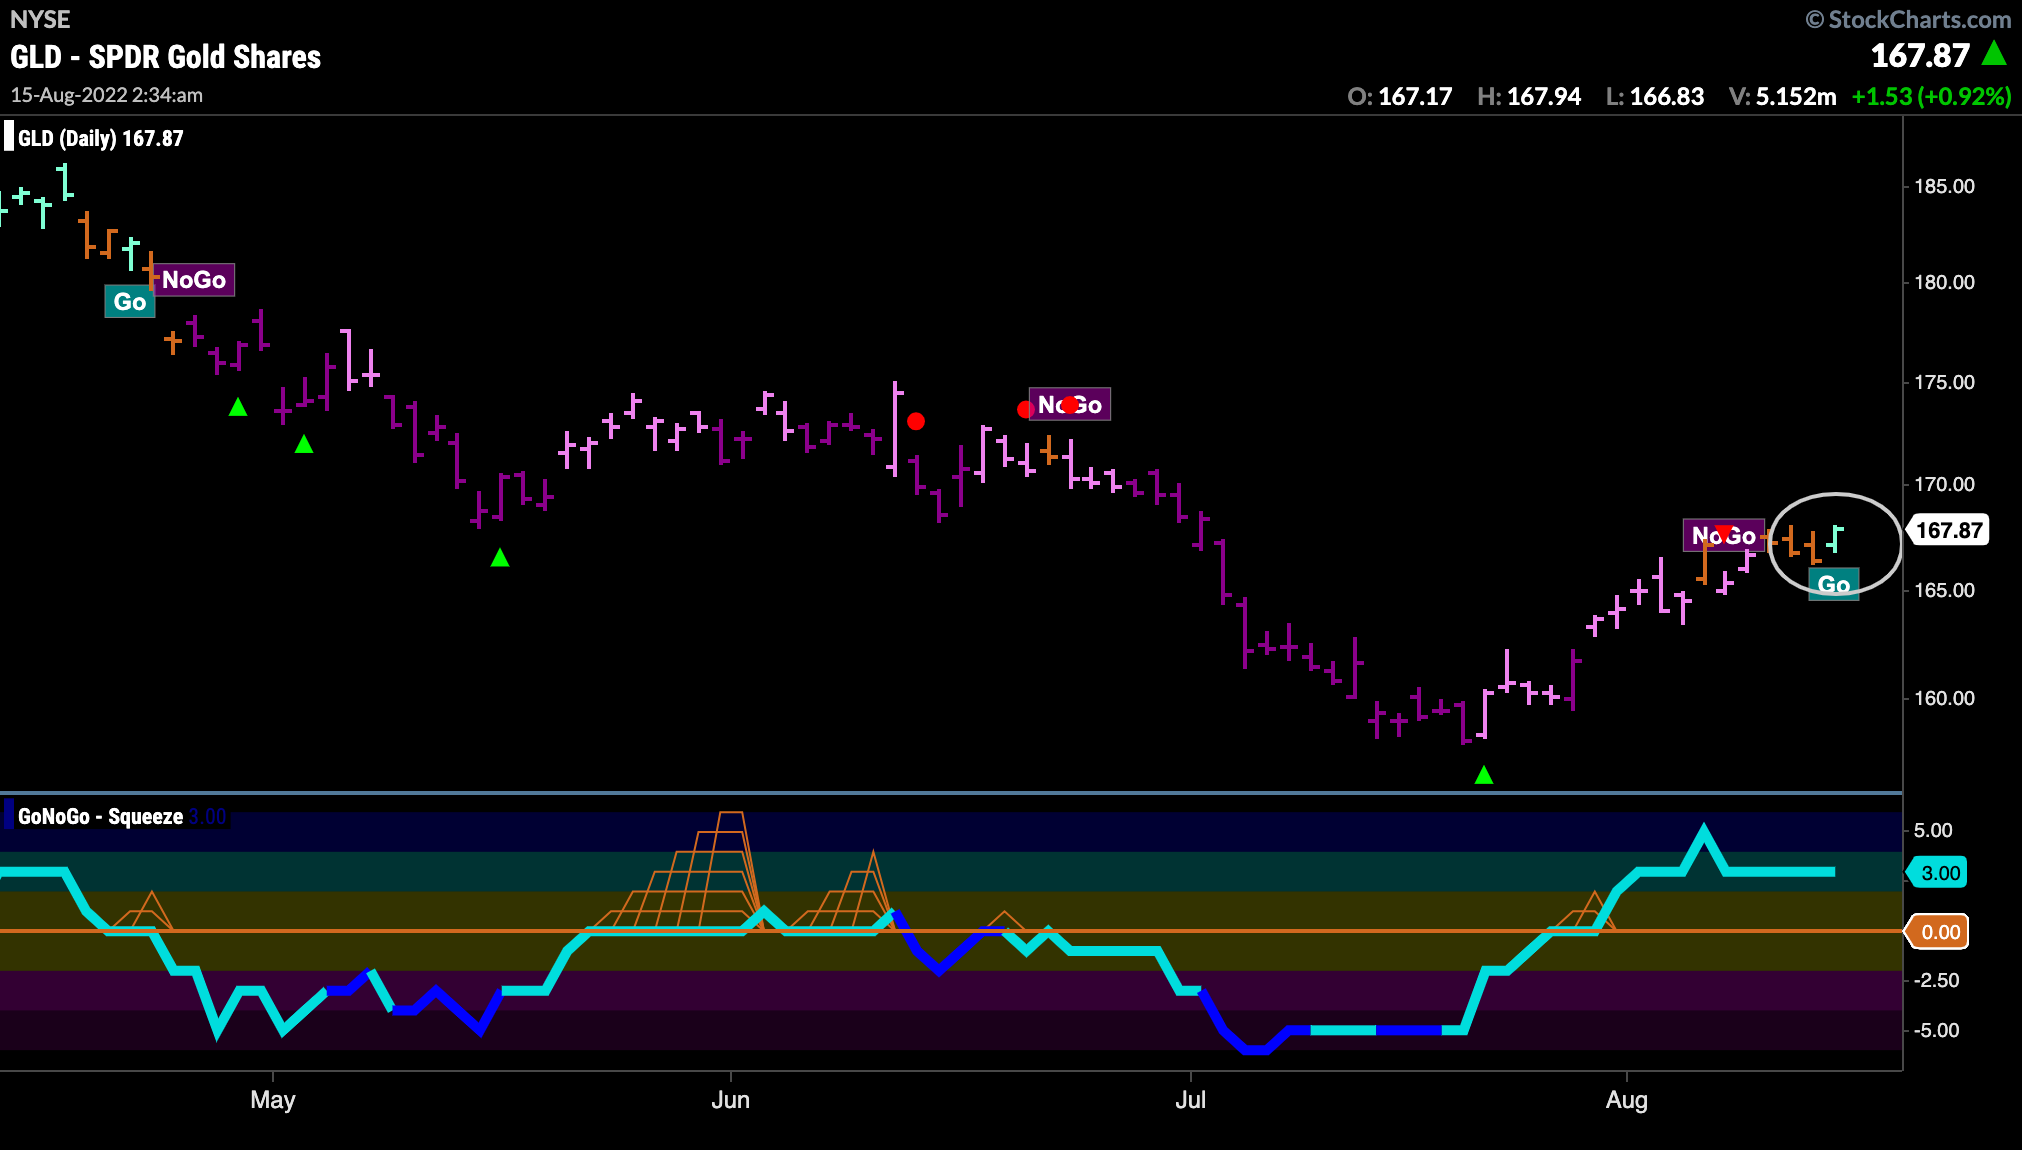
Precious Metals on the Rise as Gold Joins Silver in “Go”
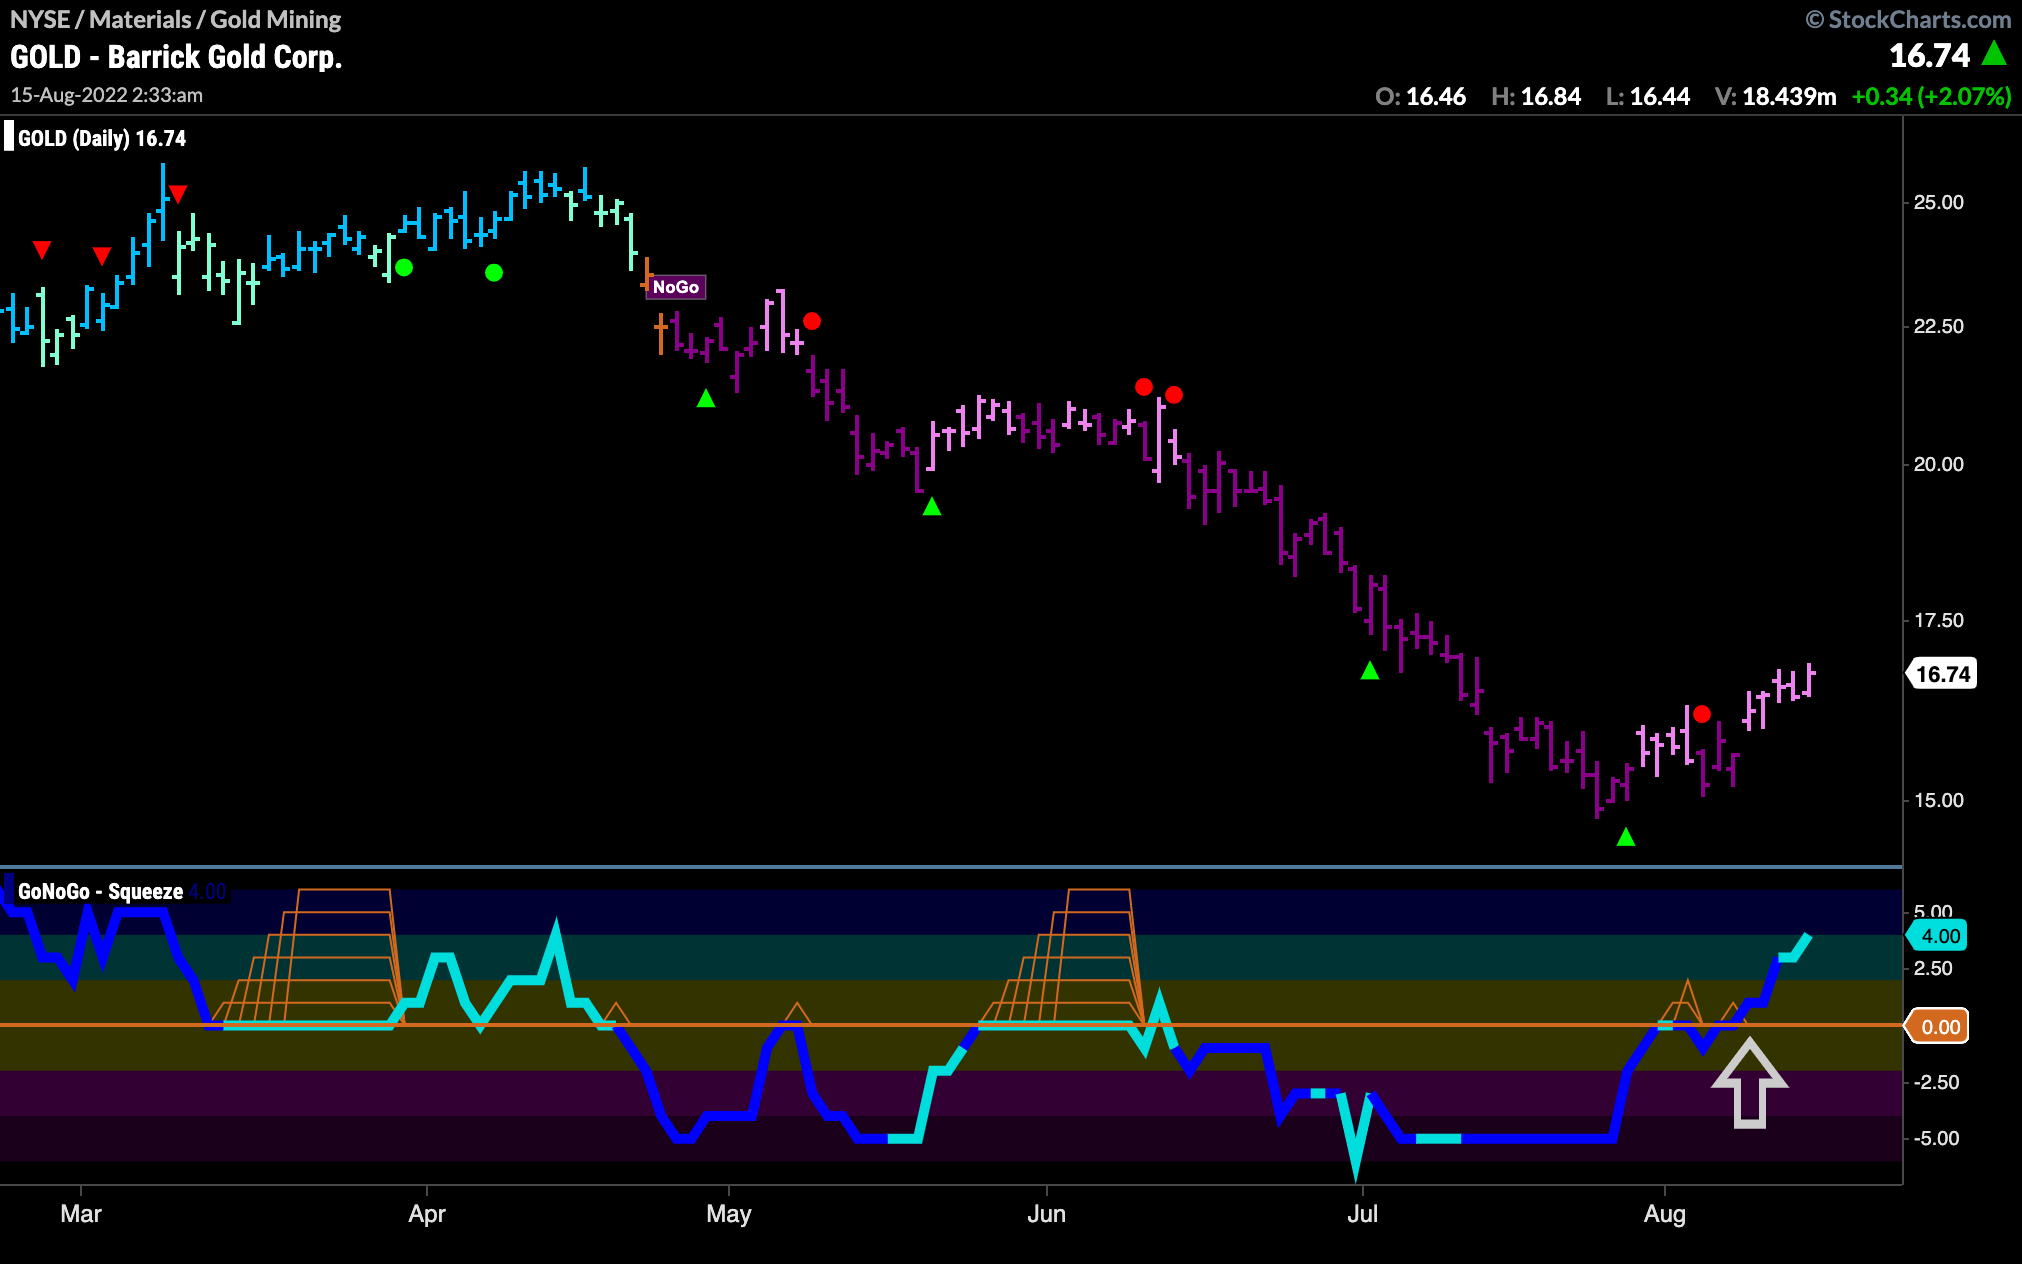
Look out, Gold Shares paints a “Go” bar for the first time in several months. After GoNoGo Oscillator broke through the zero line into positive territory over a week ago, GoNoGo Trend painted some amber “Go Fish” bars of uncertainty and has followed through with a “Go’ bar to end last week.
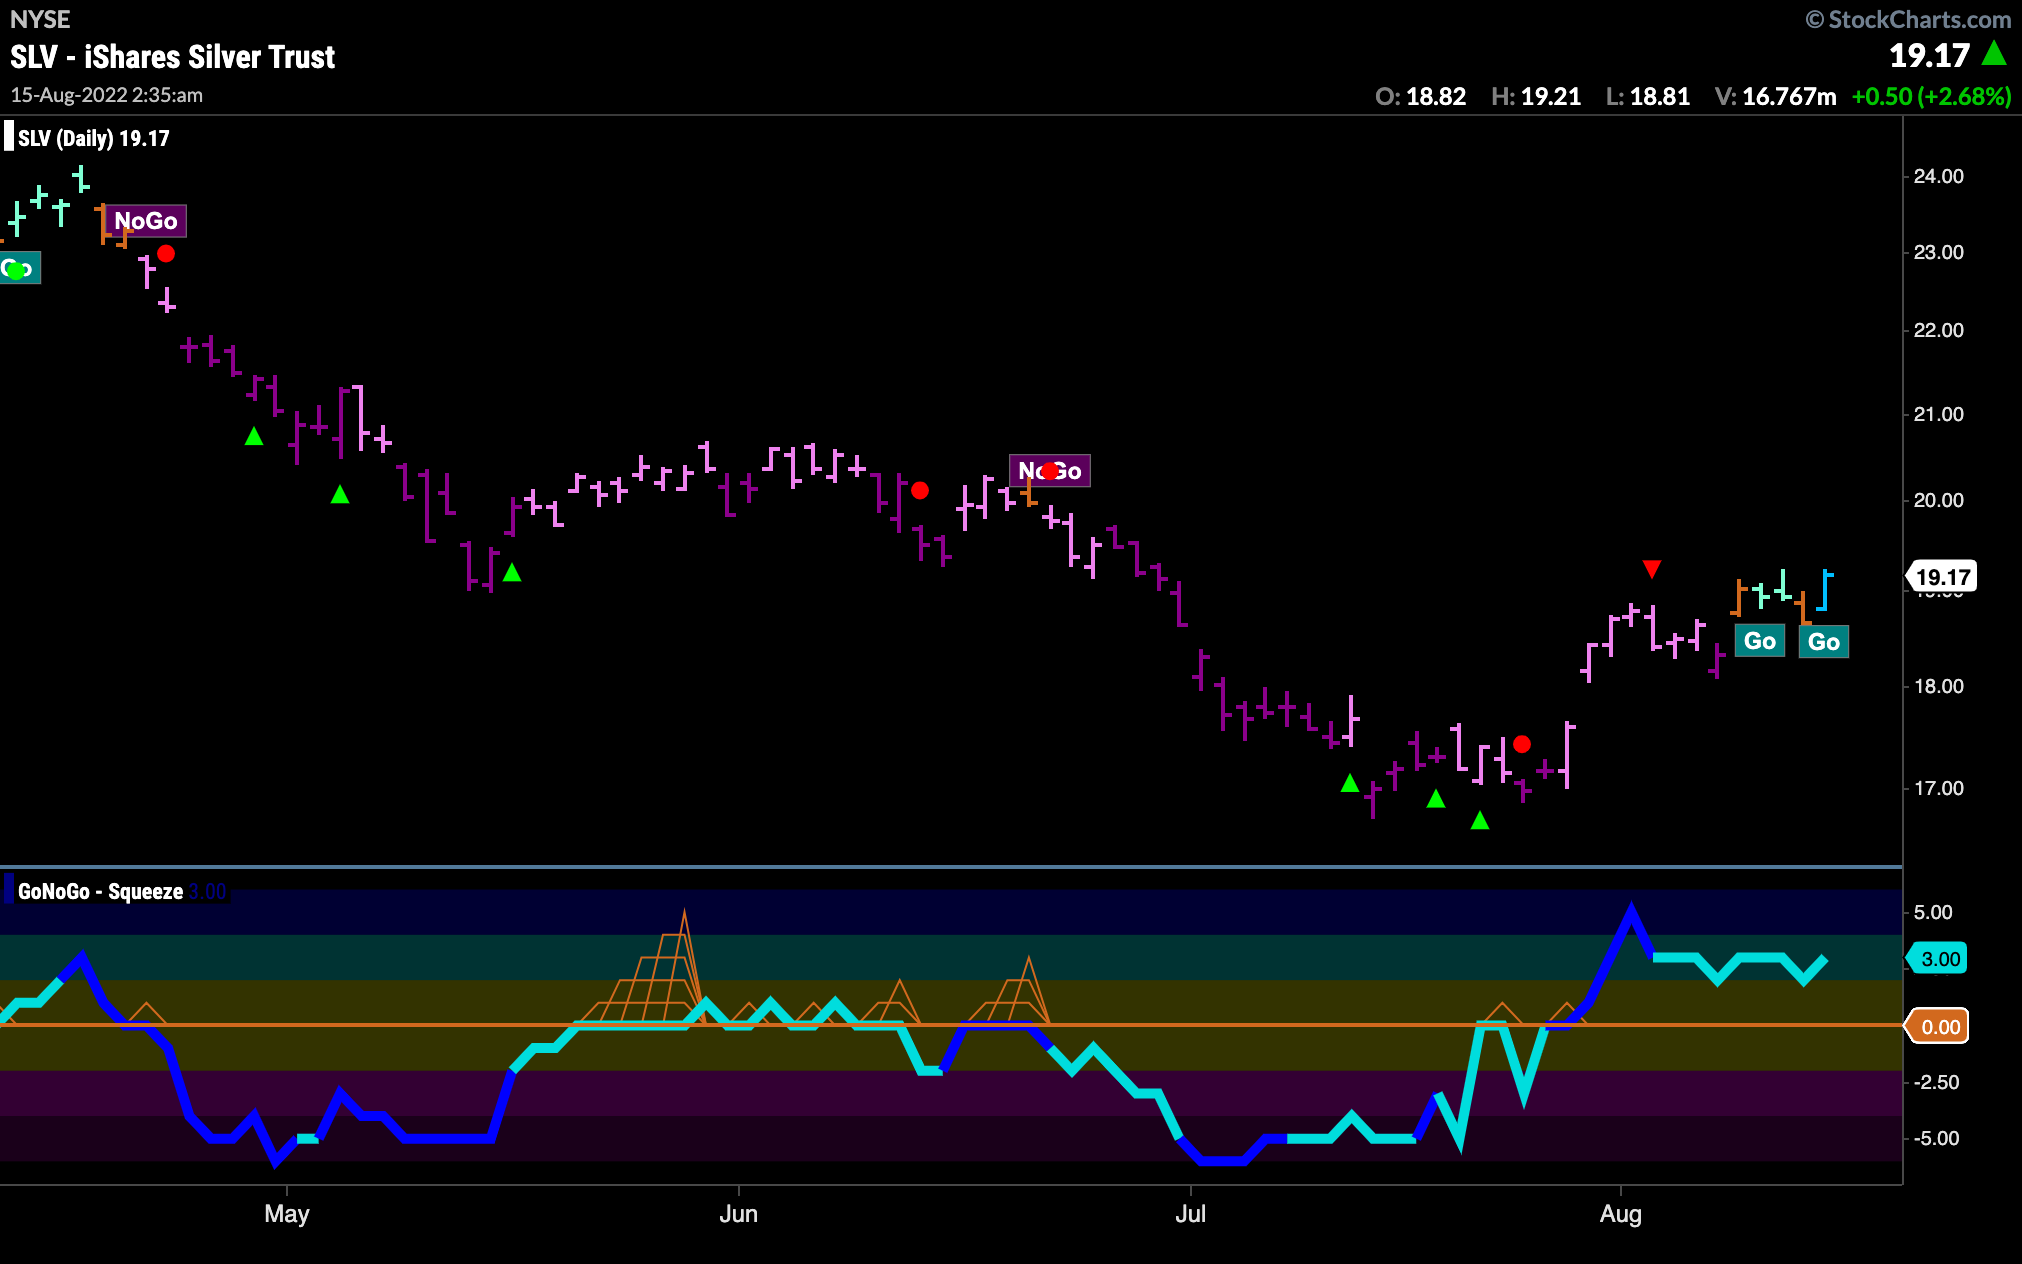
Silver, appears to be slightly ahead of Gold as it found aqua “Go” bars earlier in the week. GoNoGo Oscillator burst into positive territory on heavy volume well ahead of the trend change in price and we see now a strong blue “Go” bar as the oscillator remains in positive territory.
GoNoGo Oscillator Breaks Above Zero on Barrick Gold Corp
An opportunity to be early to the rotation into precious metals may be presenting itself when we look at the chart of $GOLD below. Not yet in a “Go” trend, price is rallying off the lows from last month. GoNoGo Oscillator has broken into positive territory on heavy volume several sessions ago and this can be taken as a threat to the current “NoGo” trend. If this bullish activity continues we may well see price paint “Go” bars soon.
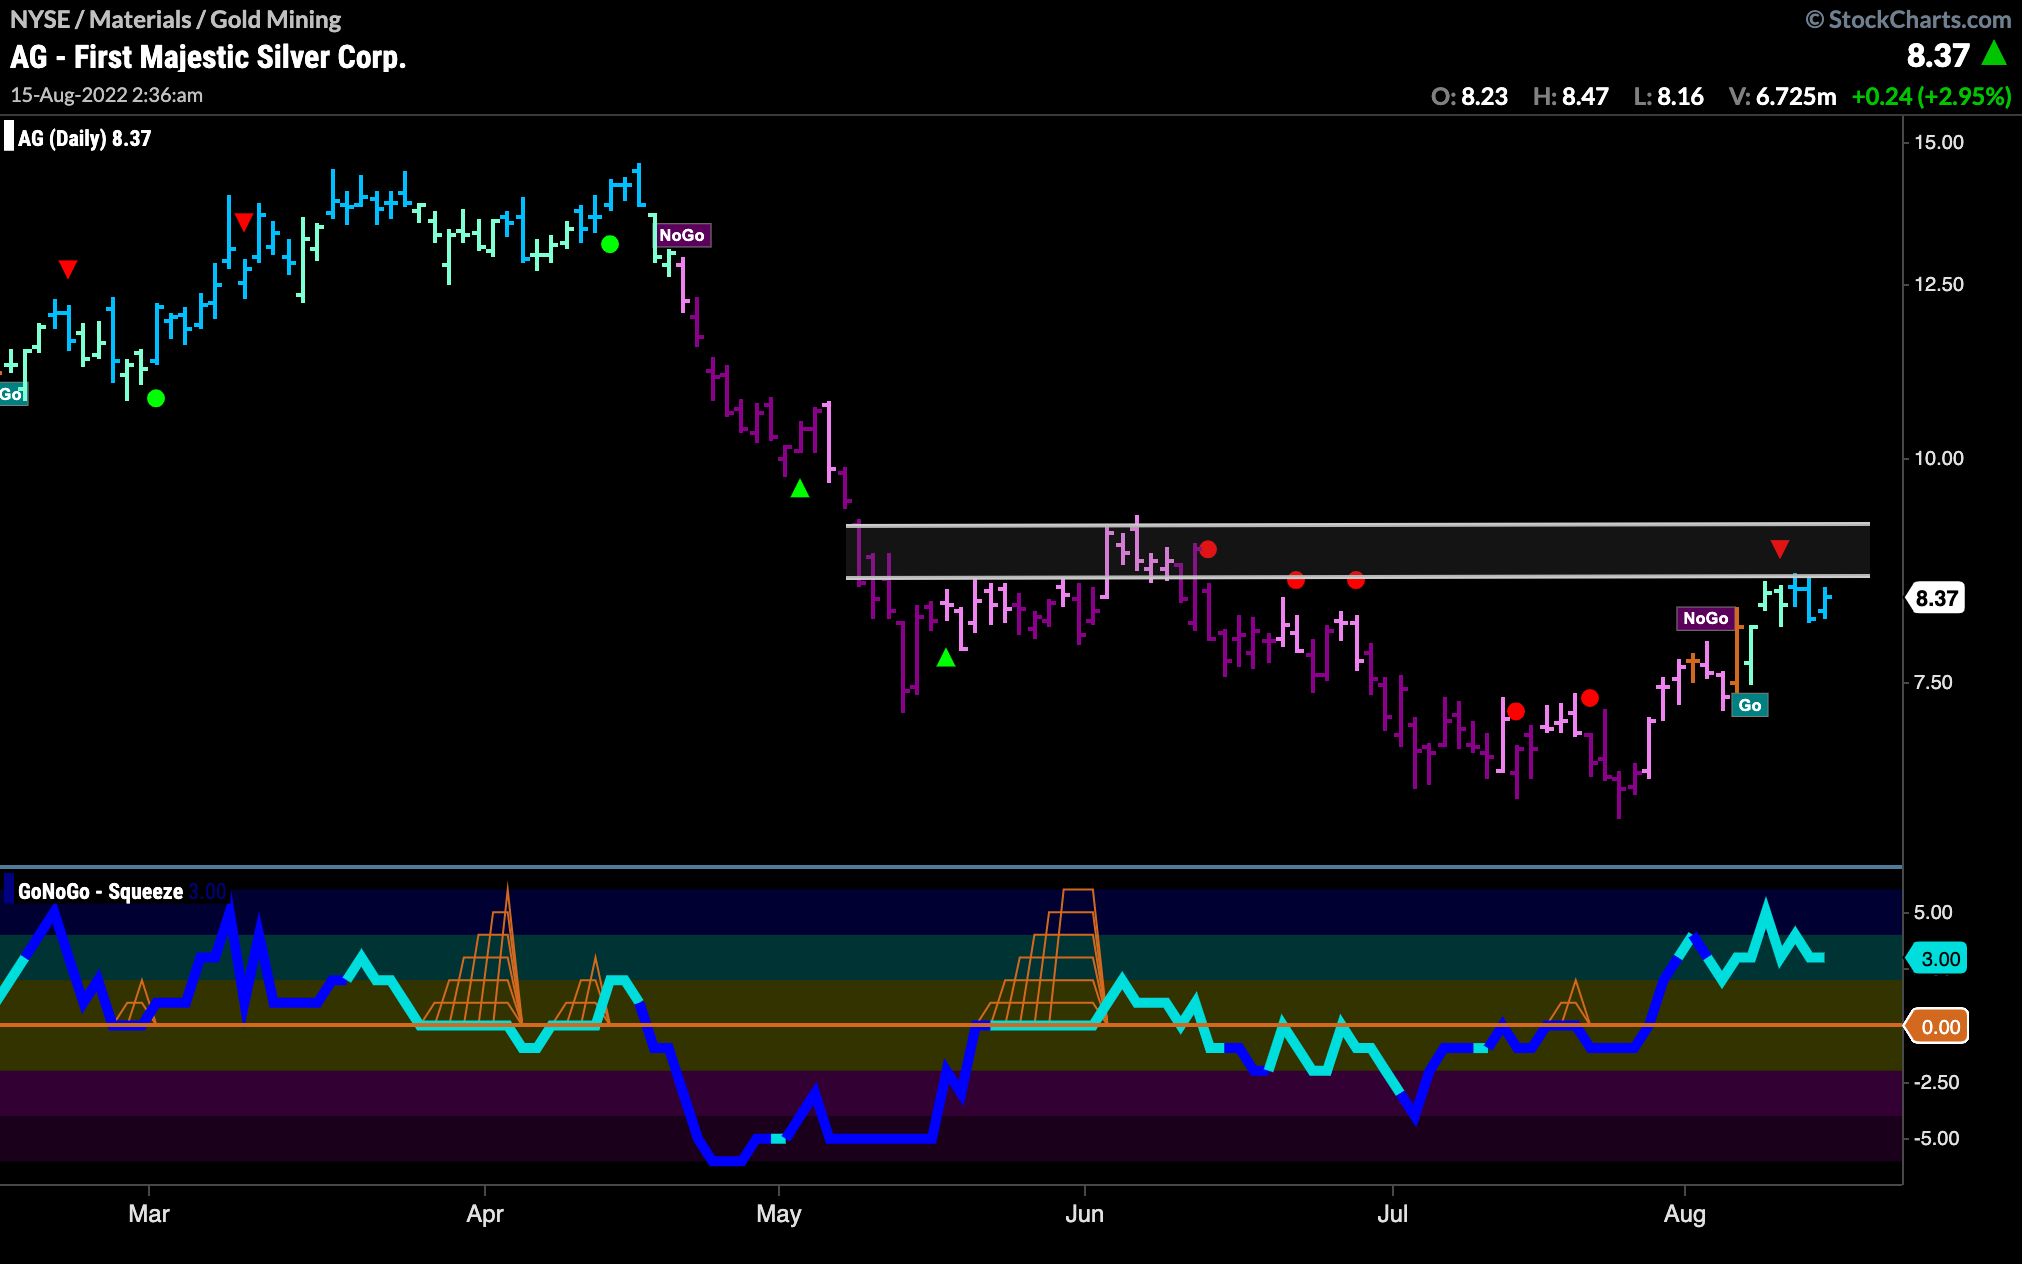
First Majestic Silver in “Go” but Dealing with Resistance
Already in a “Go” trend, indeed painting strong blue bars to end the week, First Majestic Silver Corp is facing some resistance from overhead supply. We would like to see price move through this resistance zone and set a new higher high which would show the new “Go” trend to be strong.
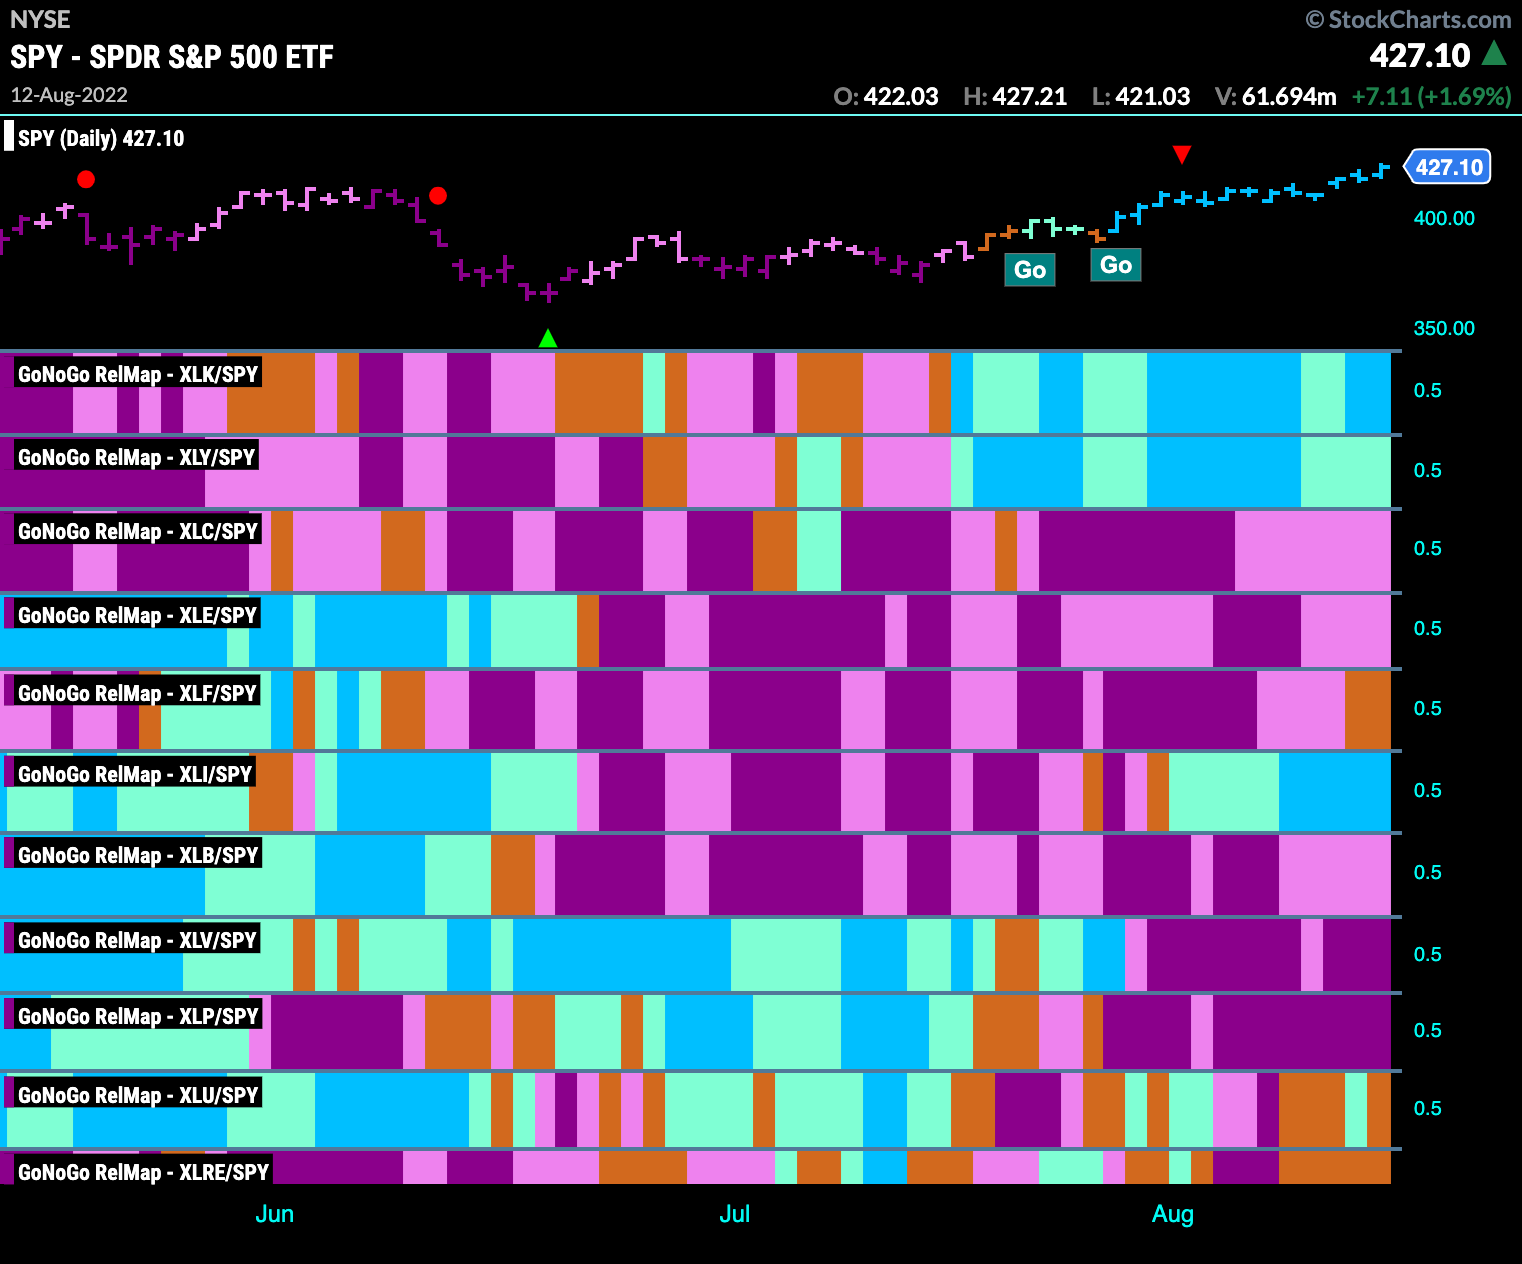
Sector RelMap
Below is the GoNoGo Sector Relmap. This GoNoGo Relmap applies the GoNoGo Trend to the relative strength ratios of the sectors to the base index. Looking at this map, we can quickly see where the relative outperformance is coming from as well as which sectors are lagging on a relative basis. We see strength continue in the growth sectors, technology and discretionary. Of interest is the industrials sector which has strengthened this week painting strong blue “Go” bars.
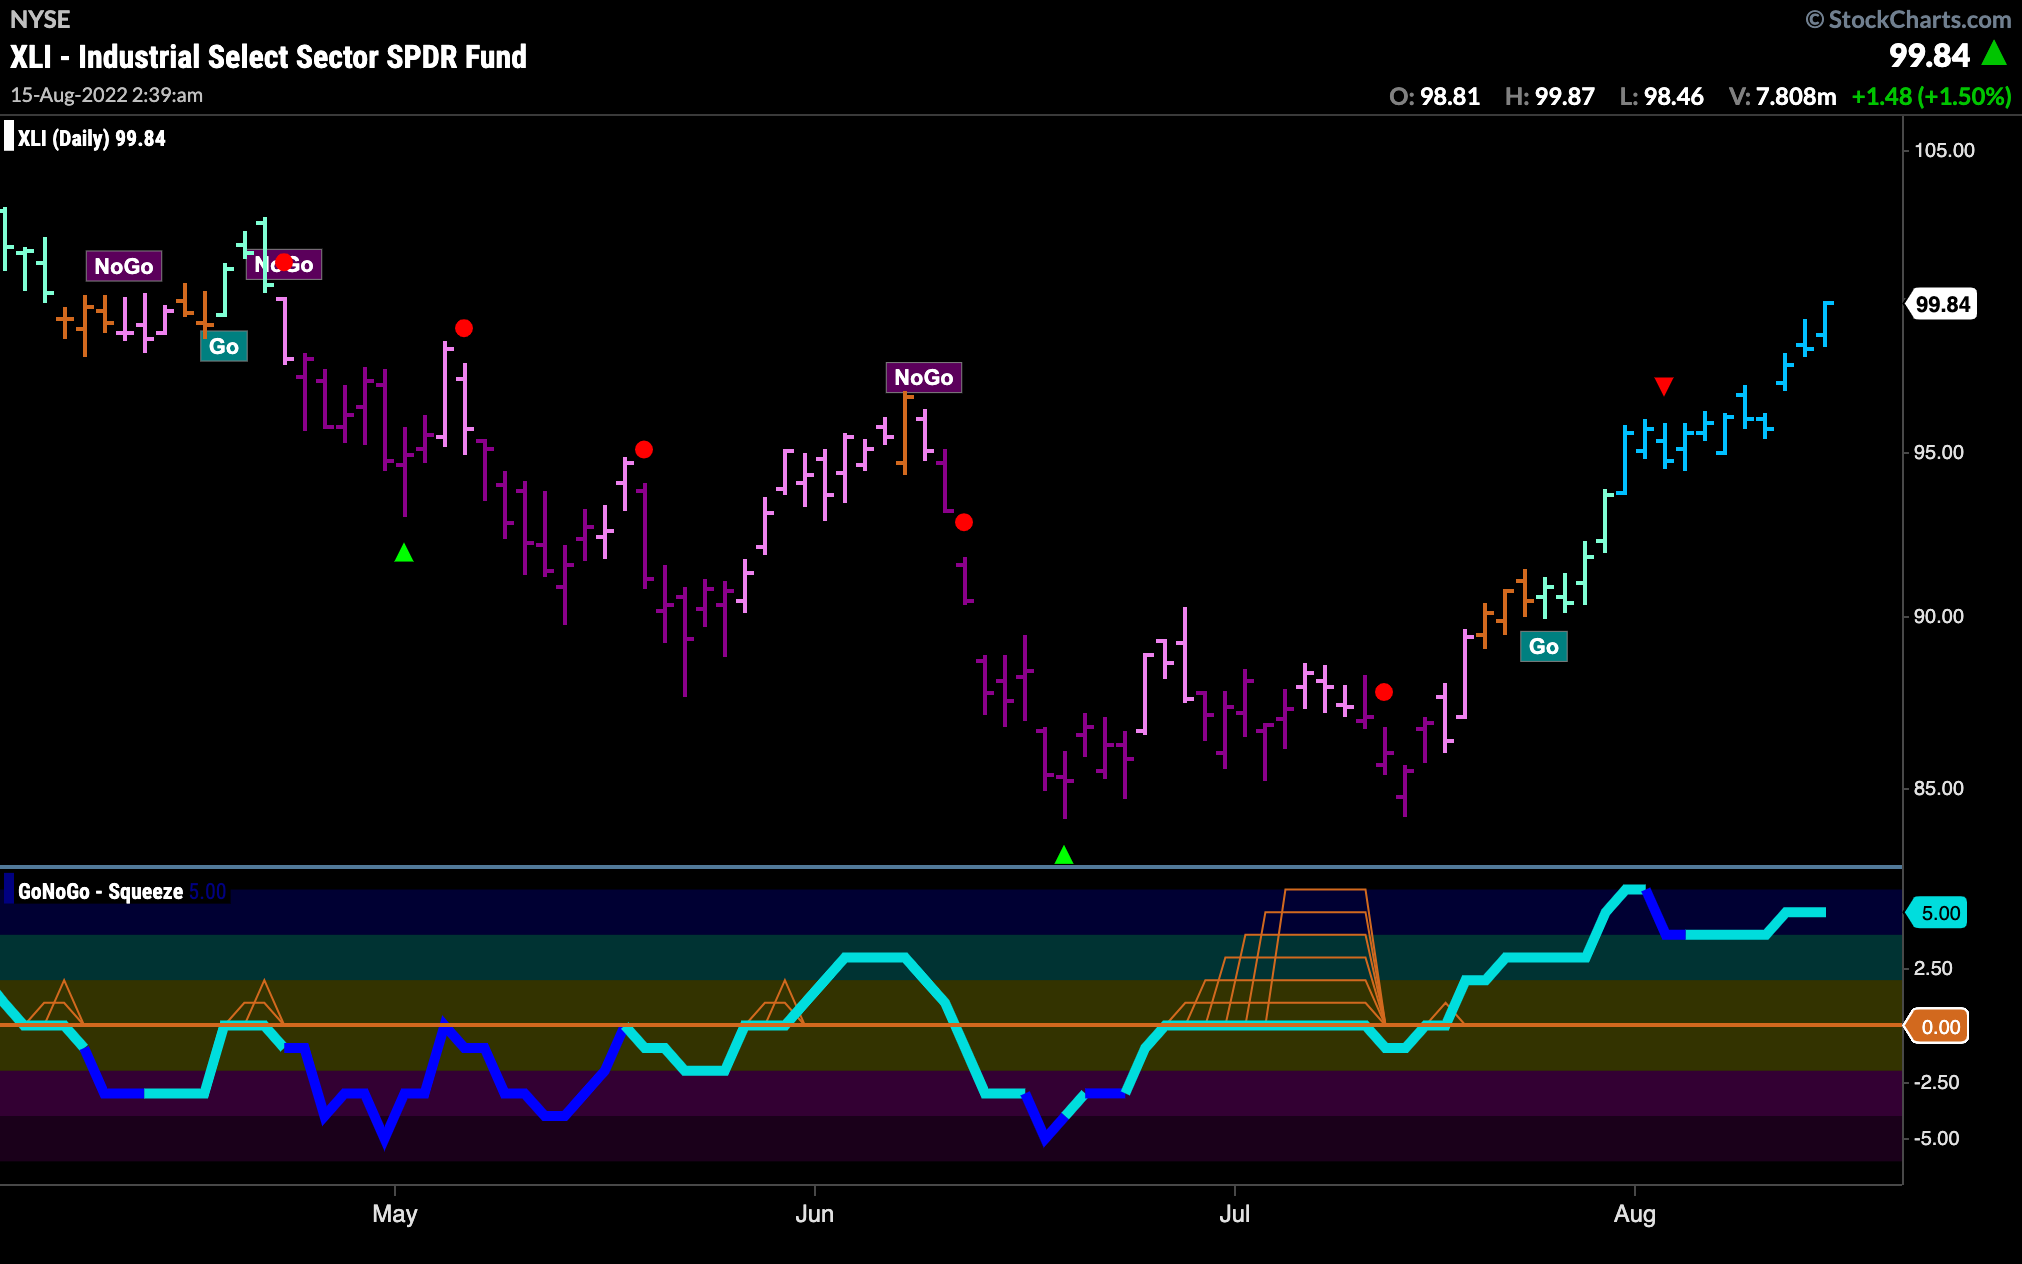
Industrials Make New Higher High
With the strength in precious metals just discussed, it is perhaps no surprise to see the industrials sector performing well. Below is the daily GoNoGo Chart showing a string of uninterrupted strong blue “Go” bars as price moves above resistance to set a higher high. GoNoGo Oscillator remains elevated in overbought territory.
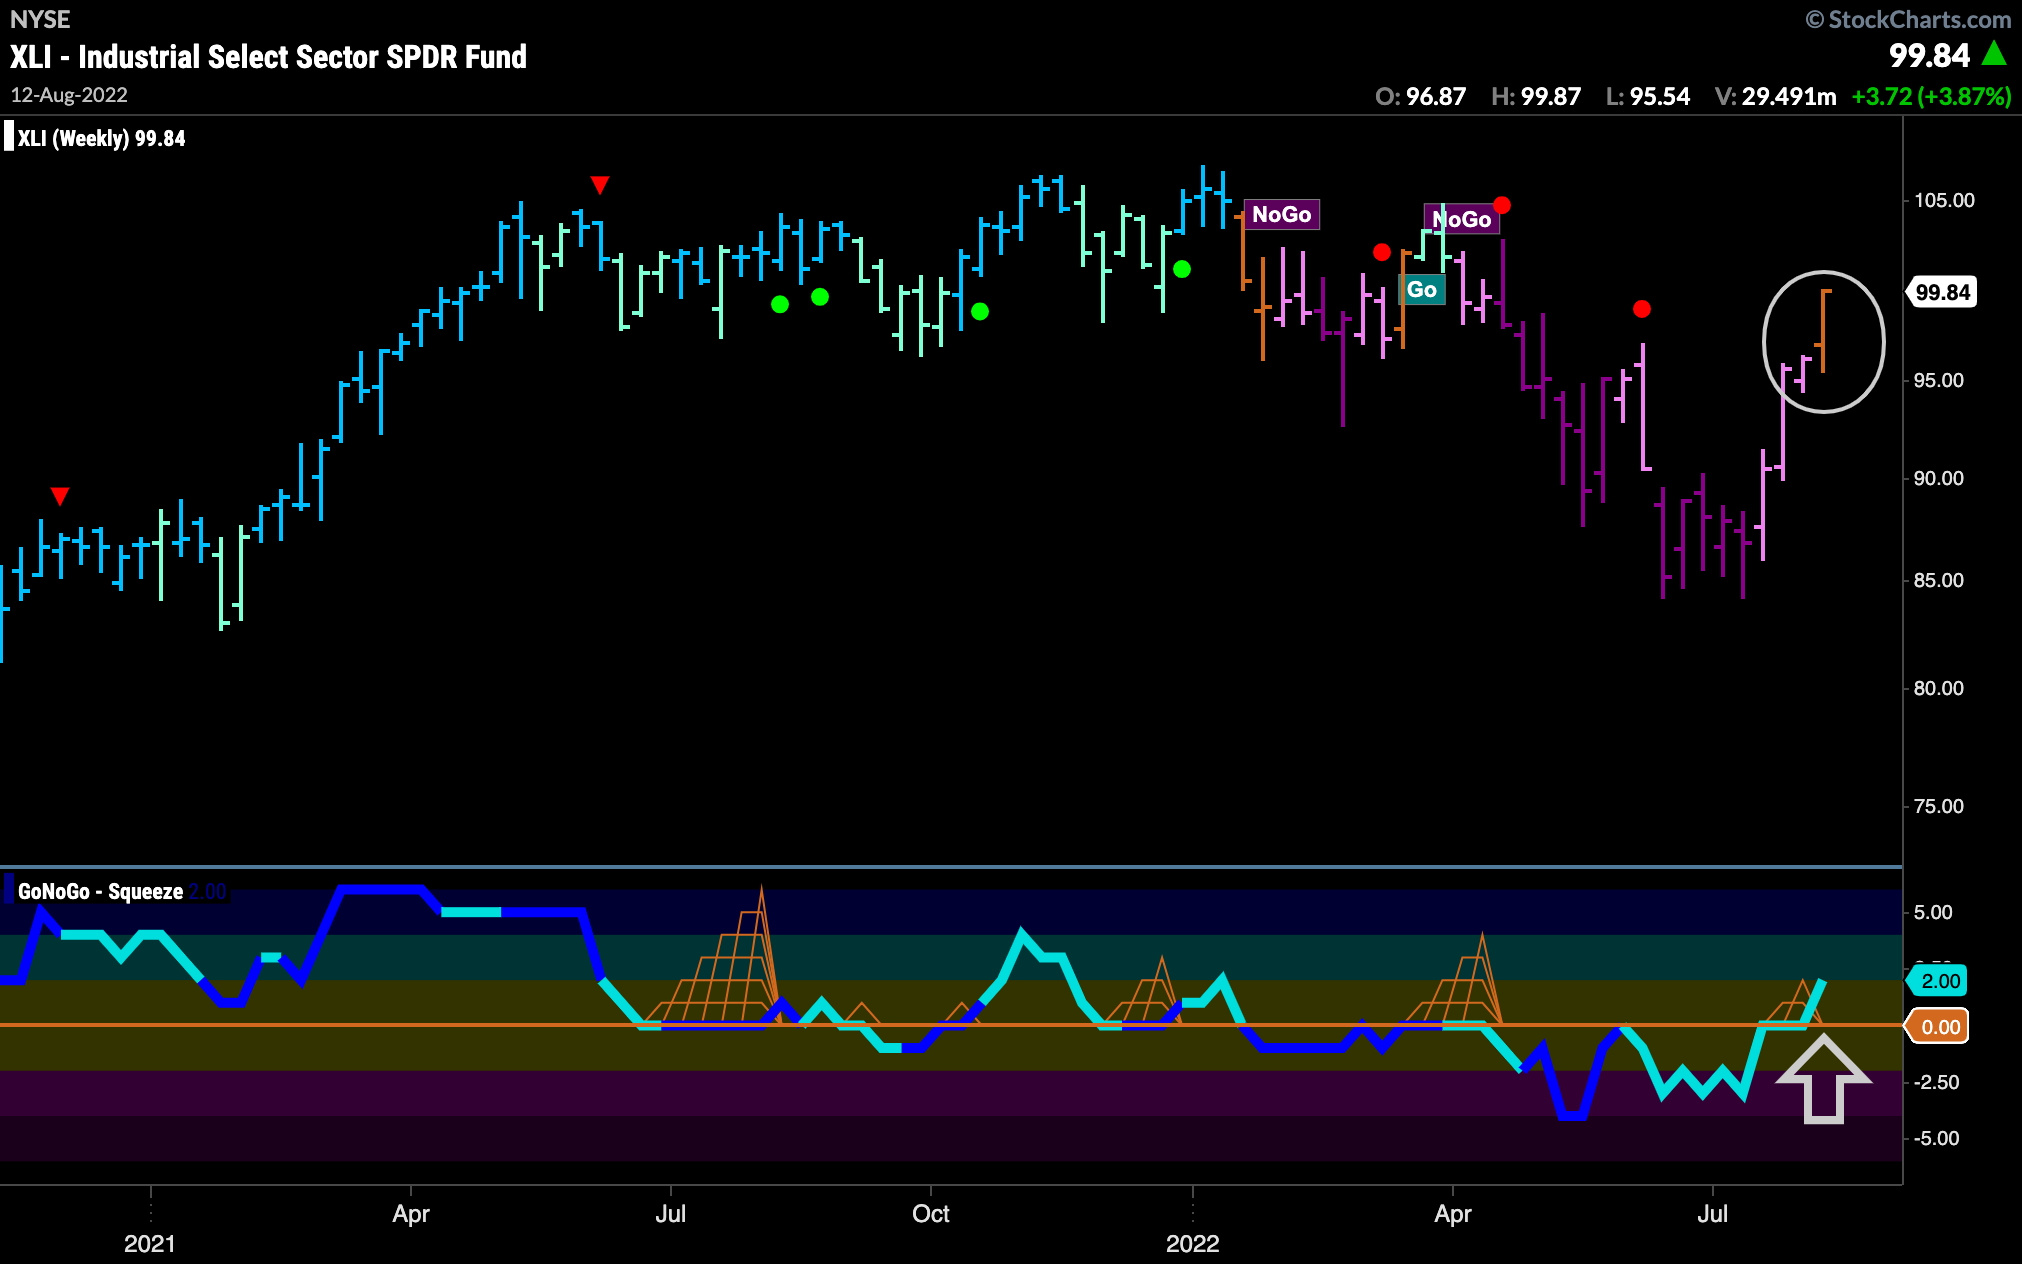
On a longer term chart, we see change. Price has rallied enough on the daily chart to cause the weekly to paint an amber “Go Fish” bar. This is the first time the “NoGo” has been broken for several months. GoNoGo Oscillator has also broken above the zero line into positive territory which makes the move to a “Go Fish” bar in price more significant.
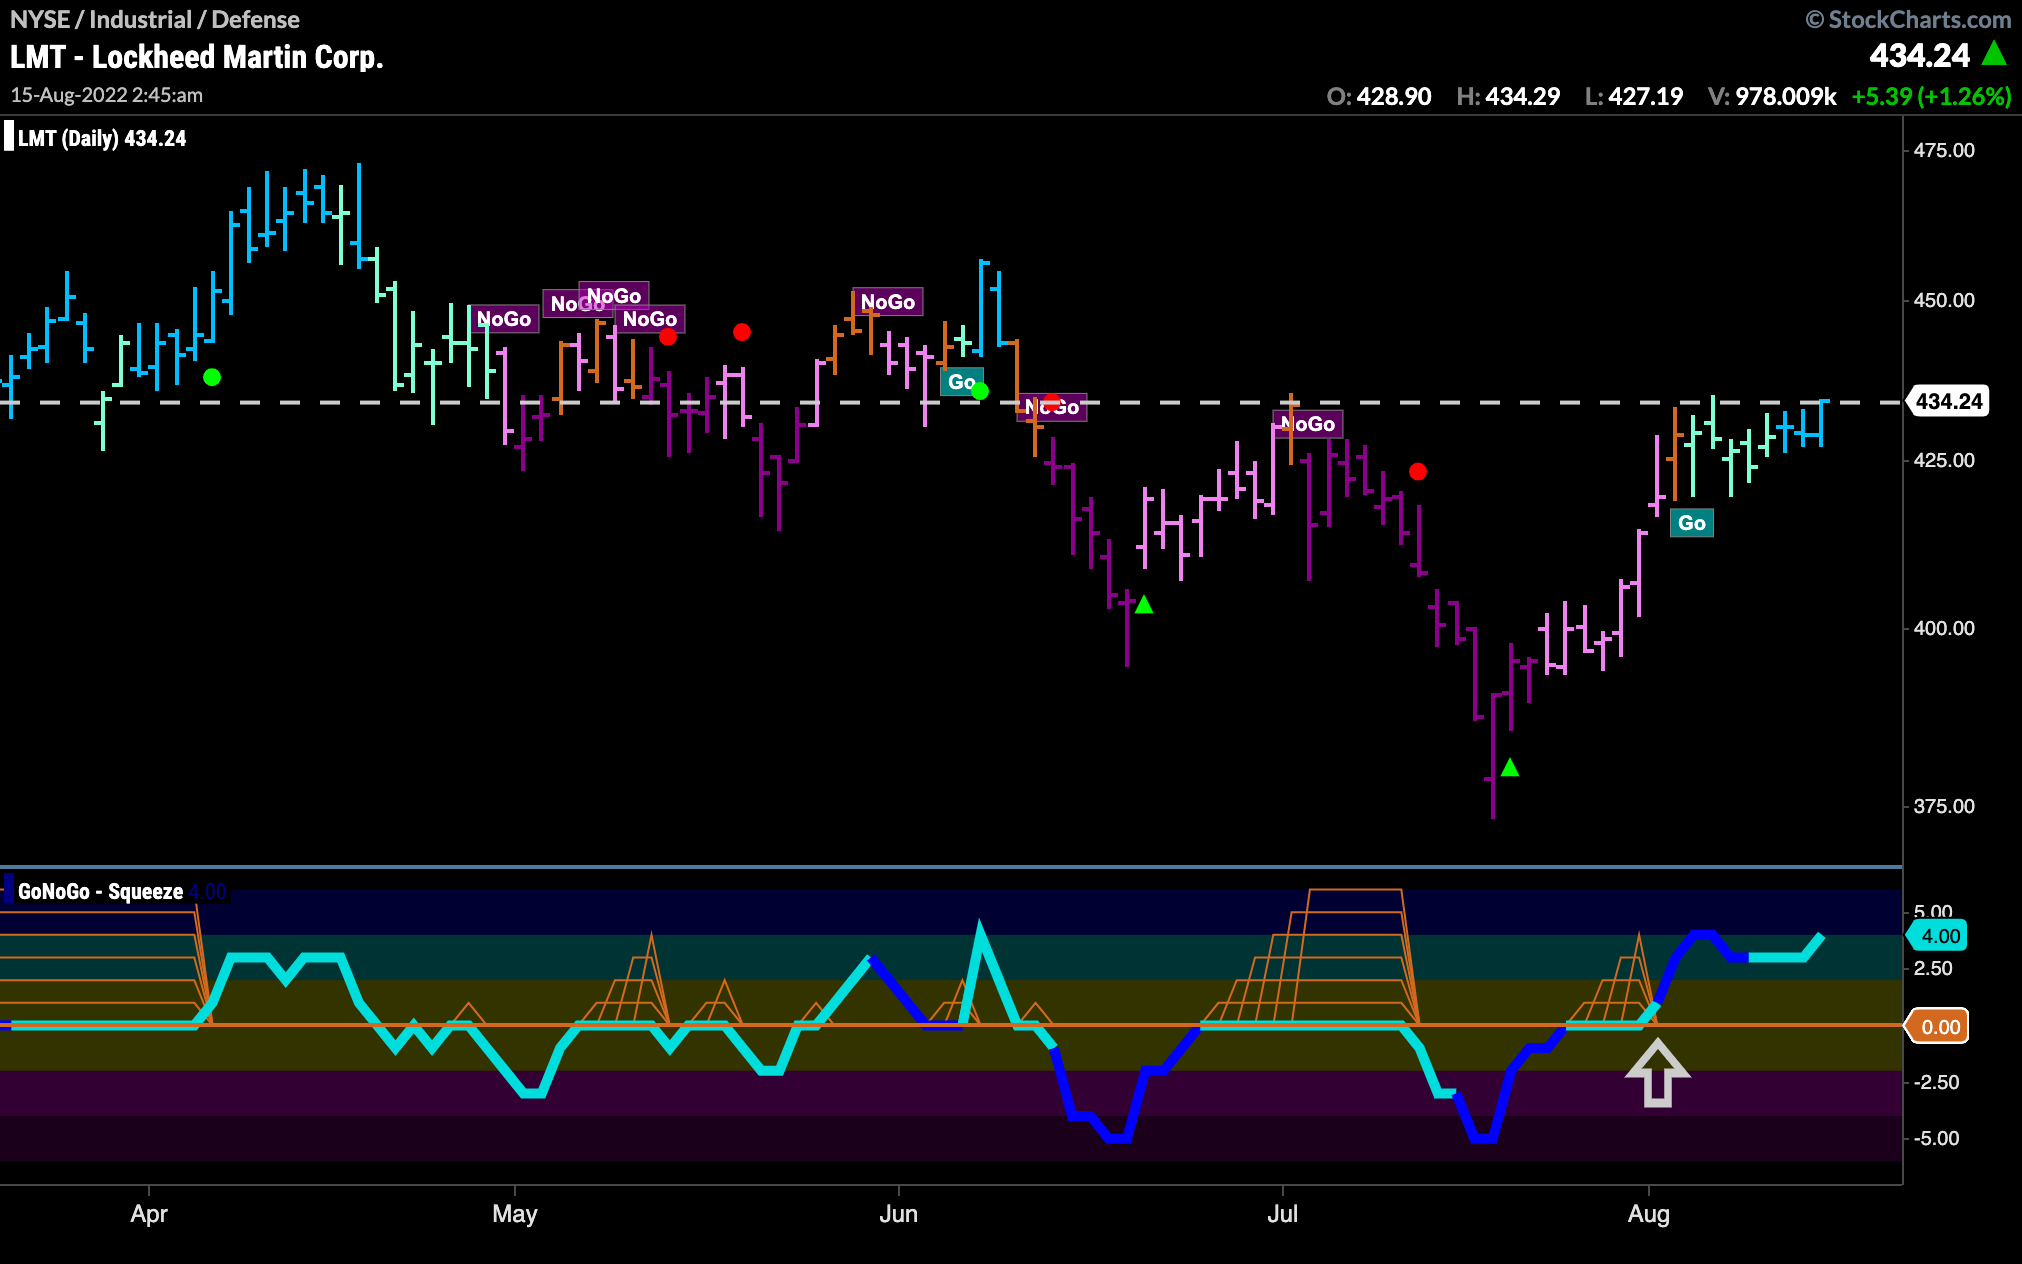
Lockheed Martin Looking to Break Resistance
As the industrials sector continues to show strength, let’s look at one of the industry giants $LMT. With a “Go” trend in place, we are butting up against price levels that have caused real trouble in the past. However, with GoNoGo Oscillator firmly in positive territory, perhaps there is enough momentum for price to set a new high and move back towards prior highs around $475.
