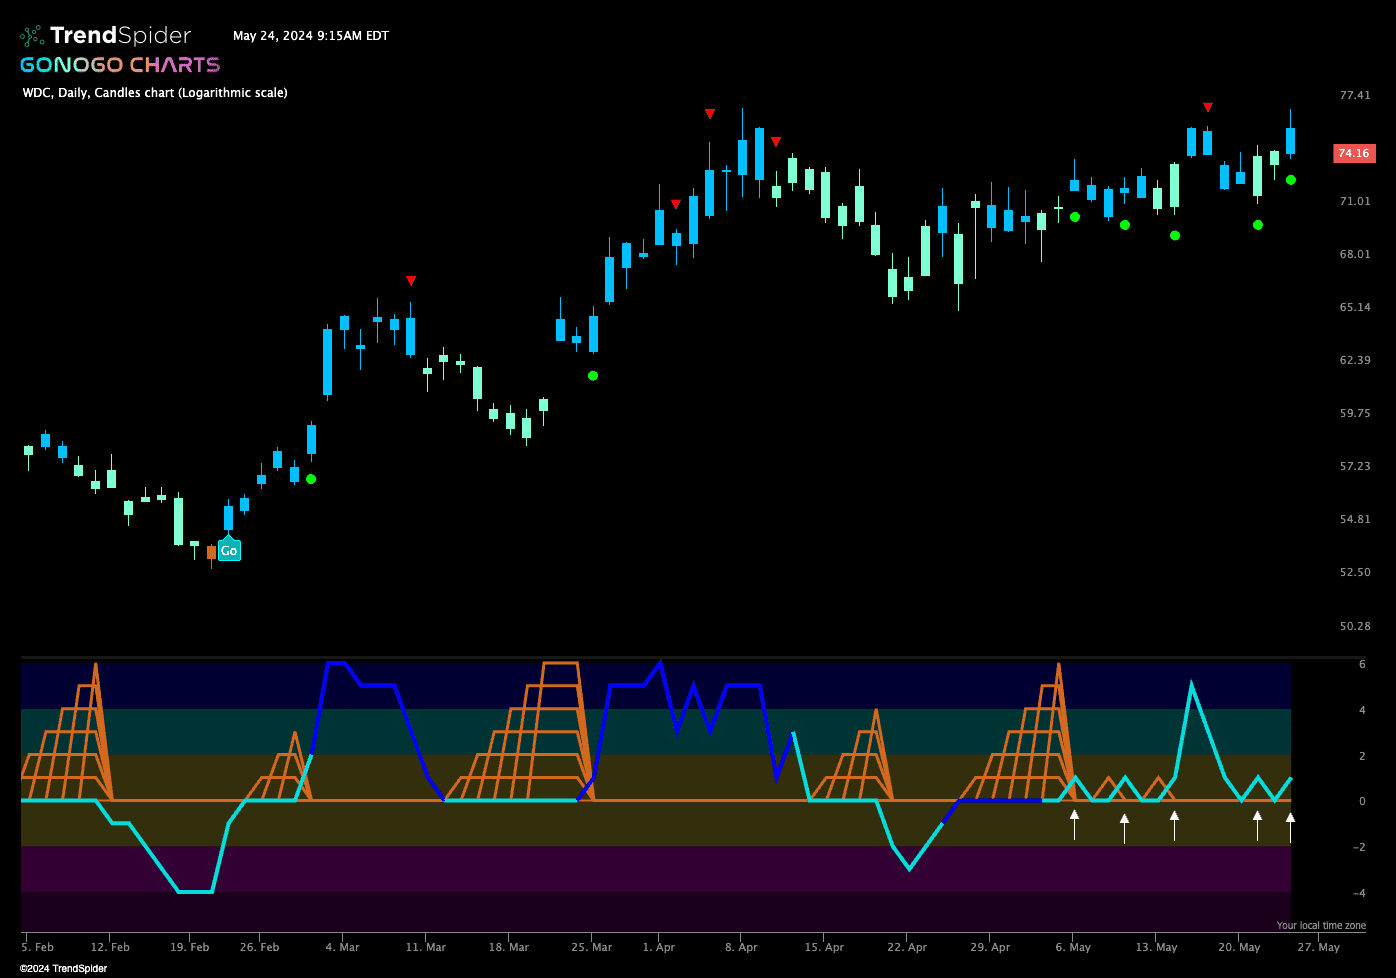
$WDC has been in a “Go” trend since November of last year.
After hitting another higher high in early April, price has moved against the trend or sideways following a Go Countertrend Correction Icon (red arrow) that signaled price may struggle to go higher in the short term. As price pulled back, we saw GoNoGo Trend paint a string of weaker aqua bars and GoNoGo Oscillator dipped into negative territory. However, GoNoGo Trend never released its grip on “Go” bars and the trend persisted. As price climbed, GoNoGo Oscillator broke back above the zero line and it has been at or above this level since. We have seen a mixture of aqua and strong blue bars over the past few weeks as GoNoGo Oscillator repeatedly finds support at the zero line. Each time it does, we have seen a Go Trend Continuation Icon (green circle) informing us that momentum is resurgent in the direction of the underlying “Go” trend. Now, price has rallied to test the prior high from early April, and we have seen the oscillator find support once again at zero. With a fresh surge of positive momentum and strong blue “Go” bars, we will look for price to make an attempt at a new higher high.


