
S&P 500 saw incredible swings yesterday as did all the major indices.
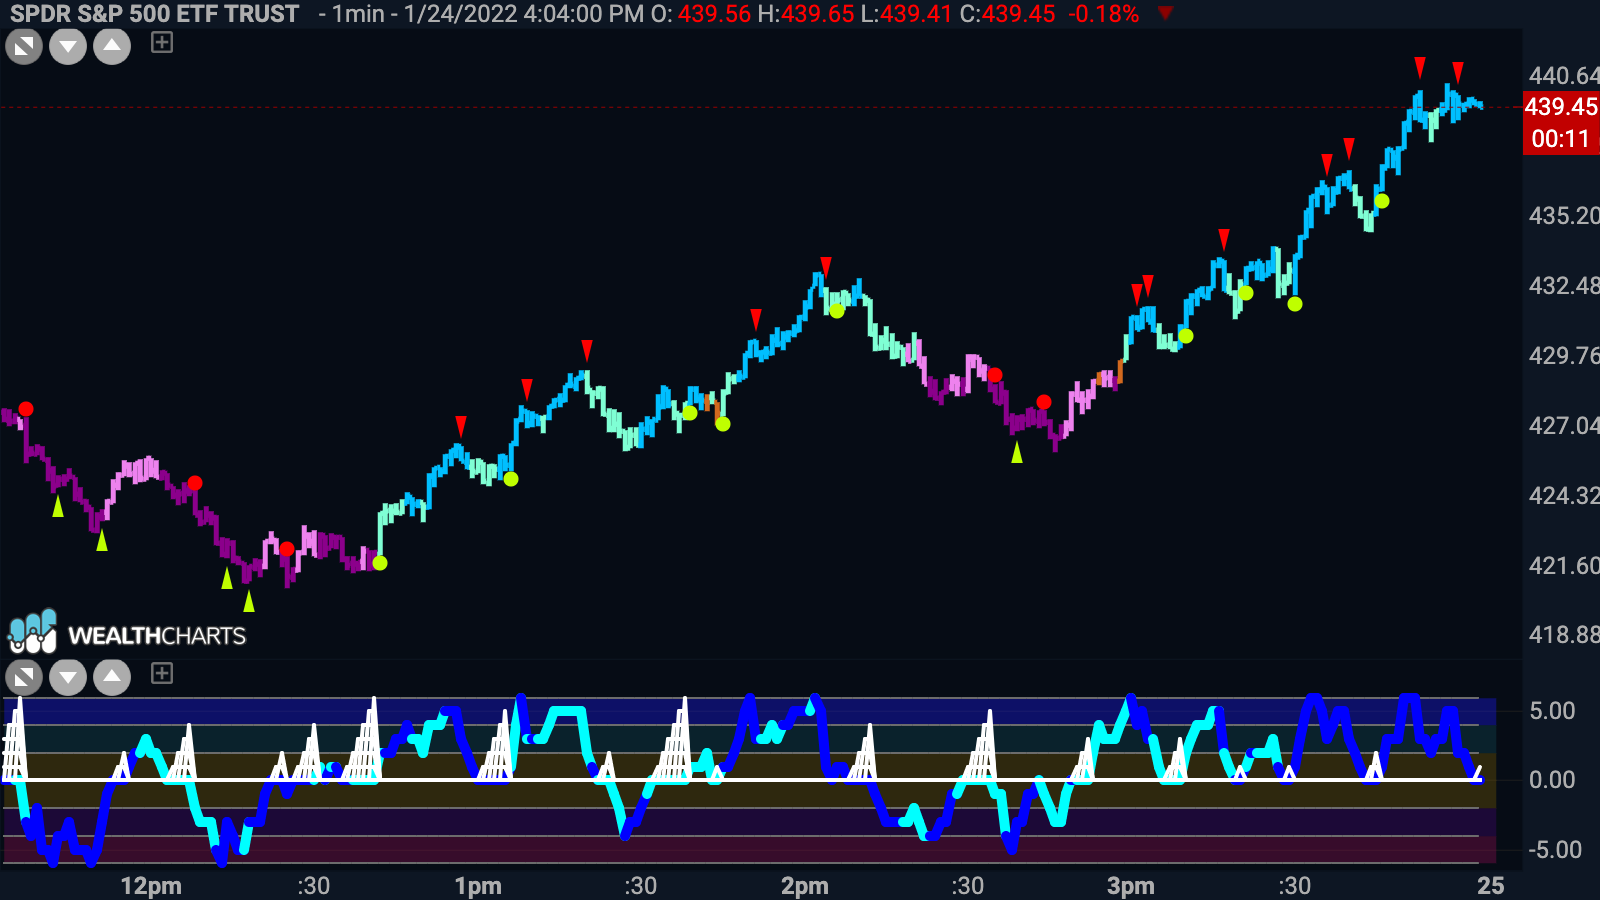
With the technology rich Nasdaq plunging around 5%, the S&P 500 fell around 4% before closing up almost half a percent. the 1 minute chart below shows the incredible swings highlighted by the blues of the “Go” and the pinks/purples of the ‘NoGo”. A lot of money was moved around yesterday and a lot of money was made and lost. As a technician, I am loathe to give an opinion not based on price action but volatility like we saw yesterday gives me the feel of an uncertain market. Yes it was good that we closed higher, but I’m not sure it bodes well for the near future.


