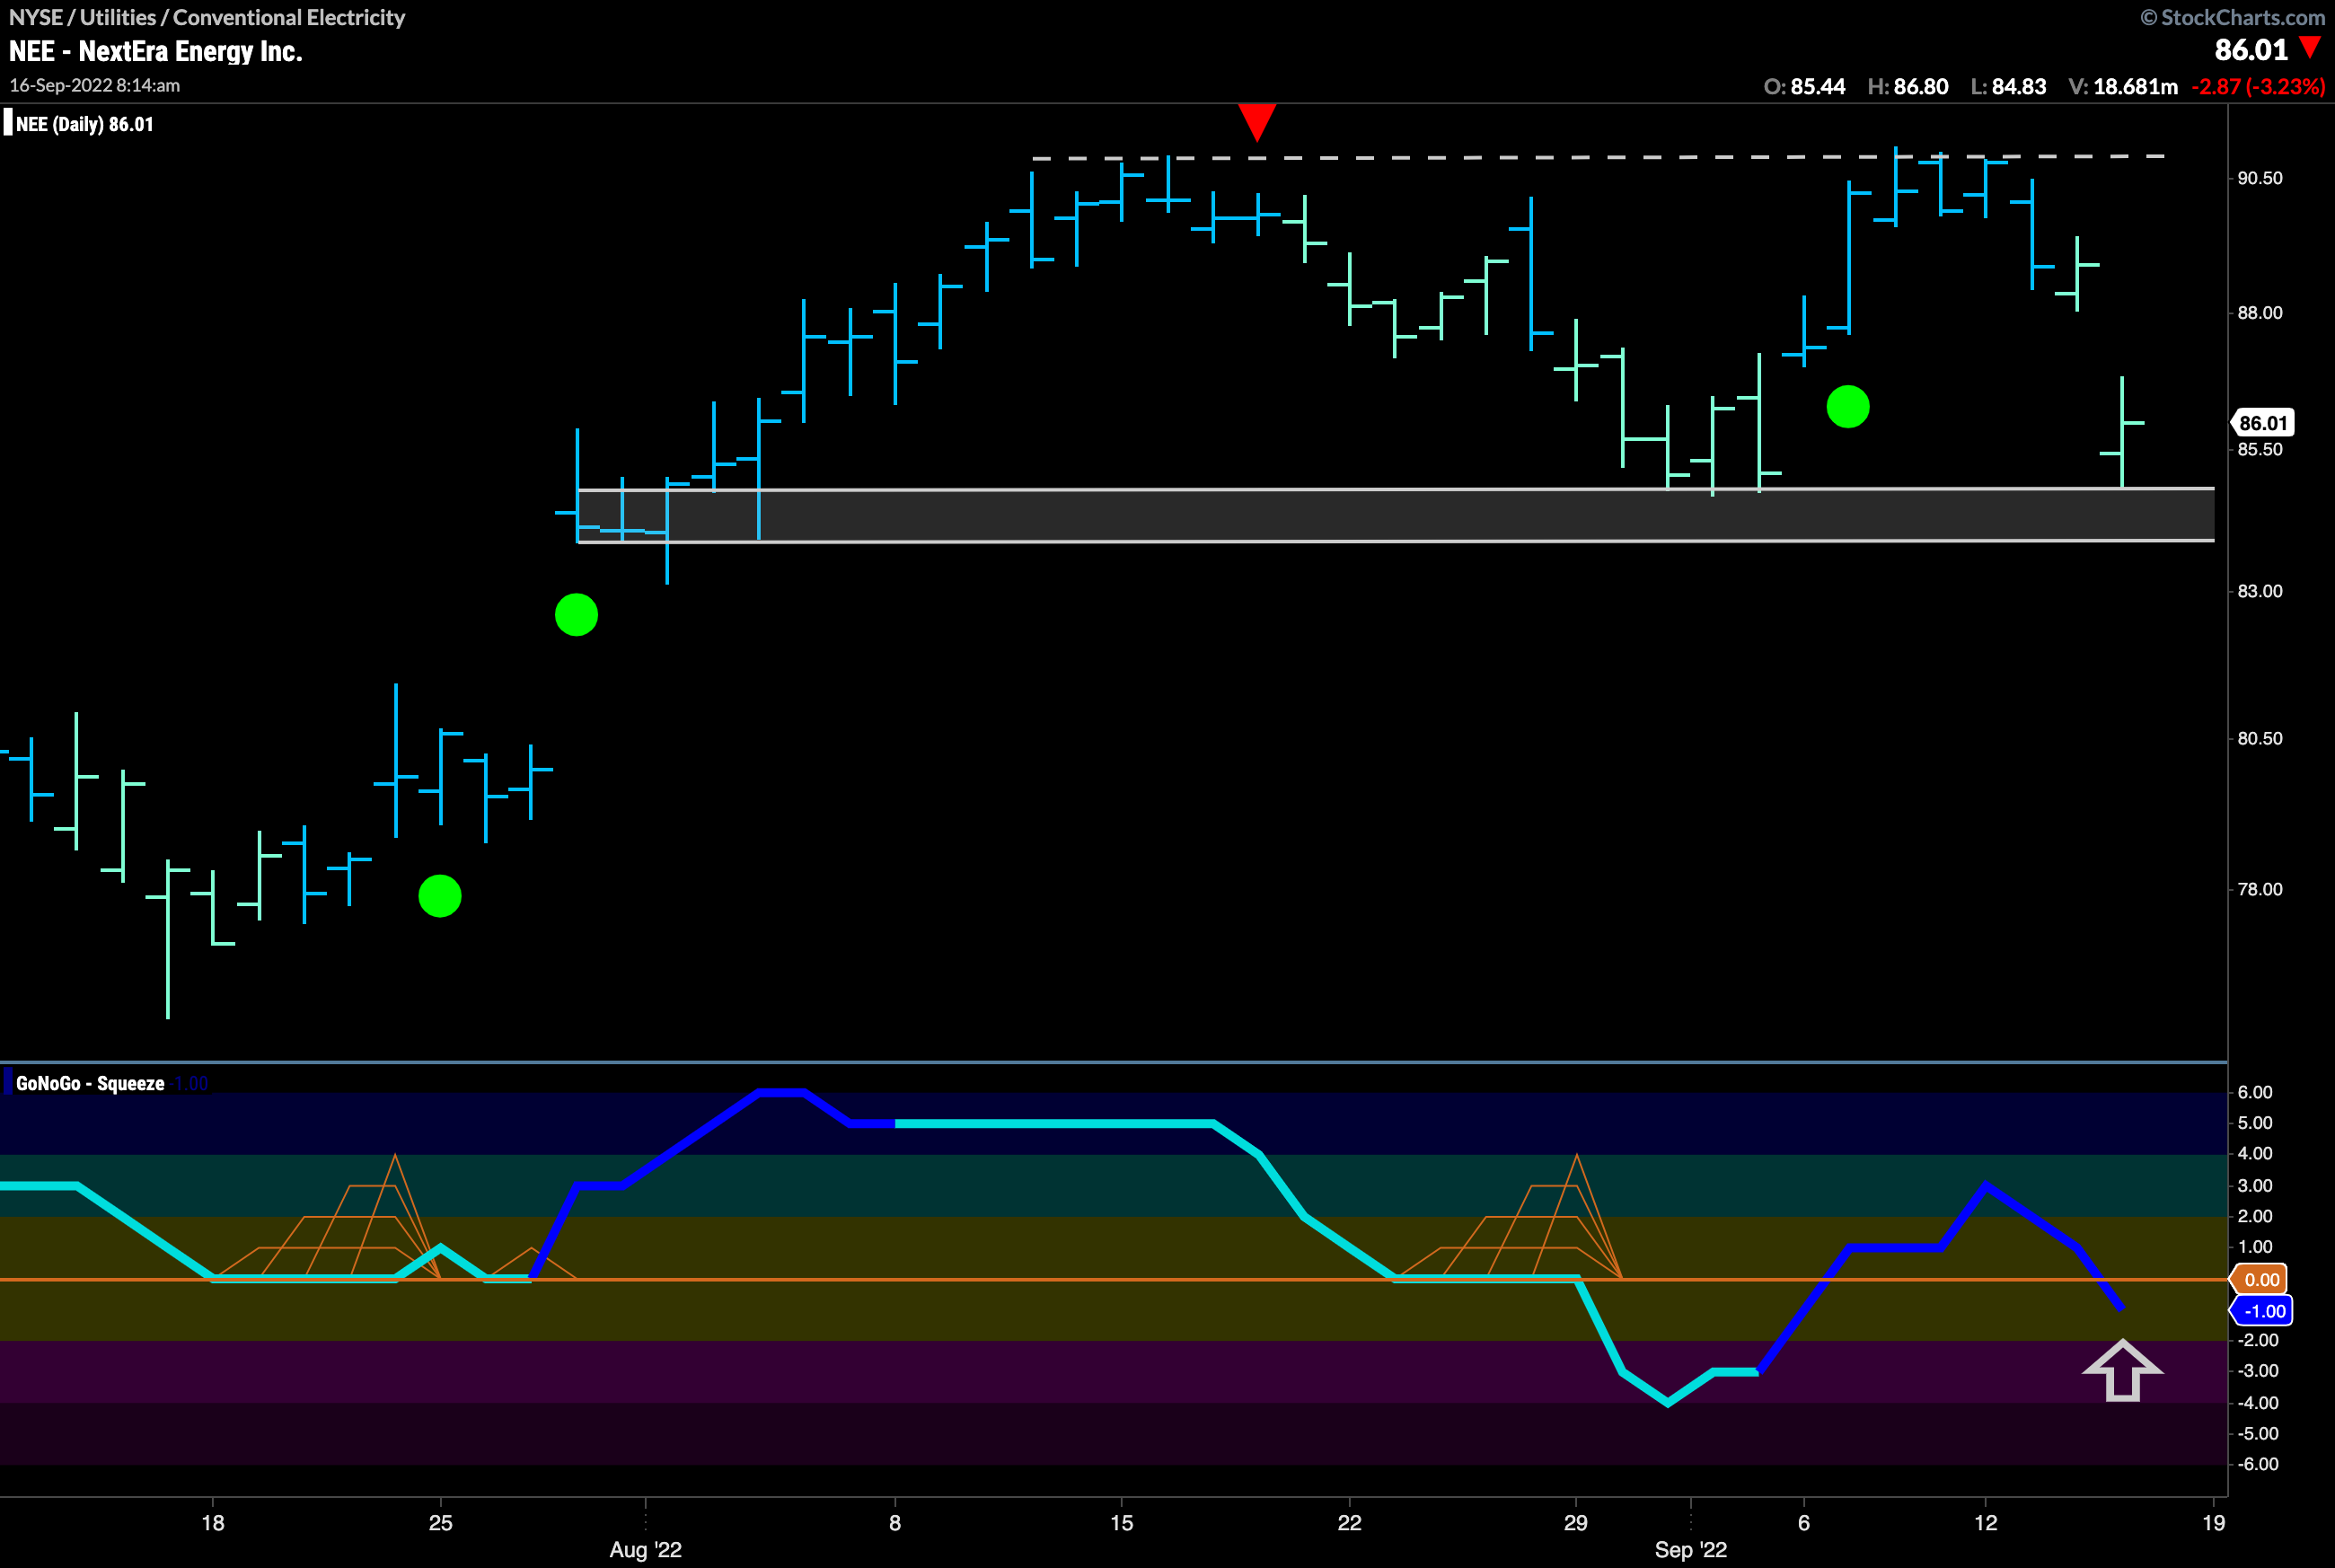

$NEE, Nextera Energy, is in a “Go” trend but has been moving in a sideways channel.
We have seen that on a relative basis, the utilities sector is outperforming the larger index. This chart is of $NEE, an example of a company within the sector in a “Go” trend. The bottom of the channel is at the support from the top of a gap up in price from the end of July. In an effort to take advantage of the expected support and possible rally back to test channel highs, we could step down in time frame and wait for a fresh “Go”, or Go Continuation on a lower time frame chart. On the daily chart, we would look for the GoNoGo Oscillator to quickly regain positive territory in order for the “Go” trend to remain healthy.


