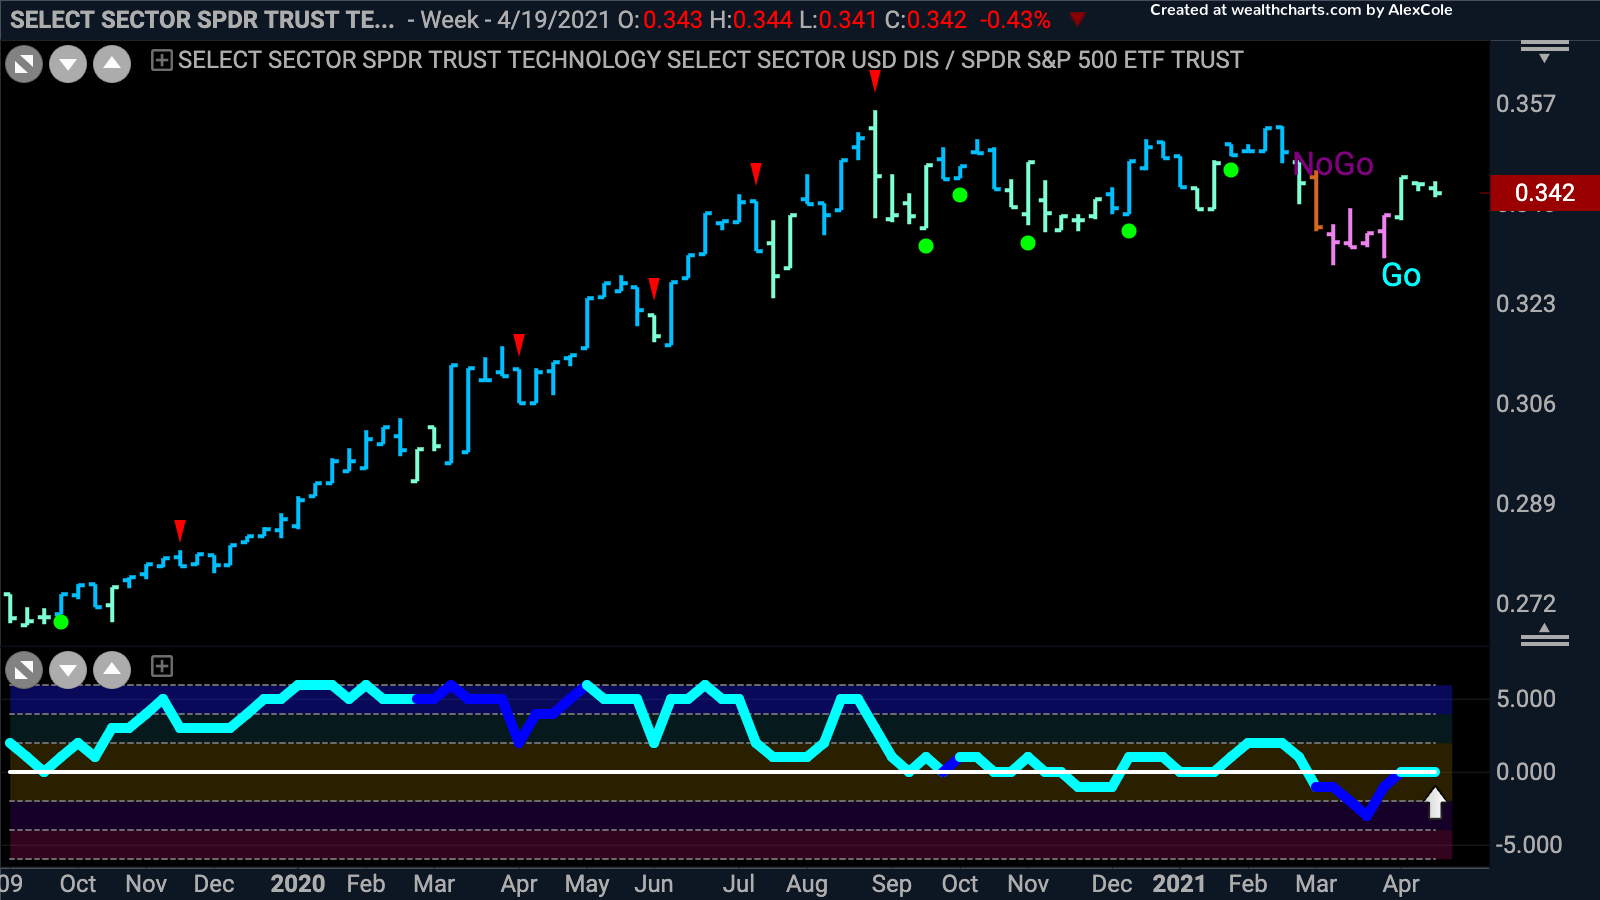
We saw some rotation away from mega cap technology stocks as smaller value and more defensive stocks showed leadership in the last few months.
However, the weekly GoNoGo chart of the ratio of the technology sector to the base S&P 500 shows that once again technology is back in favor and in a longer term “Go” trend. Using ratio charts let’s us look at the relative strength of securities and applying the GoNoGo chart indicators to the ratio can be very telling. Having struggled around the zero line as this ratio’s price saw consolidation since the end of last year, the GoNoGo Oscillator is now back at zero. We will look to see if it can break back above into positive territory to confirm the “Go” trend in price.


