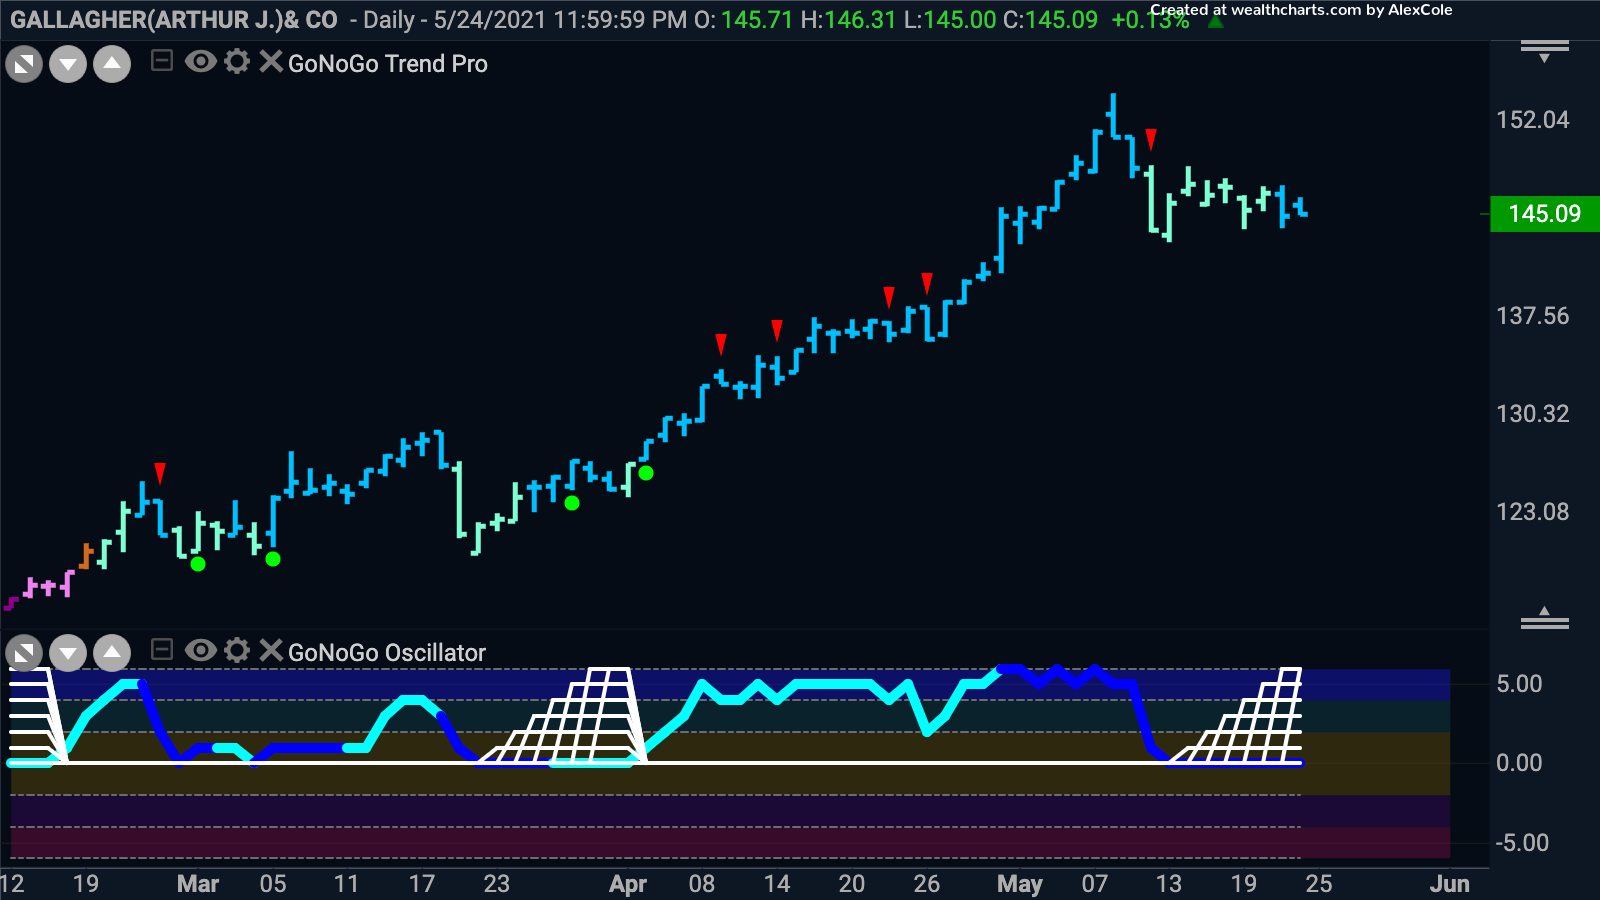

We know that the financials sector has been a relative out-performer over the past few months, so let’s look at $AJG, Gallagher(Arthur J.) & Co, an insurance brokerage, to see if there may be an opportunity to participate in the larger trend.
The GoNoGo Chart below shows daily prices and we can see that the “Go” trend is well established but has pulled back as investors digest the move. In the lower panel we can see that the sideways correction has caused the GoNoGo Oscillator to fall to the zero line and stay there which in turn has triggered a max GoNoGo Squeeze. We will watch to see if the oscillator can break out of the squeeze to the upside, as we’d expect if the trend is healthy. If it does, then we’d see a Go trend continuation icon (green circle) appear under the price bar suggesting that momentum has come back in the direction of the trend. This would allow us to target those prior highs.


