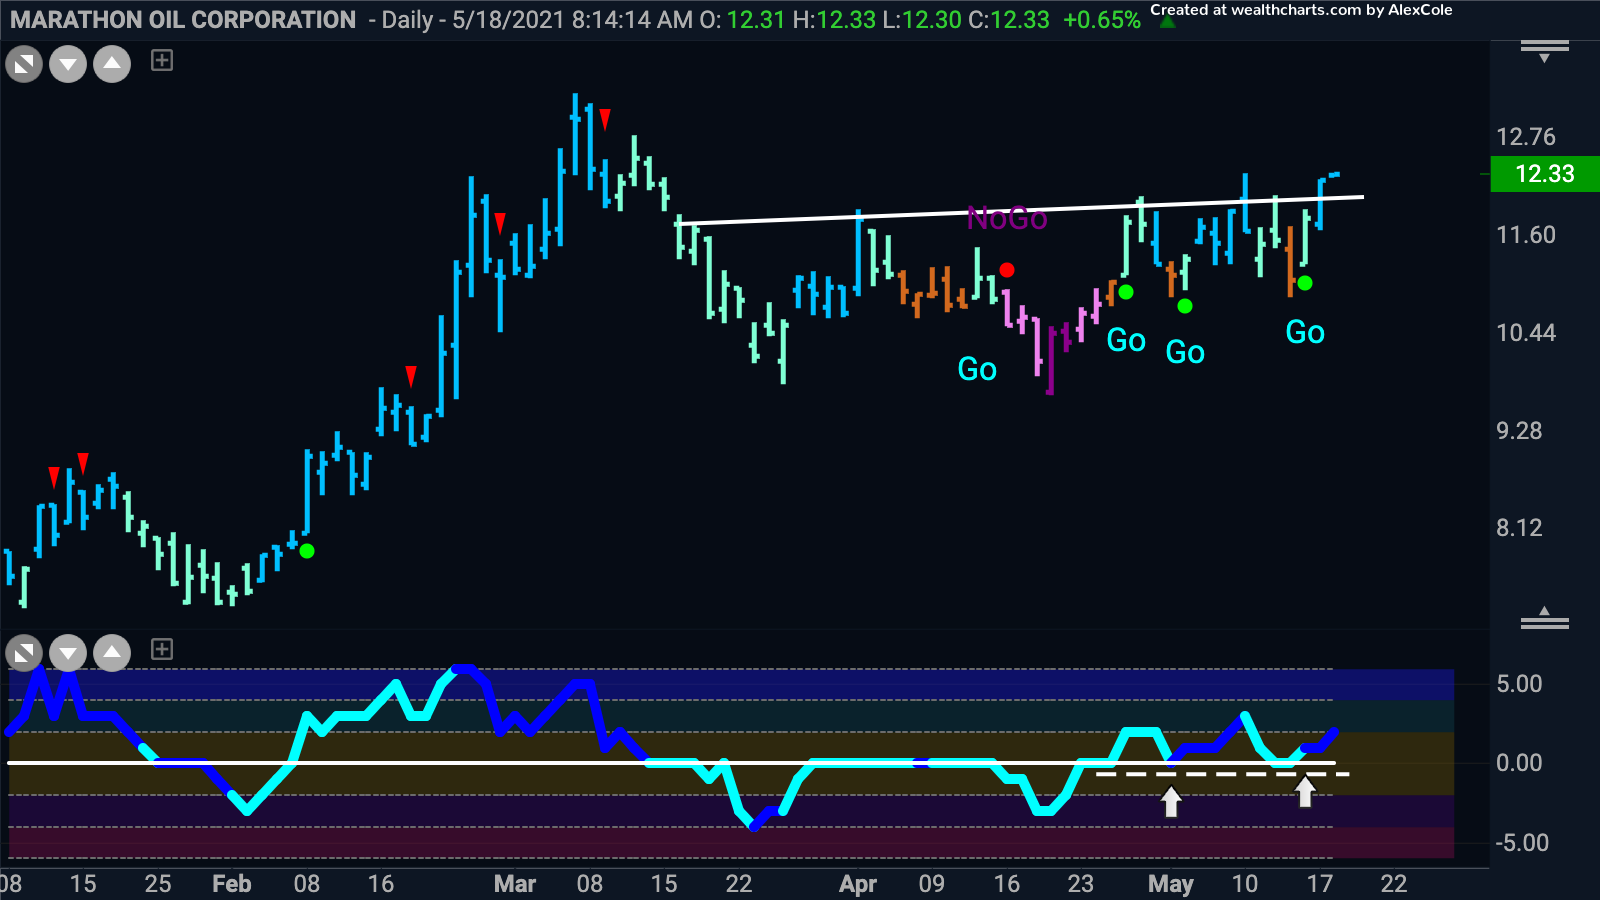
Oil has been a leader in the commodity space and the long term “Go” trend is still in place. Let’s look at Marathon Oil’s daily GoNoGo Chart.
After choppy price action, we see a “Go” trend trying to get established. As this is happening, price is right at resistance levels from the consolidation that it has been in. What we like to see is that the trend start to change during the right side of the pattern, and this is the case here, with the Go colors dominating to the right side. Underneath, in the GoNoGo Oscillator panel, we see that it has broken above zero about half way through the pattern and is now finding support above that level. This is also a positive sign when we see this during the right side of a consolidation pattern. If price can consolidate here we could look for an initial target at prior highs above $13.


