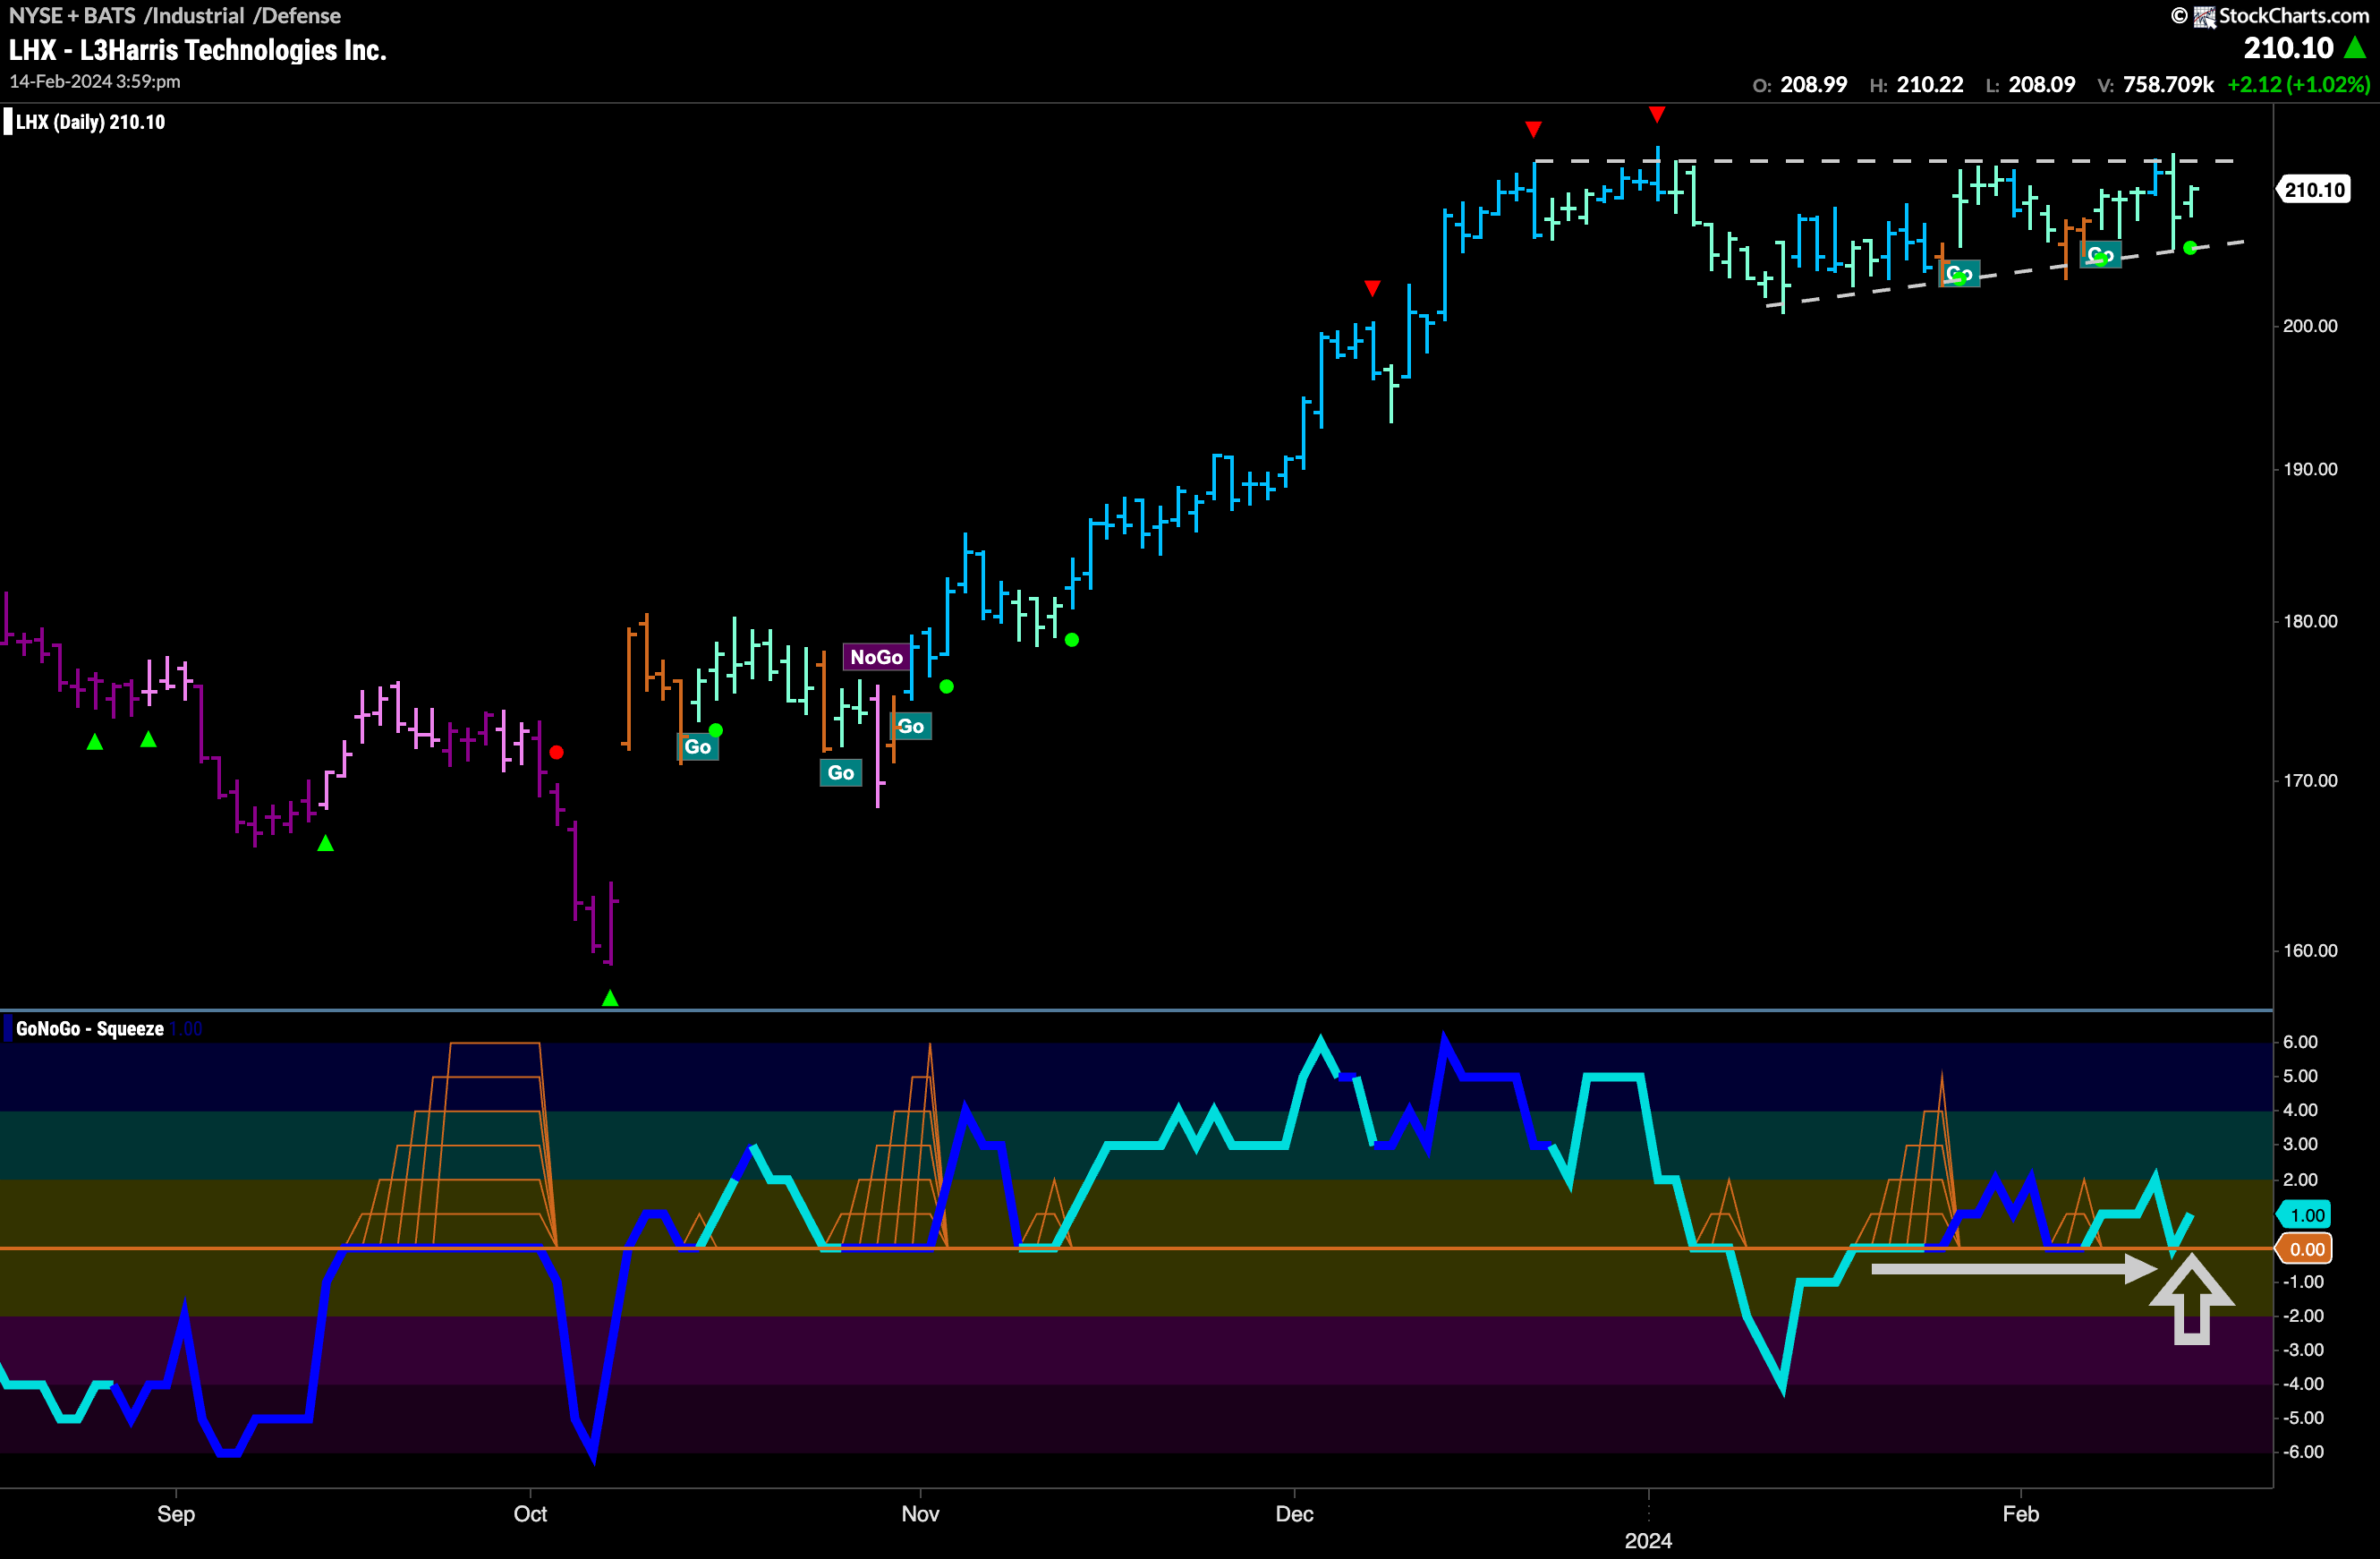

$LHX has been moving mostly sideways for several weeks.
Having been in a “Go” trend since October of last year, $LHX hit highs in December and early January. We saw multiple Go Countertrend Correction Icons (red arrows) that suggested price may struggle to go higher in the short term. Since then, we have seen seller hold firm at what looks like an upper bound of an ascending triangle. Buyers have been more aggressive, bringing the lows higher and GoNoGo Oscillator has been finding support at the zero line during the second half of the pattern. As price rises to once more test the overhead resistance of the triangle pattern, GoNoGo Oscillator has bounced off the zero line again, causing another Go Trend Continuation Icon (green circle) to appear under the price bar. With momentum resurgent in the direction of the “Go” trend, we will look to see if that gives price the push it needs to break to new higher highs.


