
There has been a lot of talk this week about the the relief rally we are seeing in equities.
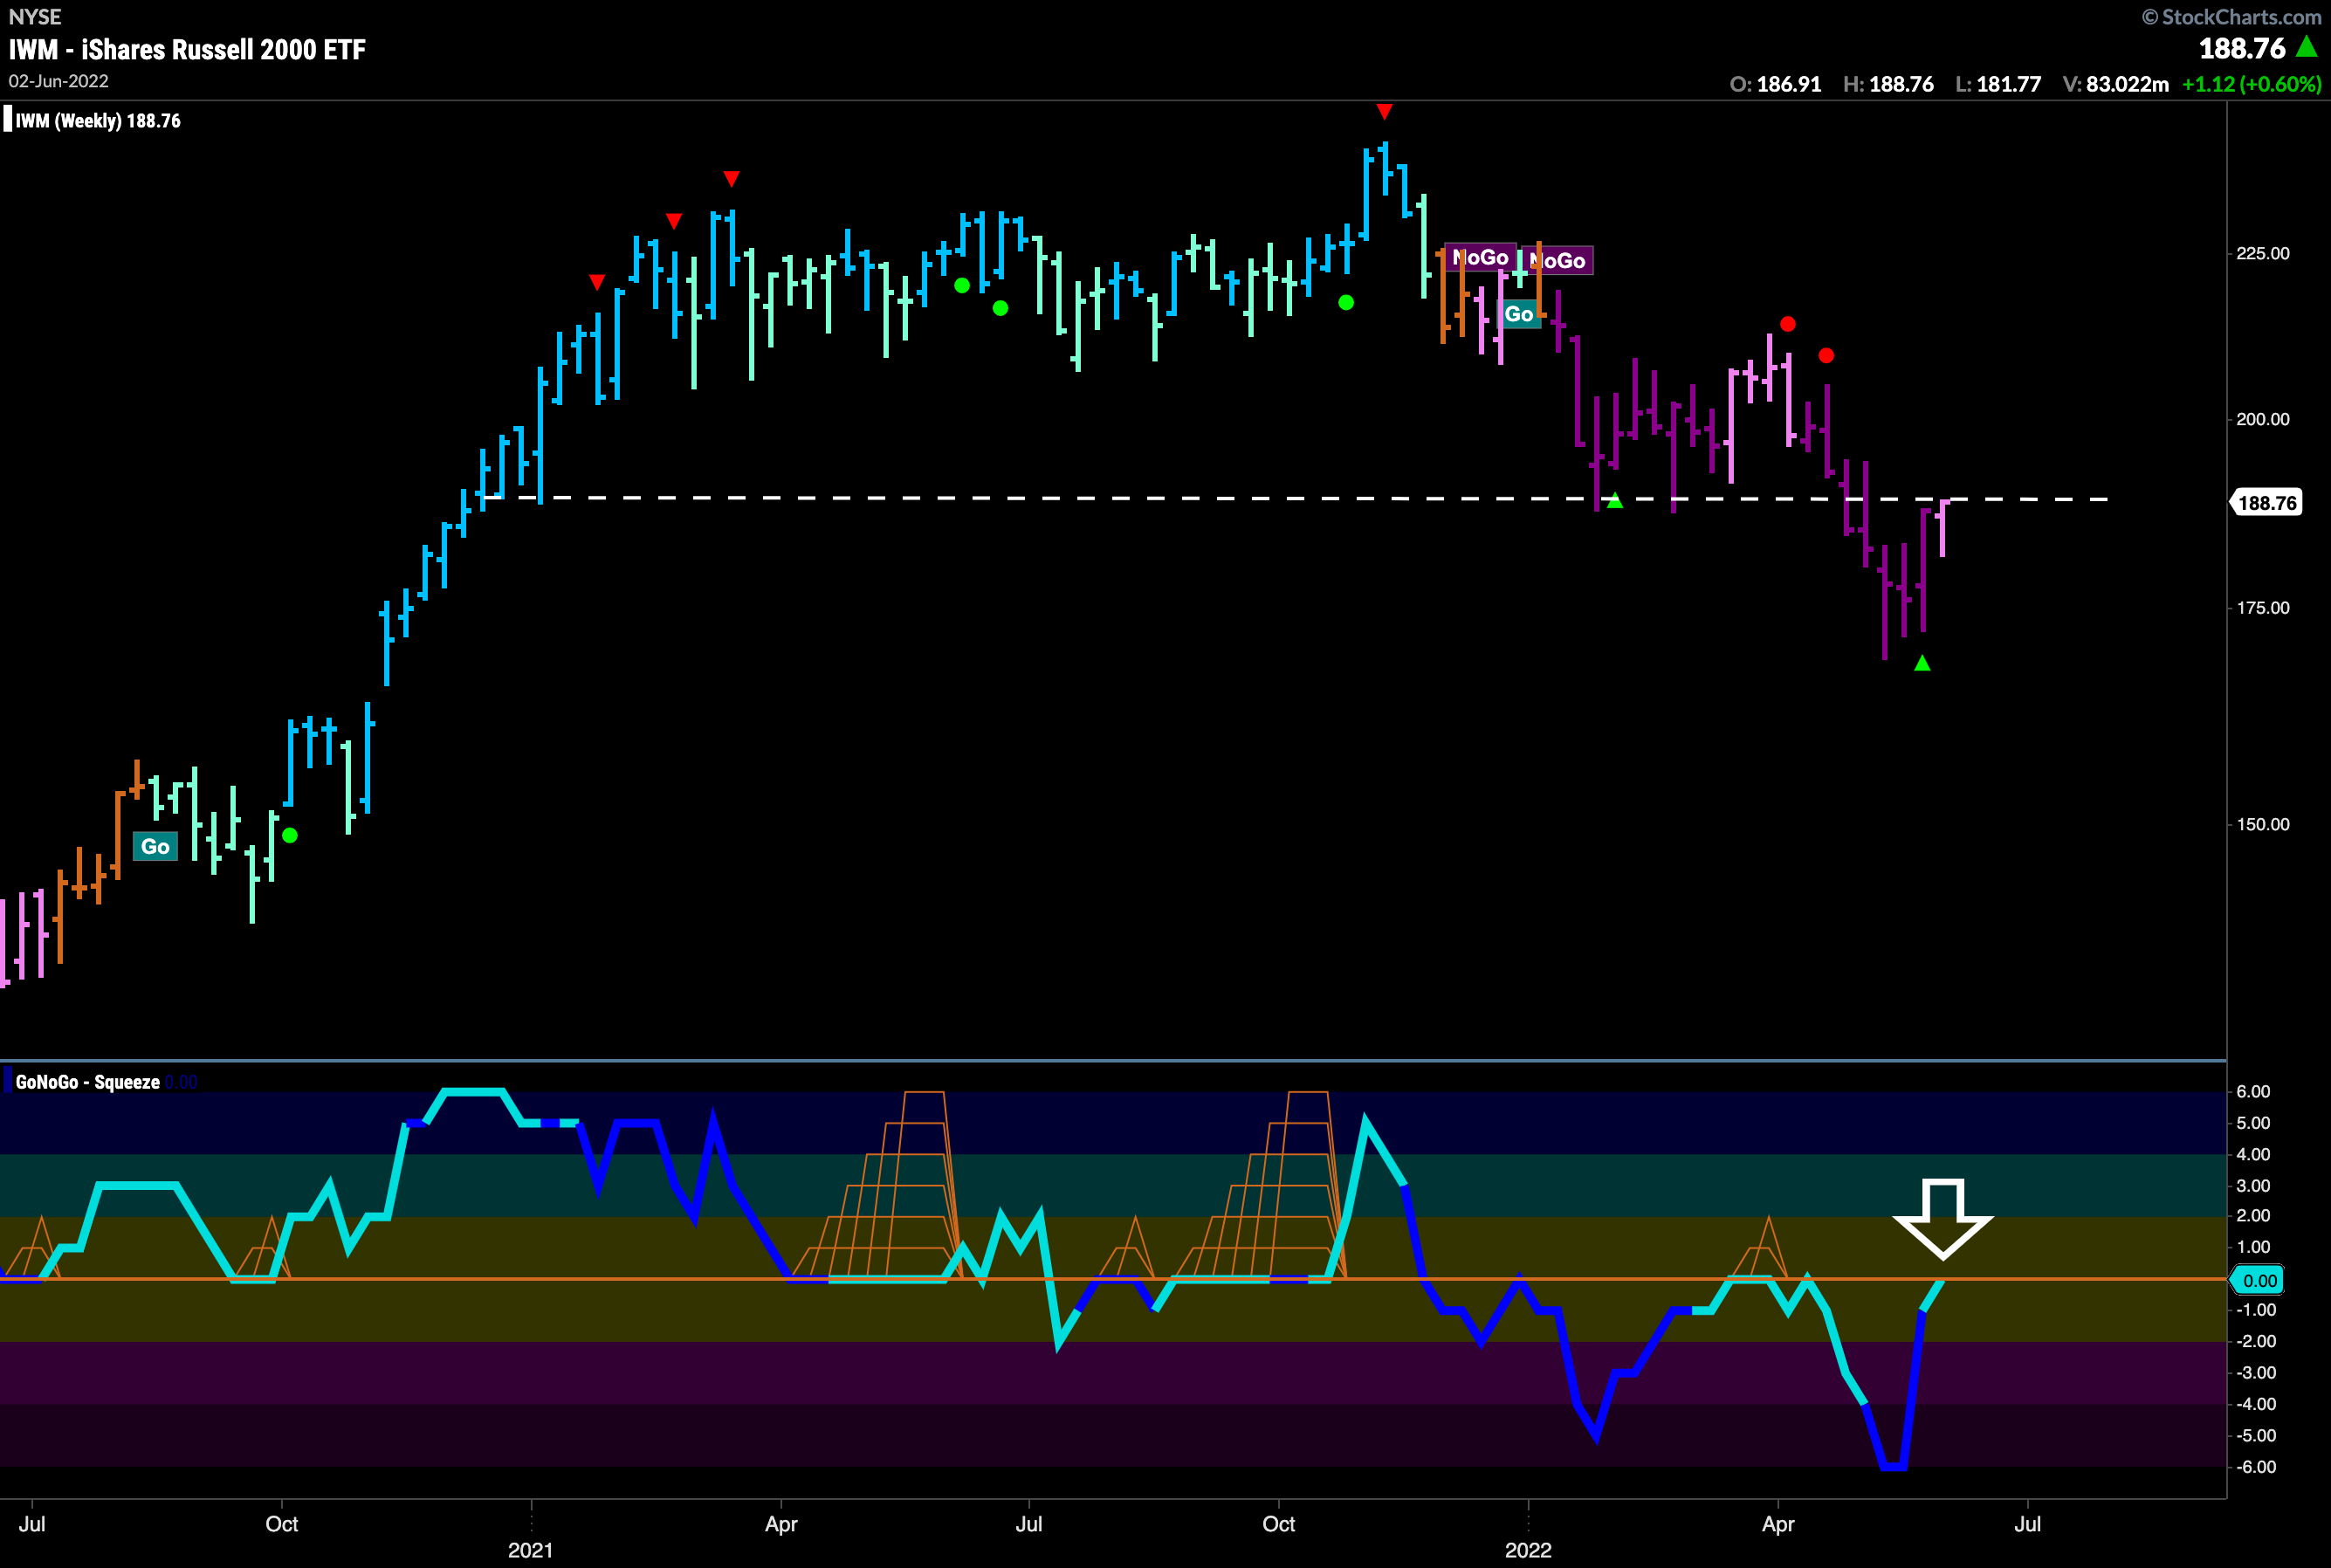
Let’s zoom out to the weekly chart and look at $IWM. You can see that GoNoGo Trend is painting strong purple bars and this recent run higher has put price up against resistance. GoNoGo Oscillator is testing the zero line from below which we know should provide resistance if the trend is healthy. Until proven otherwise, this looks like a retest within a “NoGo”. If GoNoGo Oscillator gets rejected by the zero line then we will see a NoGo Trend Continuation Icon (red circle) indicating that momentum is returning in the direction of the “NoGo” trend and can expect another leg lower.


