
Is there enough to suggest a rally in $SPY?
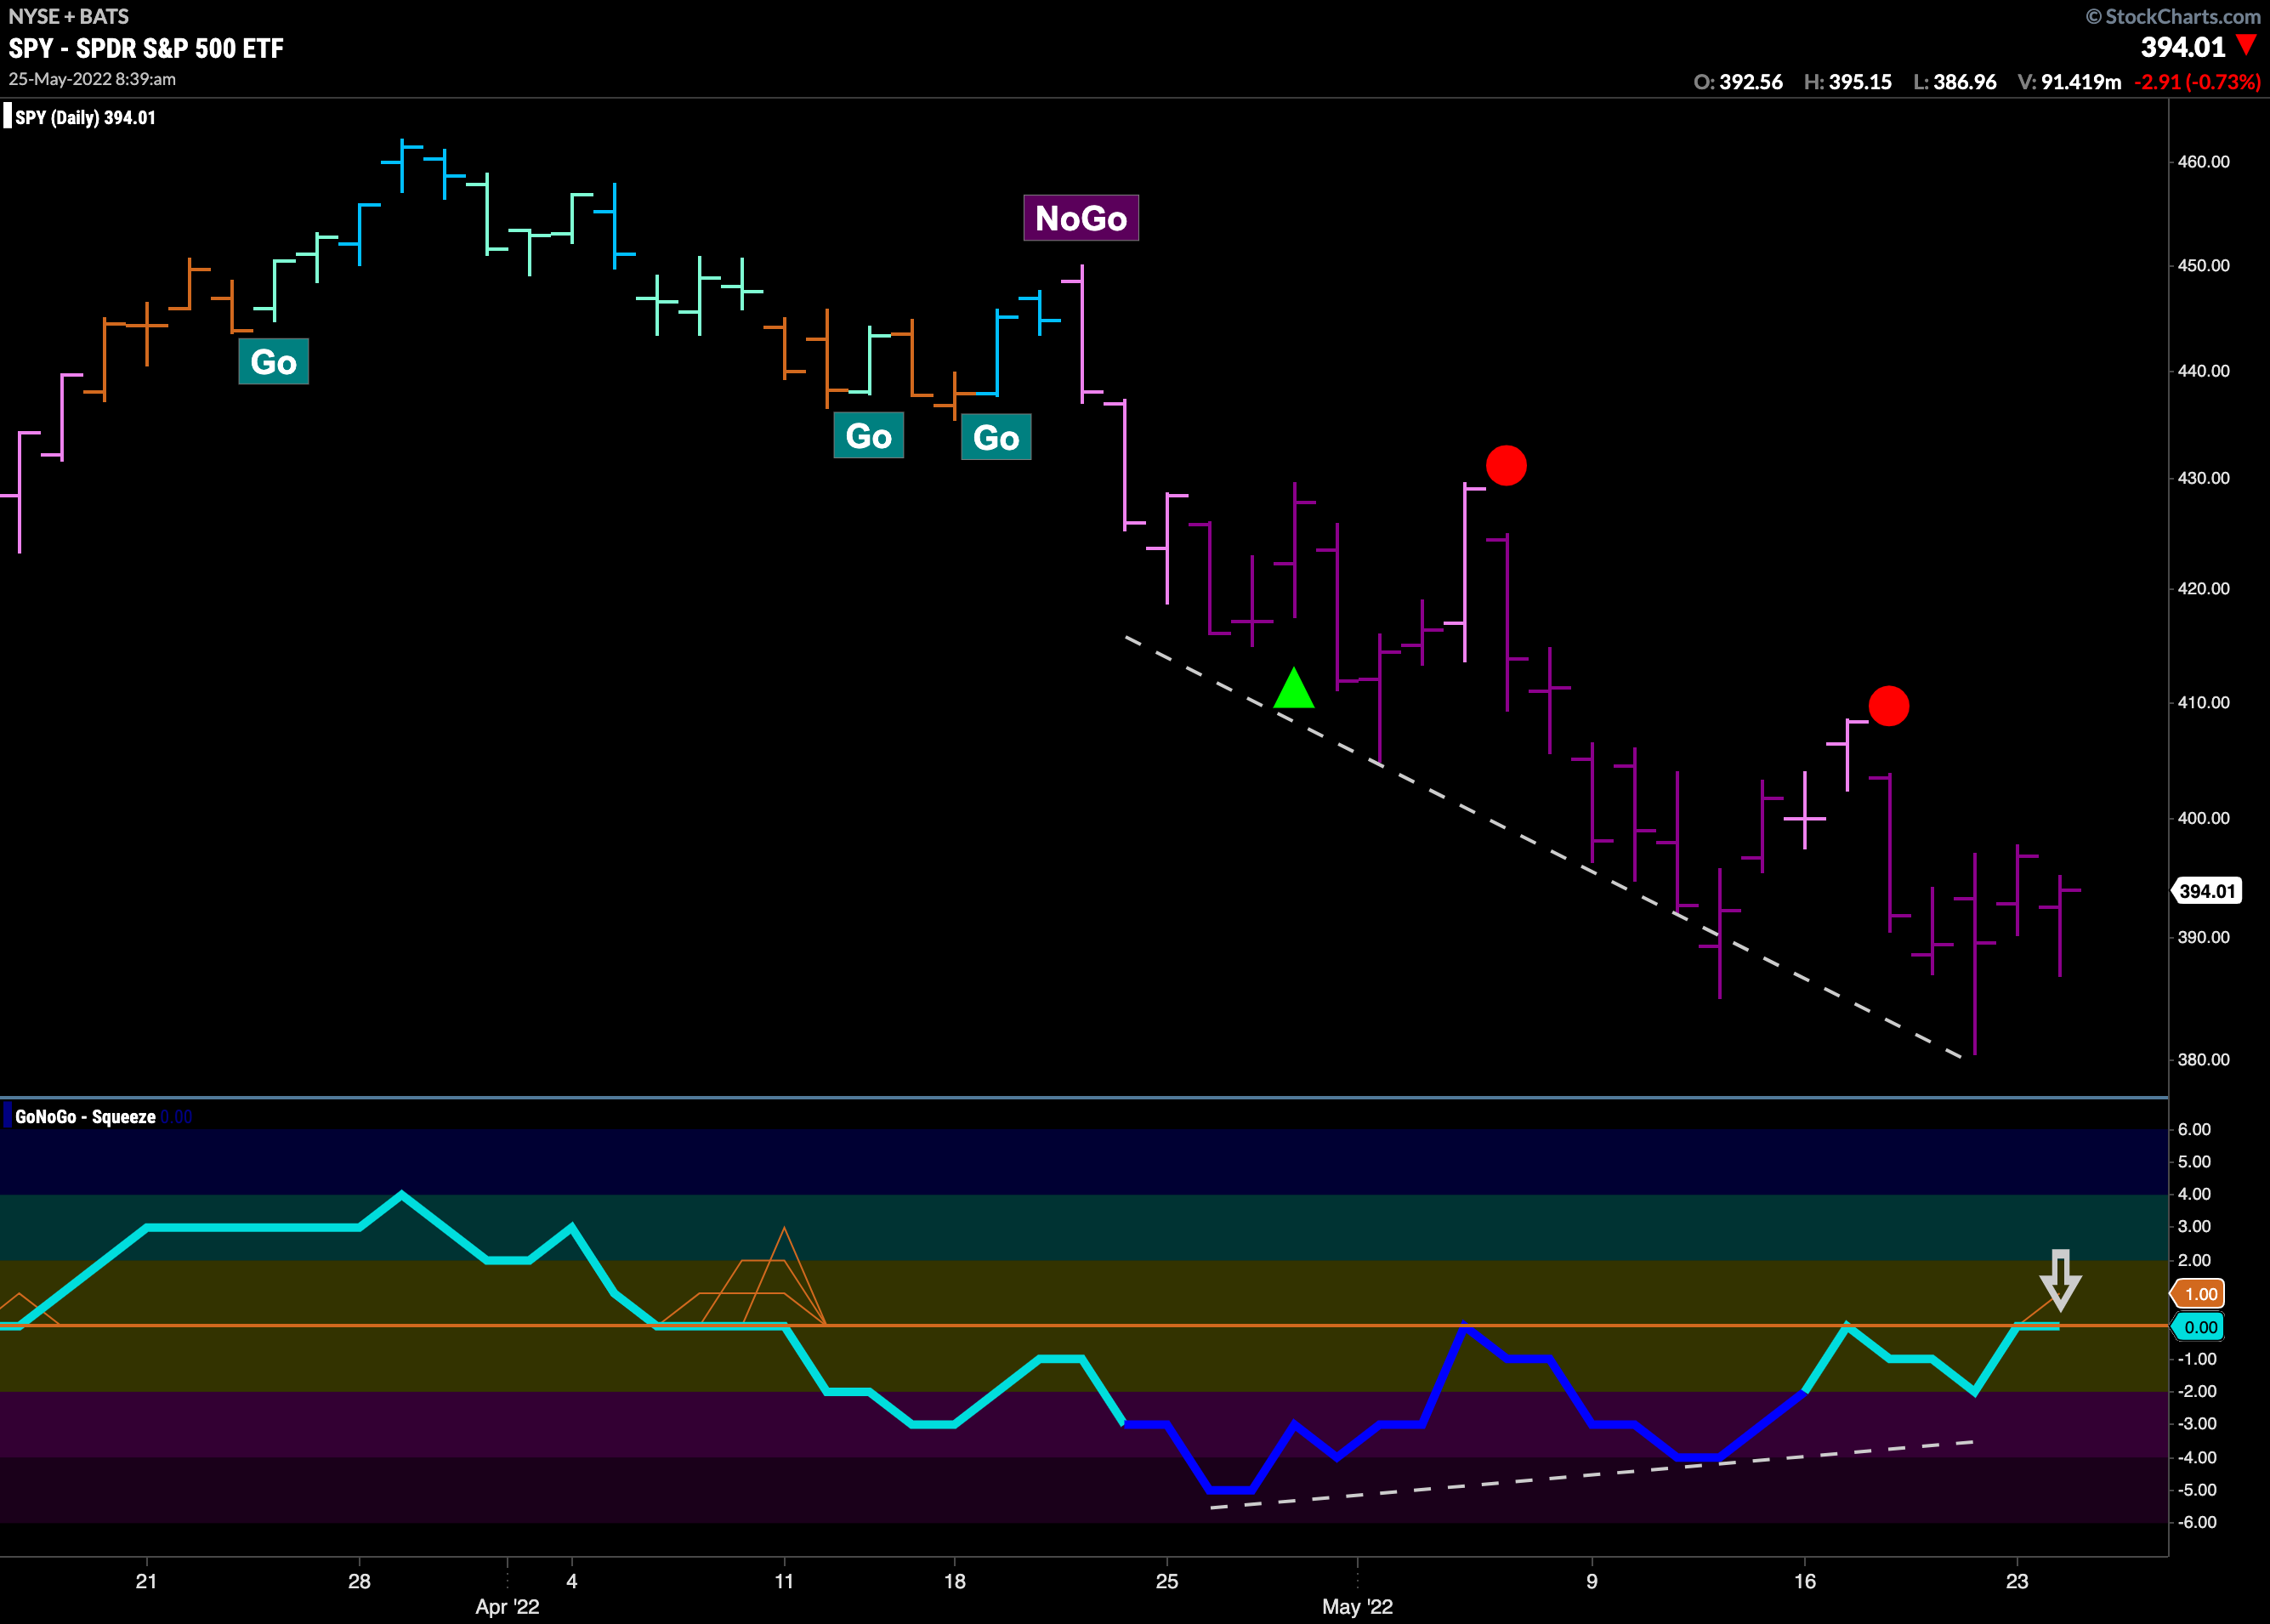
The GoNoGo Chart of the $SPY using daily prices shows that the trend is a strong “NoGo”. The weight of the evidence tells us this. Having said that, we are watching GoNoGo Oscillator closely as it will give us clues when the technical environment is changing. As price has been making lower lows, the oscillator has been making higher lows. This is classic bullish divergence. Of course, we know that we can see divergence several times in strong trends. More importantly, we see that GoNoGo Oscillator is testing the zero line from below and we are in the beginning of a GoNoGo Squeeze. This lets us know that there is little directional momentum currently. We will see in which direction the oscillator moves next. If it resolves do to the downside, breaking out of the GoNoGo Squeeze into negative territory, then we will look for a new leg down in price. Should it break out of the Squeeze into positive territory, that would be a threat to the “NoGo” trend as we know GoNoGo Oscillator should find resistance at zero if the “NoGo” trend is strong.


