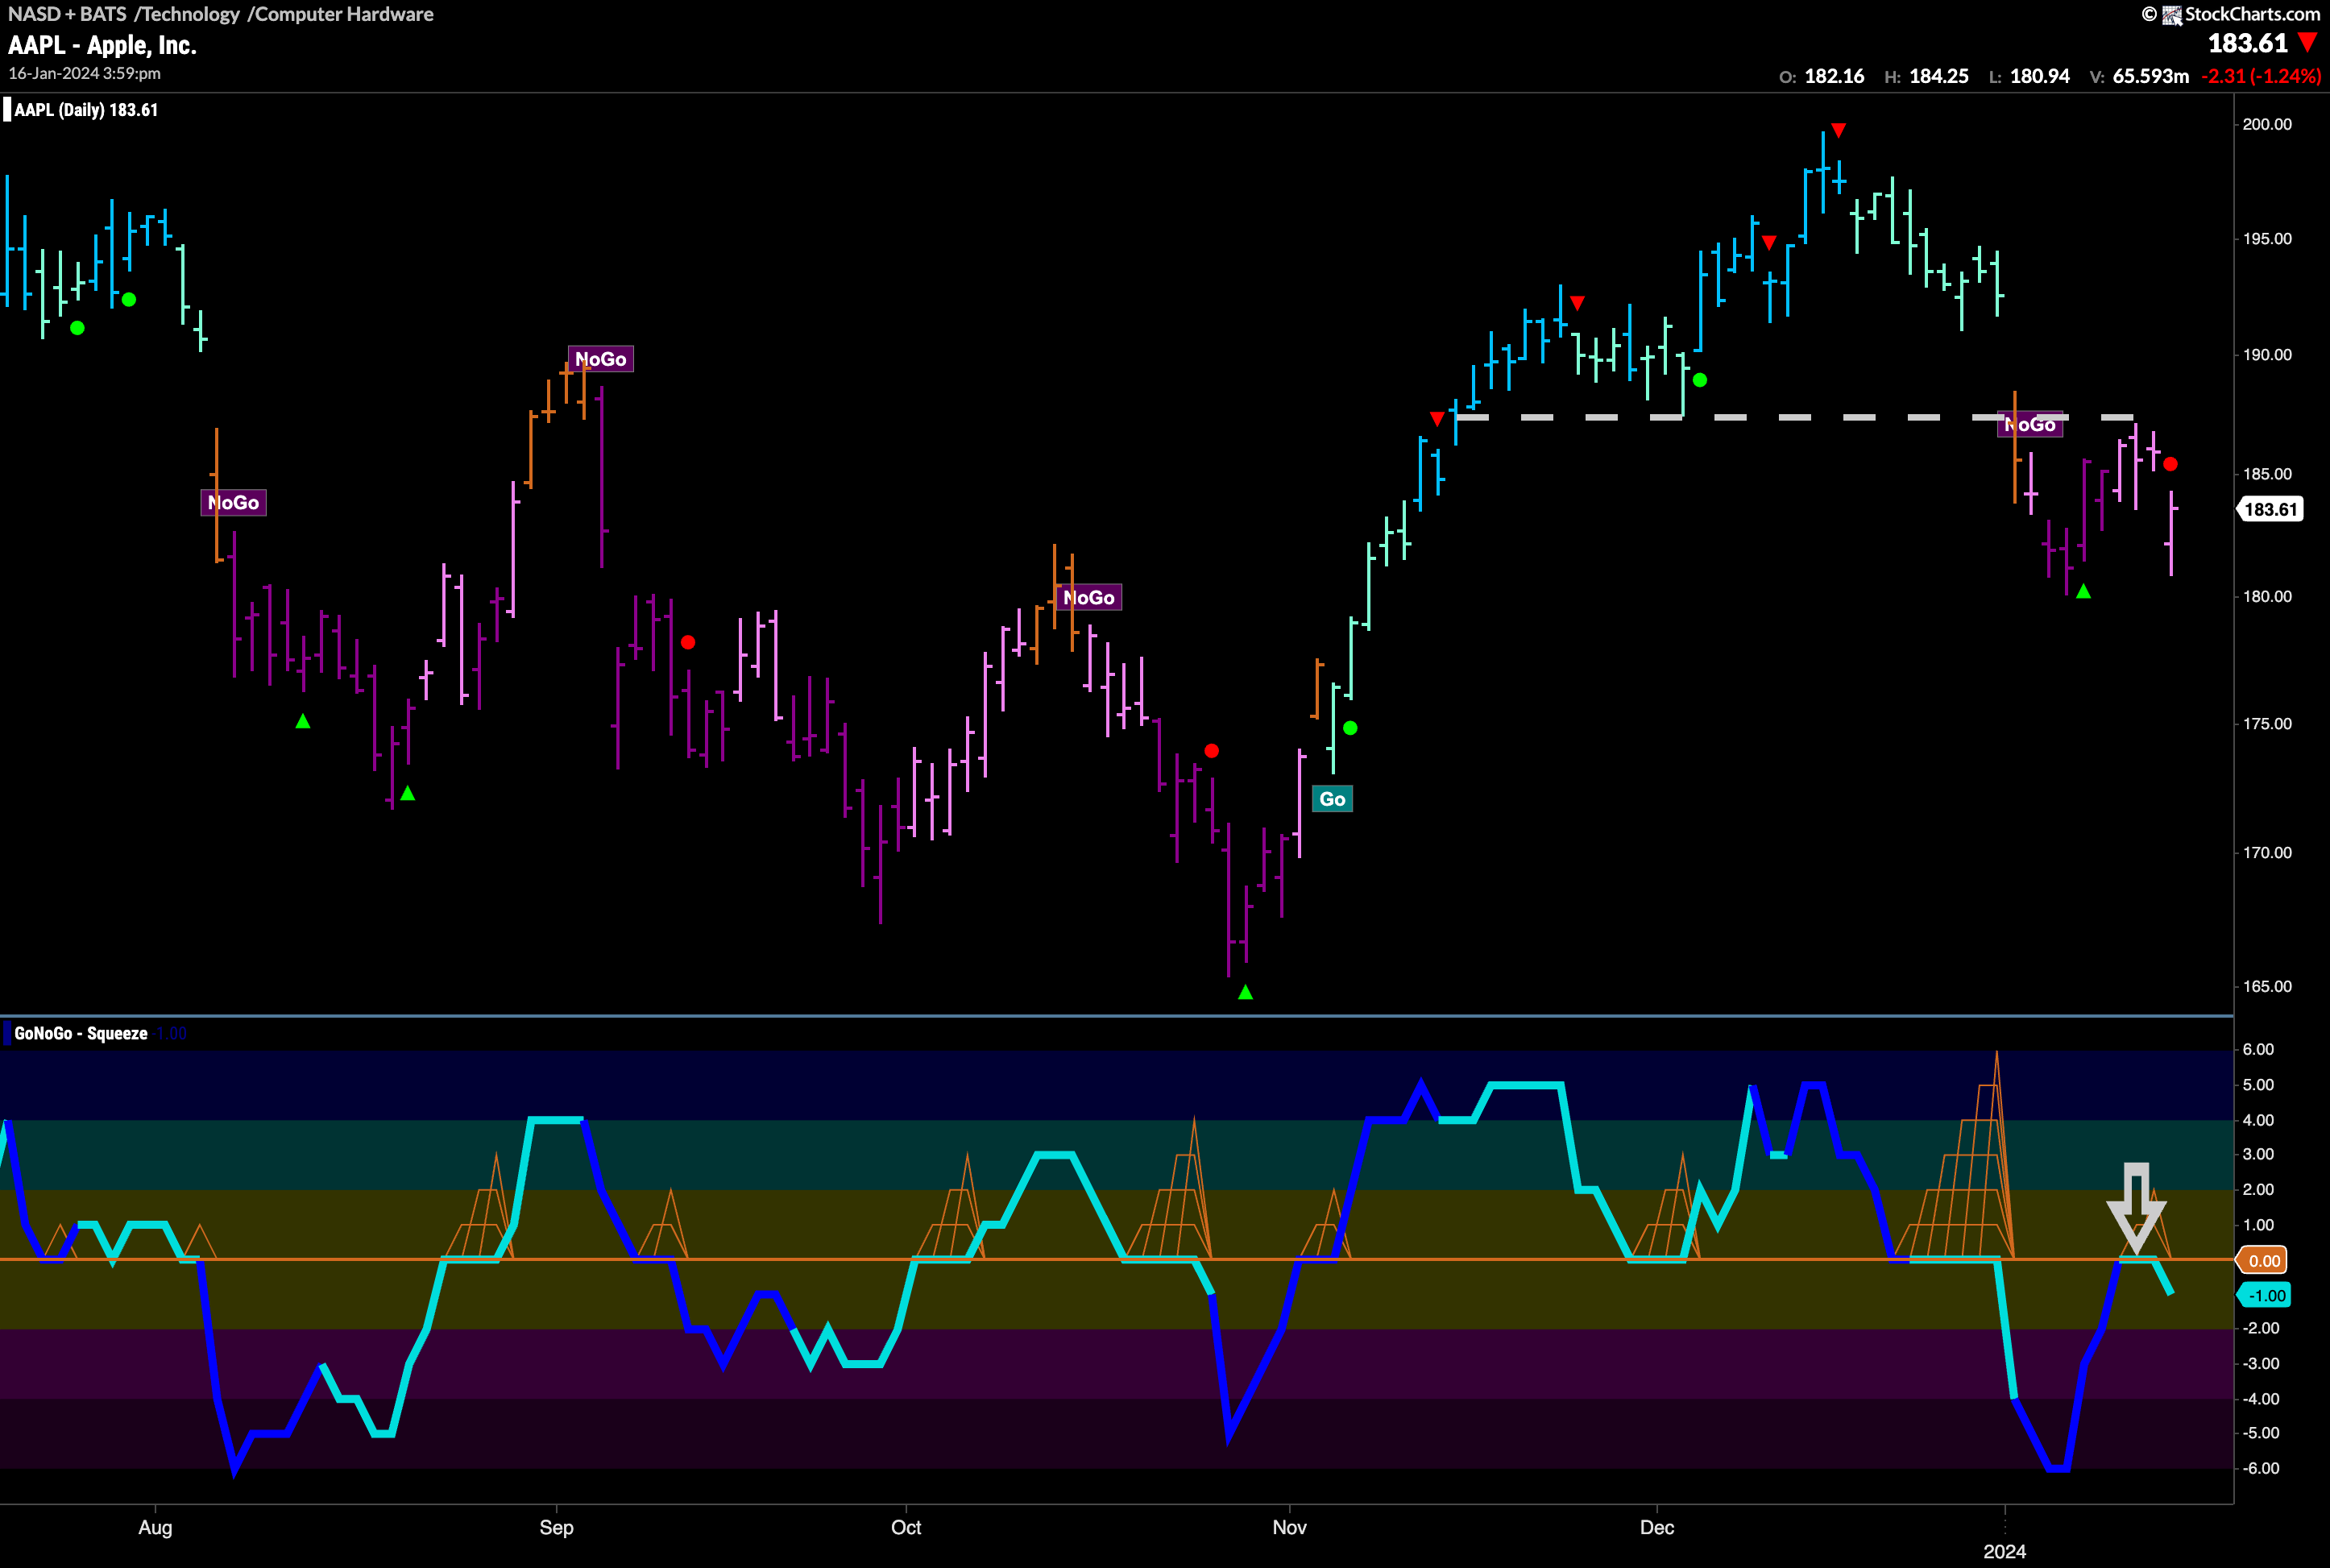

$AAPL has been in a “NoGo” since the beginning of the month of January.
It gapped down, breaking out of a Max GoNoGo Squeeze as it left a “Go” trend and painted an amber “Go Fish” bar before entering this current “NoGo”. Since then, it has rallied against the “NoGo” and we saw that signaled likely by the NoGo Countertrend Correction Icon (green arrow) at the low. As investors digested the move, price ran up against the horizontal resistance we see on the chart from the bottom of the gap and earlier support. We then turned our eye to the oscillator panel to see if it would be able to regain positive territory or if it would be turned away by the zero line. It was rejected at that level and we are given a NoGo Trend Continuation Icon (red circle) on the chart. This tells us there is more pressure to the downside and we will look for price to challenge for a new low.


