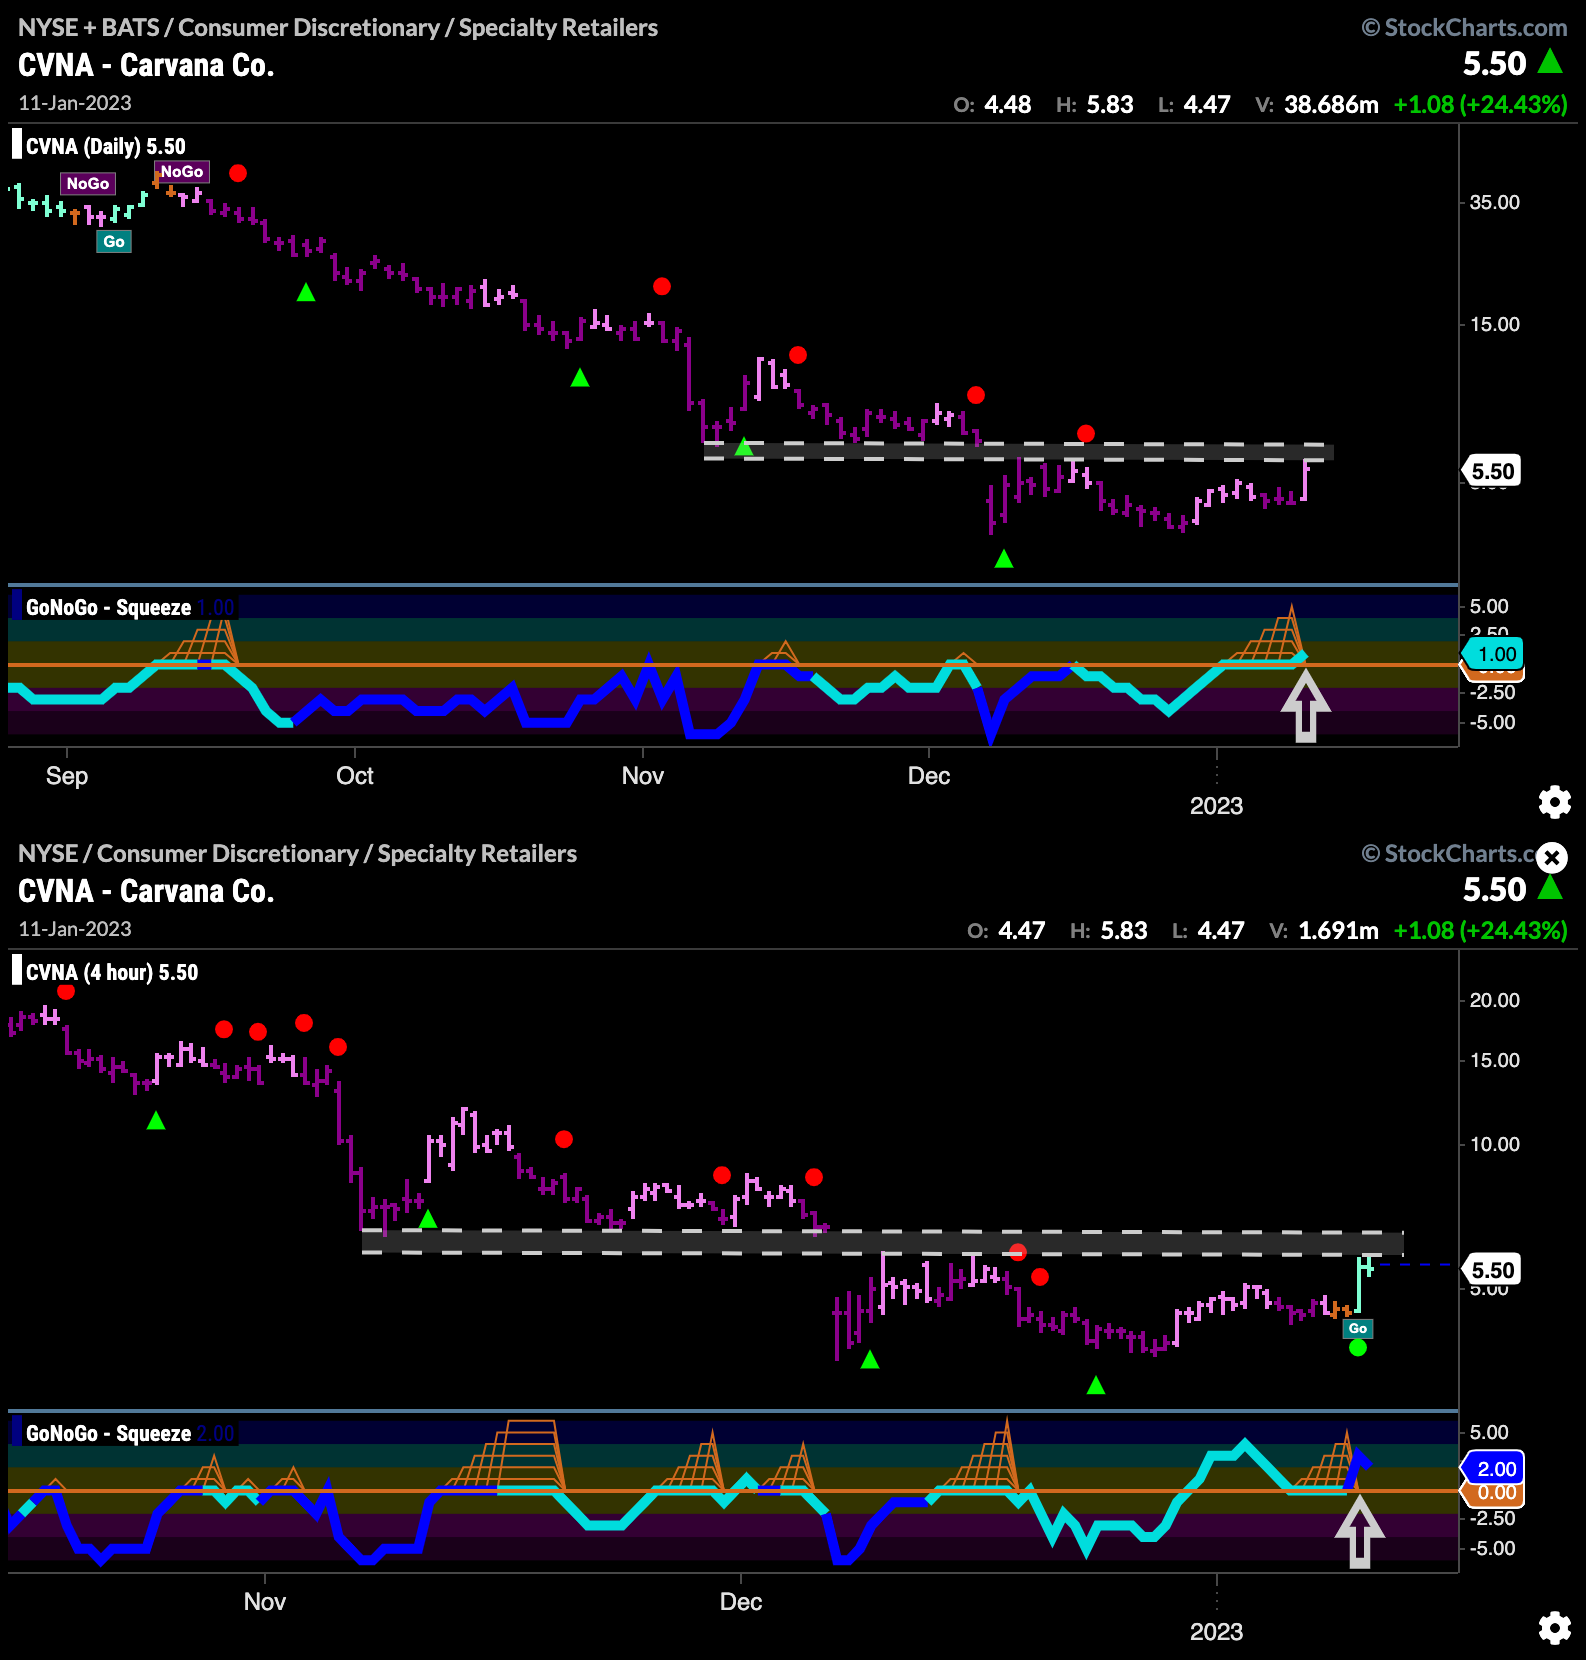
$CVNA has been in a long drawn out “NoGo” since September of last year.
We can see in the daily chart (top) that for the first time since that “NoGo” took hold, GoNoGo Oscillator has broken above the zero line. We know that when the “NoGo” trend is healthy, momentum should stay in the direction of the trend, and the oscillator will find resistance at the zero line. This move into positive territory coincides with price testing resistance from the gap. If we move down a time frame, (bottom, 4hr) we can see that this movement in price has been enough for GoNoGo Trend to paint aqua “Go” bars. GoNoGo Oscillator has also retested the zero level and found support. We will watch to see if the daily chart can follow and confirm. If it takes out resistance from the gap we will likely see GoNoGo Trend change in the price panel above.


