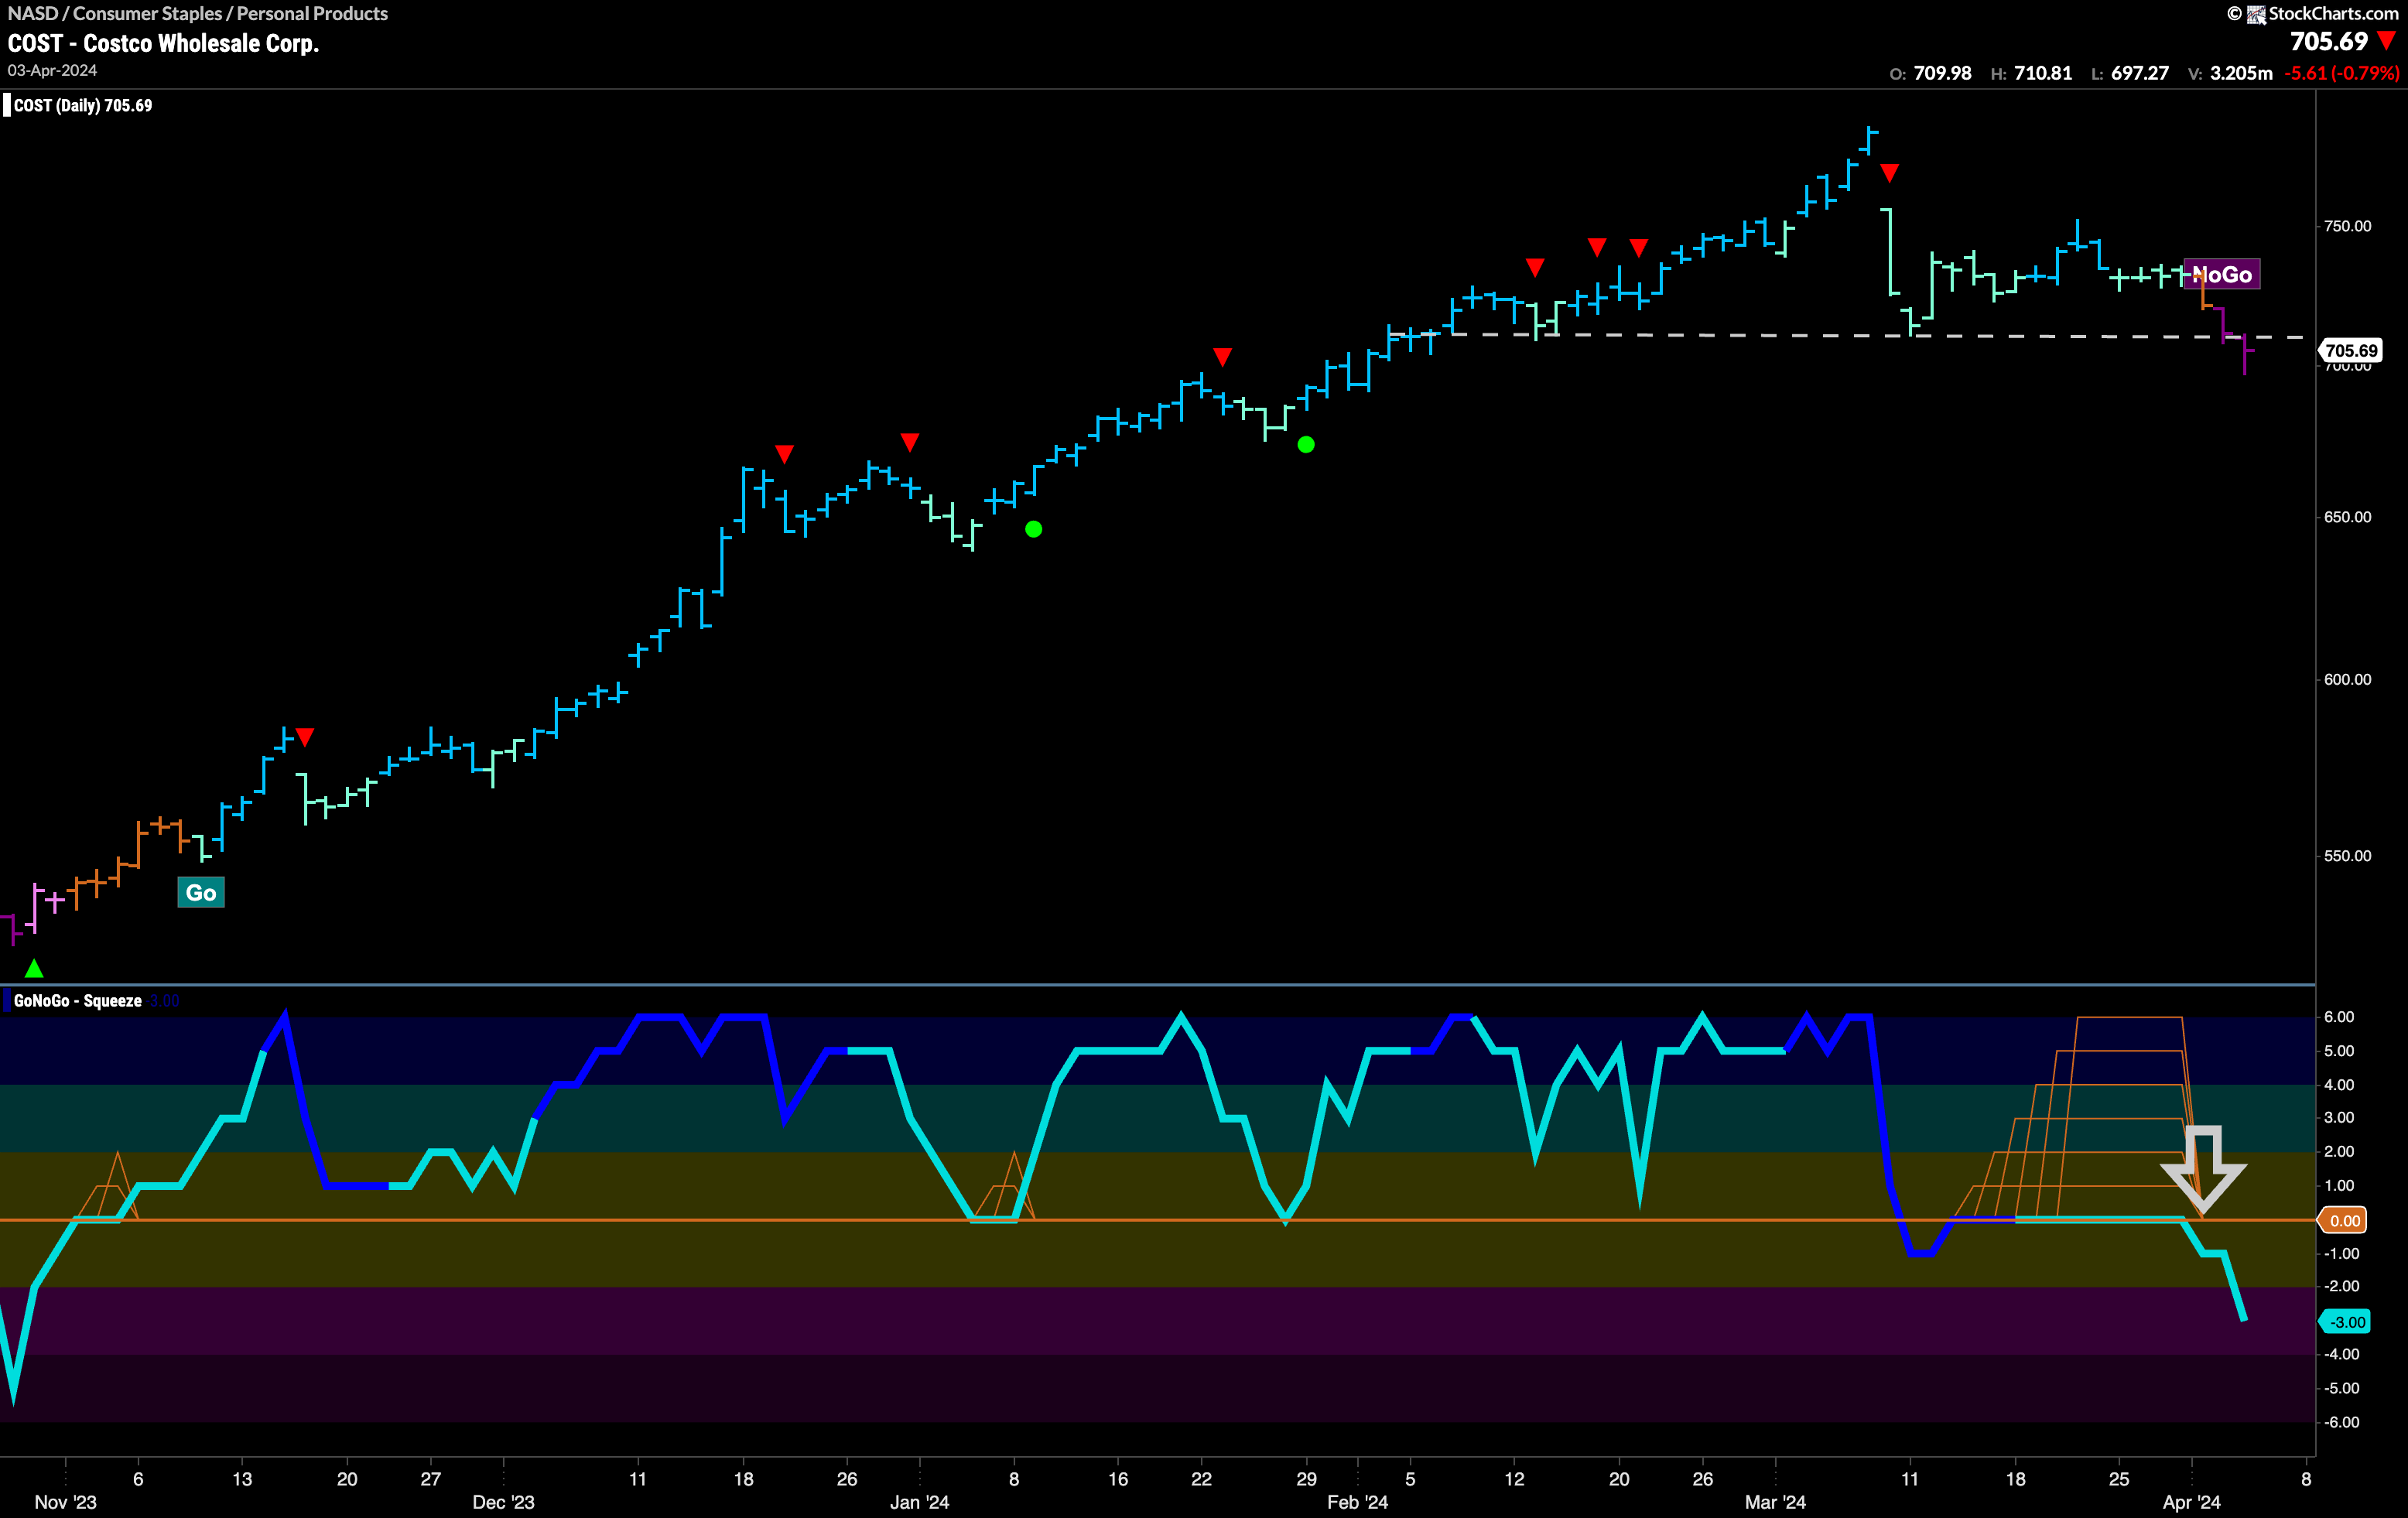
$COST was in a “Go” trend from last November to just a few days ago.
However, after it rose to another new high on March 7th, we saw a Go Countertrend Correction Icon (red arrow) indicating that price would likely struggle to go higher in the short term due to waning momentum. GoNoGo Trend then painted a majority of weaker aqua “Go” bars as price did indeed move mostly sideways. GoNoGo Oscillator fell to test the zero line from above but then remained at that level and we saw a Max GoNoGo Squeeze as there was little directional momentum and a fight between buyers and sellers. As GoNoGo Oscillator broke out of the Max GoNoGo Squeeze into negative territory, GoNoGo Trend painted an amber bar of uncertainty. The market made up its mind the very next bar with a first strong purple “NoGo”. Now, with GoNoGo Trend painting a second strong “NoGo” bar as price falls below potential support, and momentum surging in the direction of the “NoGo” trend, we will look for price to fall further from here.


