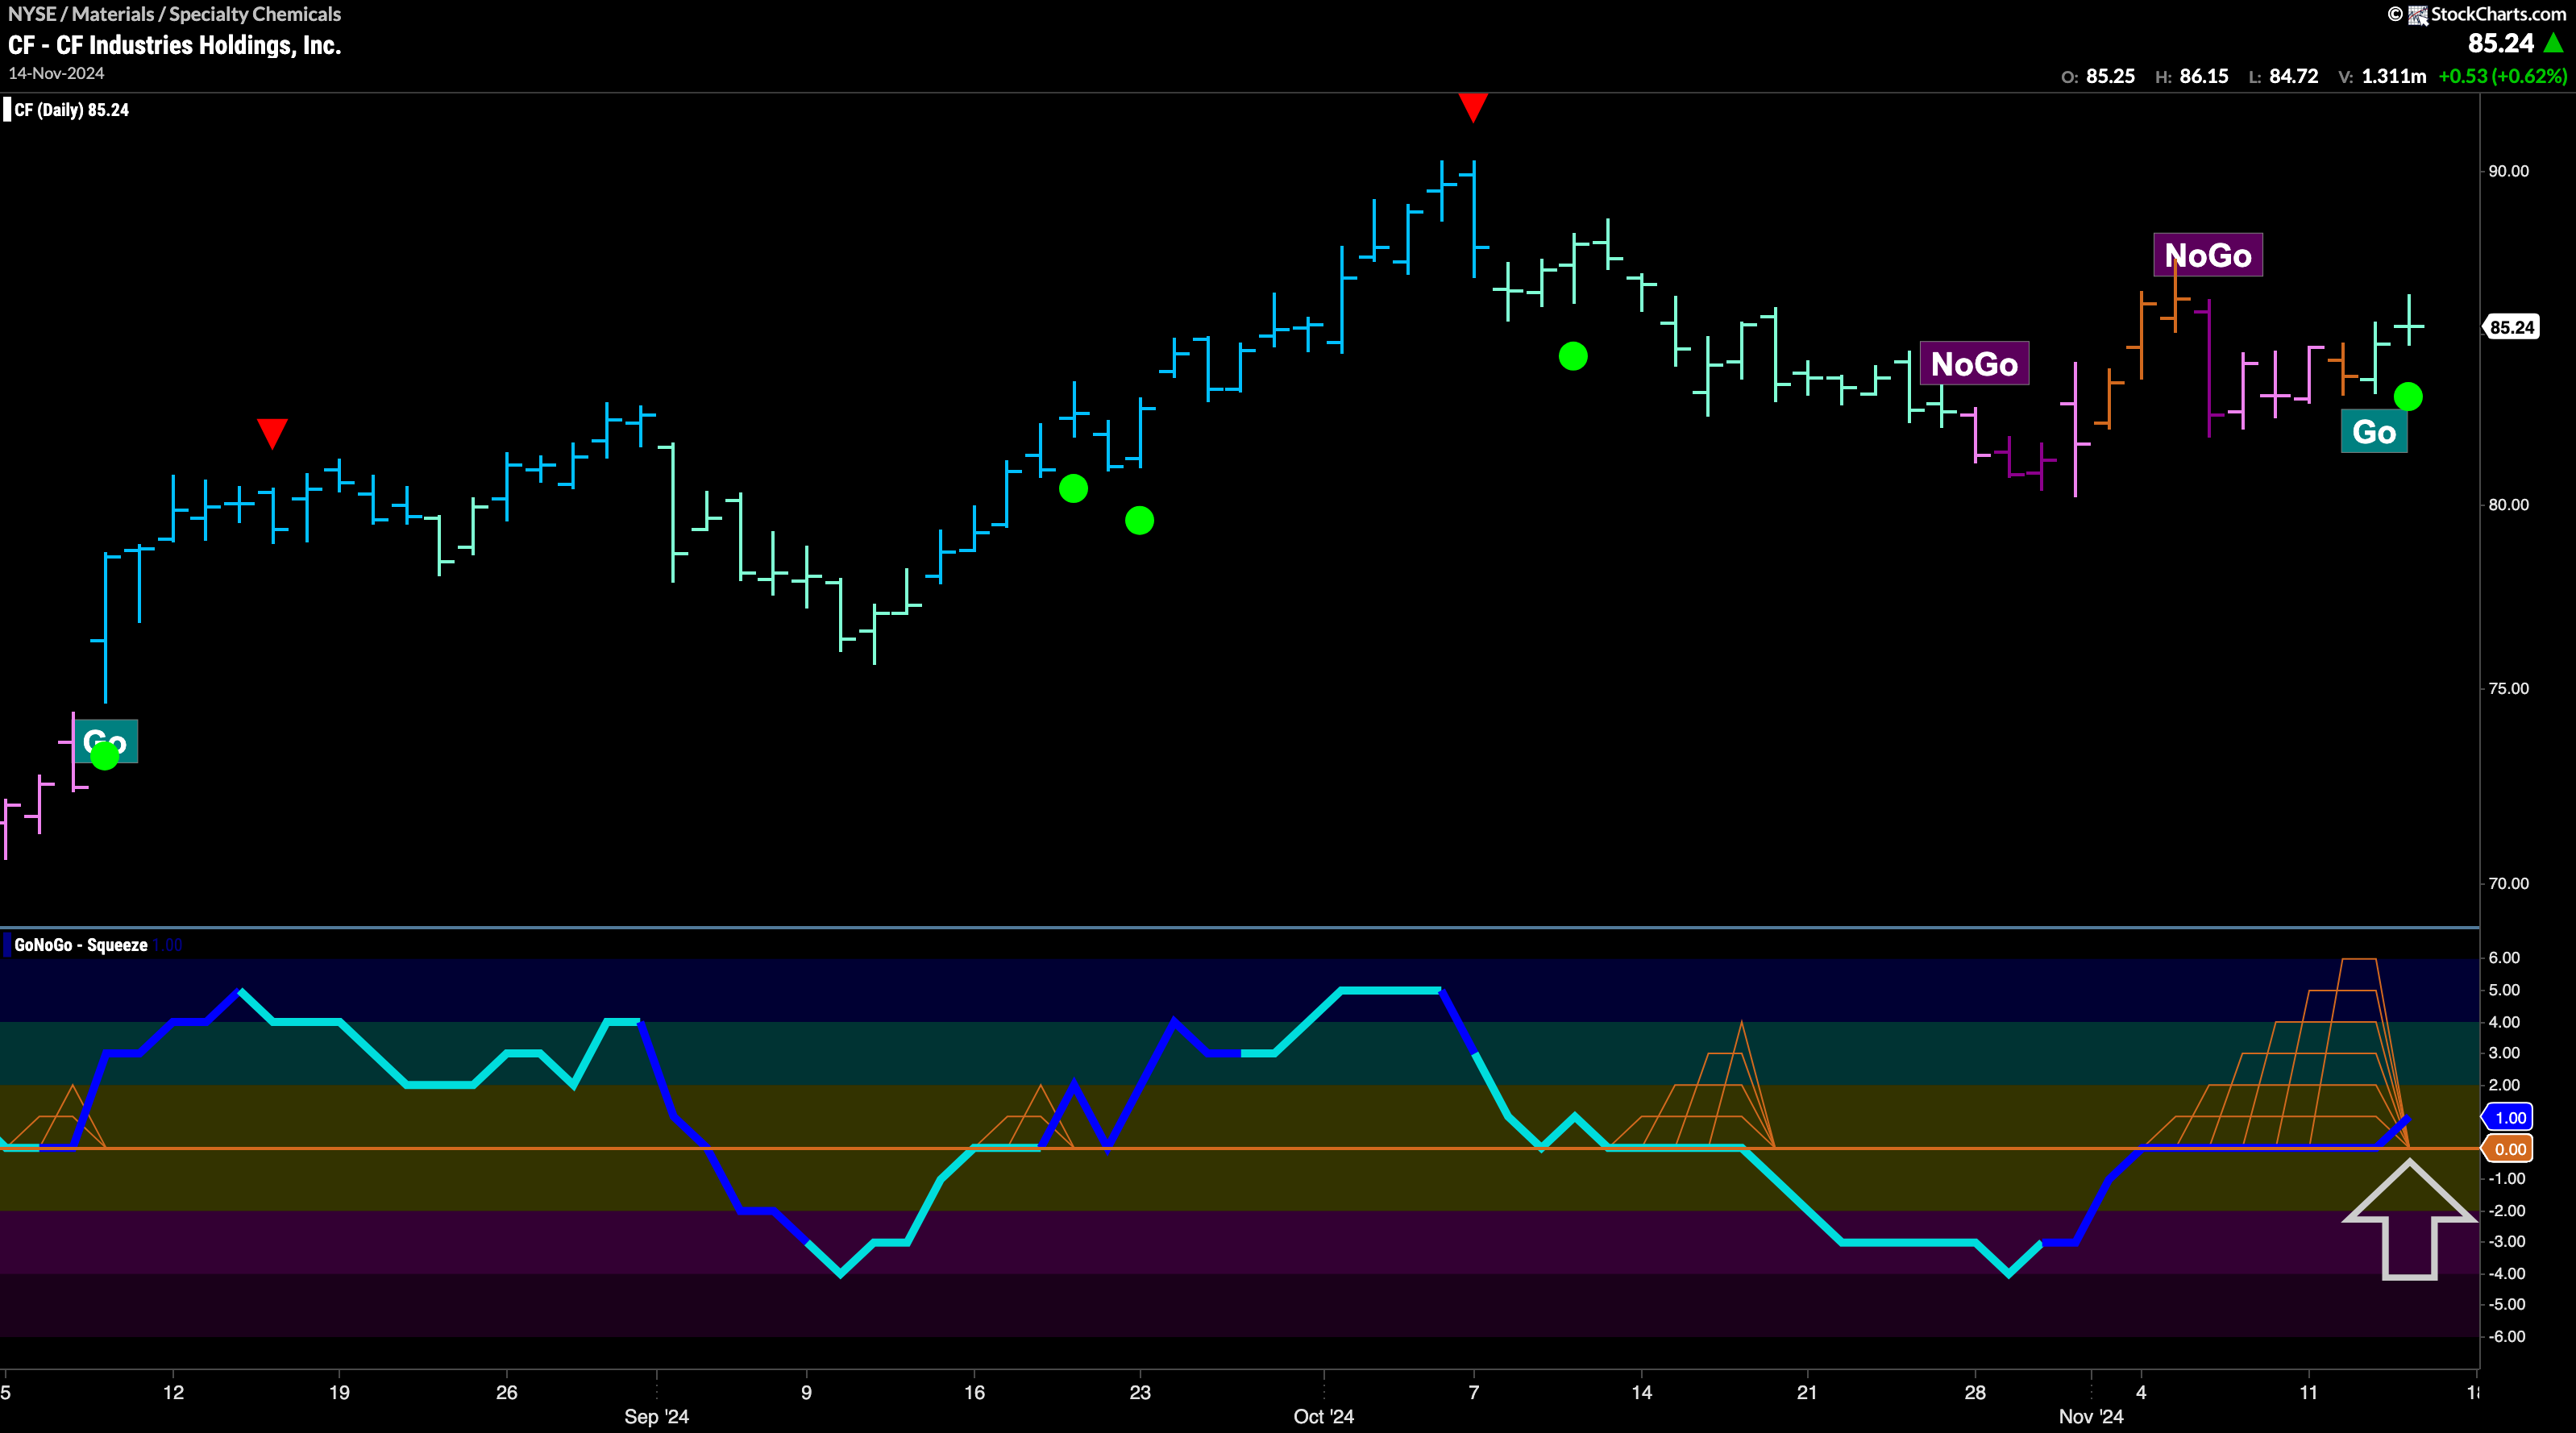
GoNoGo Trend shows that $CF has entered a new “Go” trend.
$CF had been in a “Go” trend since early August and we saw a series of higher highs and higher lows through the last high in October. At that high, we saw a Go Countertrend Correction Icon (red arrow) indicating that price may struggle to go higher in the short term. Indeed, GoNoGo Trend followed by painting a string of weaker aqua “Go” bars telling us of the weakness in the trend. With the weakness in full display, GoNoGo Oscillator fell to test the zero line from above. After a few bars, we saw the oscillator break into negative territory and this led a change in the price trend above. However, after a few “NoGo” bars, the oscillator rallied back to test the zero line this time from below. We saw a Max GoNoGo Squeeze build as there was a virtual tug of war between investors at this level. Now it seems the bulls have won, with GoNoGo Trend painting new “Go” bars and GoNoGo Oscillator breaking out of the Max Squeeze into positive territory on heavy volume. We will watch to see if this resurgent momentum in the direction of the new trend will give price the push it needs to make an attack on a new high.


