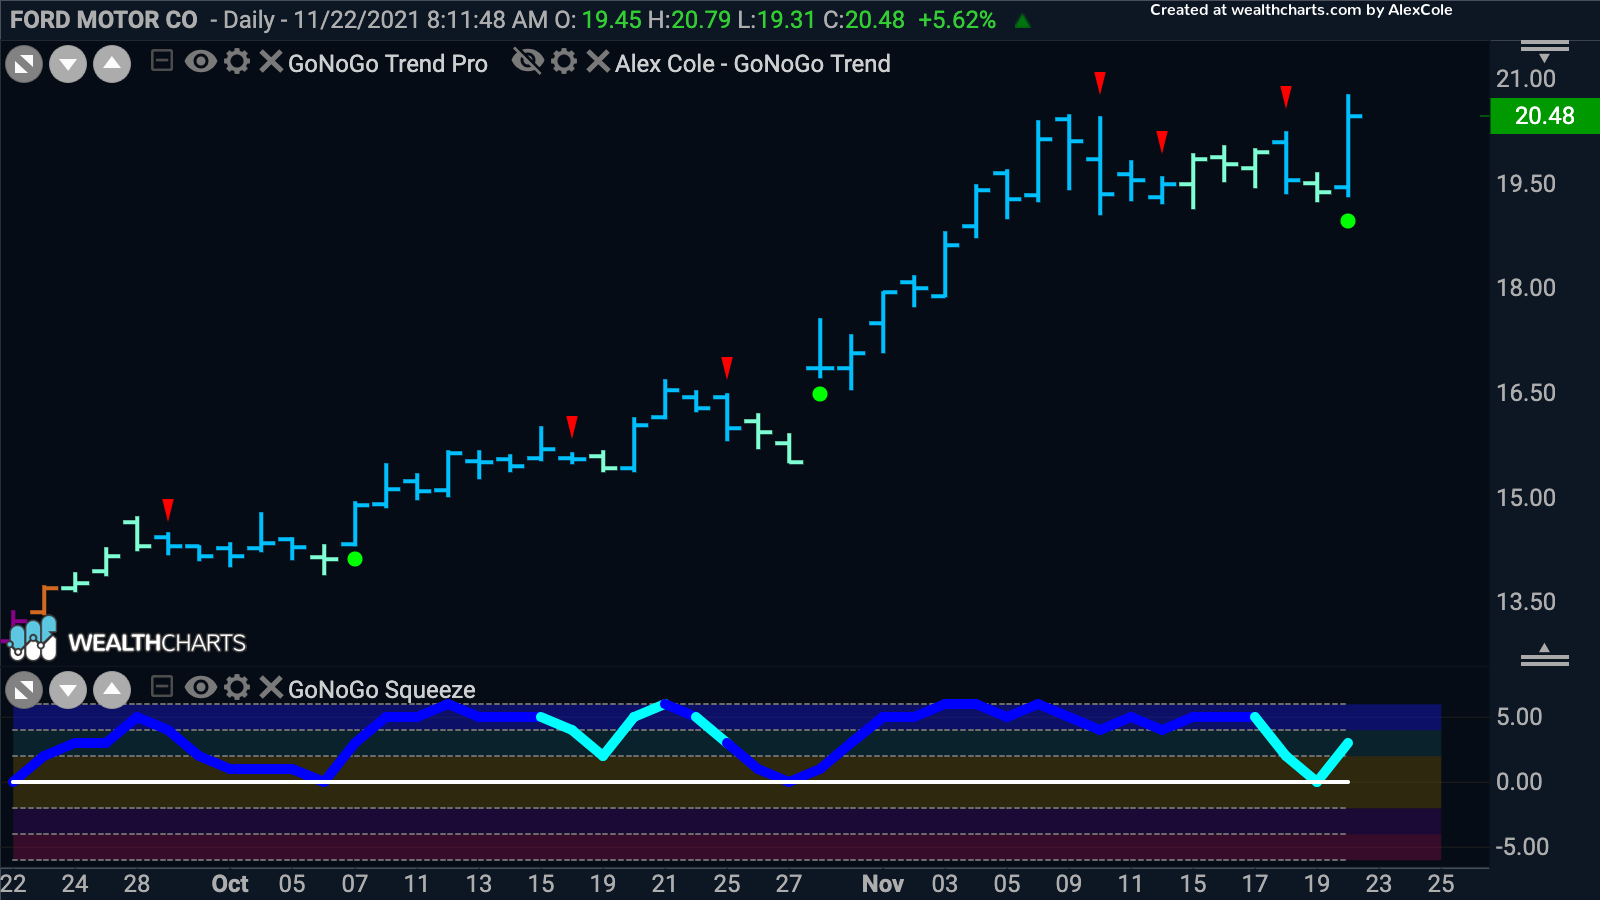
Ford Motor Co. has been on a tear since entering a “Go” trend in September on the daily GoNoGo Chart.
In fact, if we were to zoom out to a weekly GoNoGo Chart we would see that the automaker has been in a durable “Go” trend since the latter part of 2020. Having consolidated sideways since hitting highs earlier this month, price is trying to make another move higher. The GoNoGo Oscillator fell to the zero line and has bounced off it, indicating that momentum is back in the direction of the “Go” trend. This has triggered a low risk Go Trend Continuation green circle to appear under the price bar.


