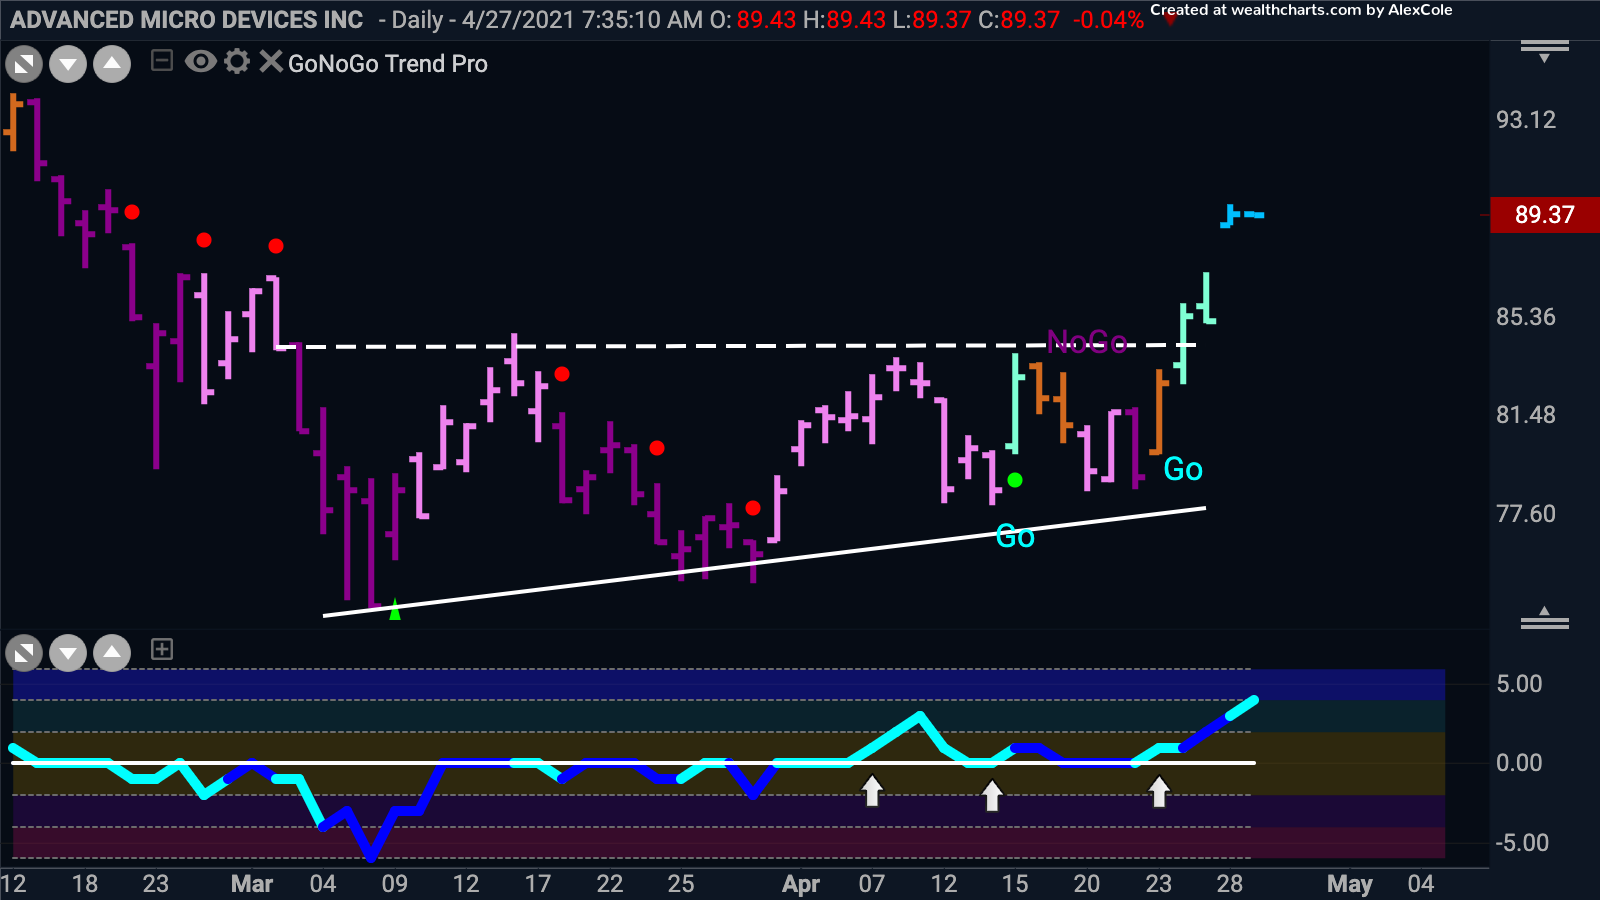

After falling from the early year highs AMD formed an ascending triangle.
During this period, we have seen a horizontal resistance level at the top of the pattern and a series of higher lows that make up the lower bound of the triangle. As we like to see when looking for GoNoGo setups, the GoNoGo Oscillator has broken above zero ahead of any GoNoGo Trend change and has been finding support at the zero line during the right side of the pattern. Furthermore, this “Go” trend that was identified on April 26th coincided with a break above resistance. AMD has gapped higher during the pre market but with the height of the triangle being what it is a target could be set at just shy of $95 and investors could go to a smaller time frame for an entry.


