The bull market rally clearly continues as we get into the 2nd quarter. The Nasdaq led the US equity indices with a 3% gain while the S&P 500 and Dow Jones Industrial Average trailed just behind. The Russel 2000 drifted slightly lower this week. and the appetite for risk assets is highlighted by market trends in GoNoGo Charts for equities, commodities, and digital assets. This does not mean all securities are moving uniformly…
"In investing, what is comfortable is rarely profitable." - Rob Arnott
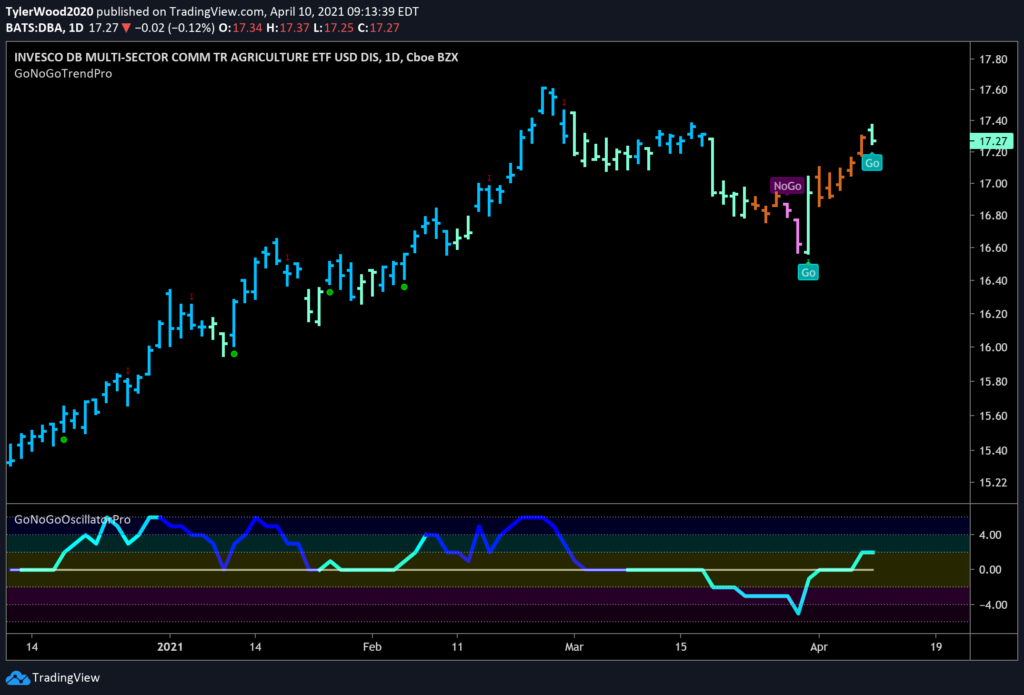
Energy stocks ($XLE) and oil, in particular, consolidating recent gains as investors lock in profits. This week offered a significant rebound in mega-cap technology ($XLF & $QQQ) and discretionary ($XLY) names as rates ($TLT) settle while agricultural commodities resume “Go” trends. See the Daily GoNoGo Trend Chart below of $DBA, the Agricultural Commodities ETF:

Commodities in particular are attractive from an asset allocation perspective relative to equities and fixed income as they break out from multi-decade lows and provide a hedge against inflation.
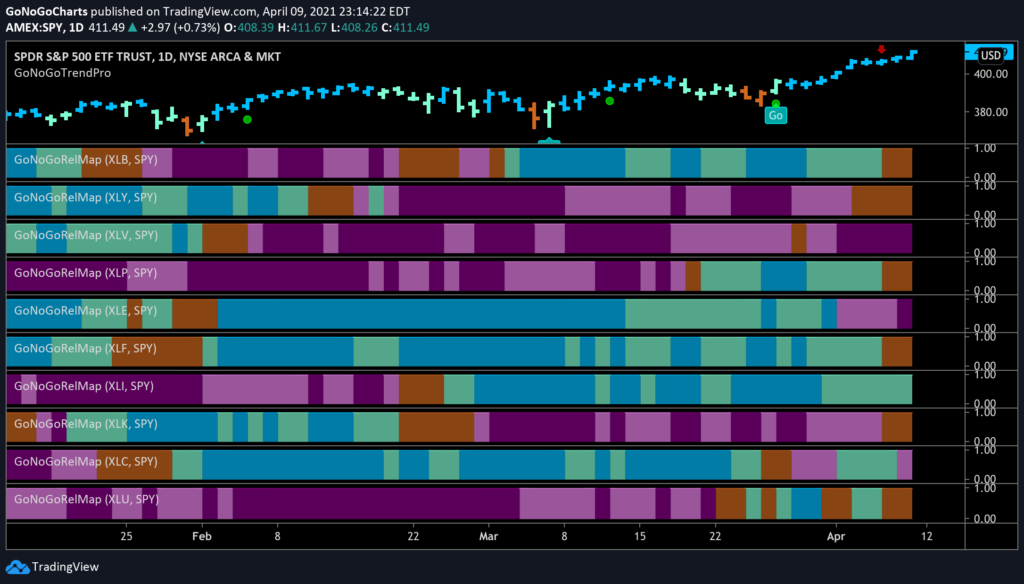
Within the S&P 500, ten of the eleven sectors posted gains for the week on an absolute basis, but the industrial sector $XLI was the sole outperformer on a relative basis. See the GoNoGo RelMap of S&P Equity Sectors. The heatmap highlights the trend conditions of their relative strength ratios against the index:

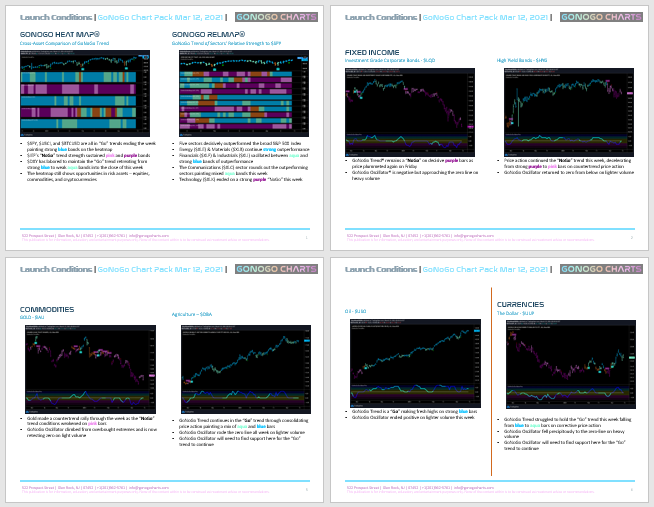
This is your weekly review of market trends across global indices and all asset classes. We hope you take a minute this weekend to flip through all 16 charts to get a sense of the bigger picture before getting back to another hectic trading week.
Click here to open your Launch Conditions Chart Pack.


