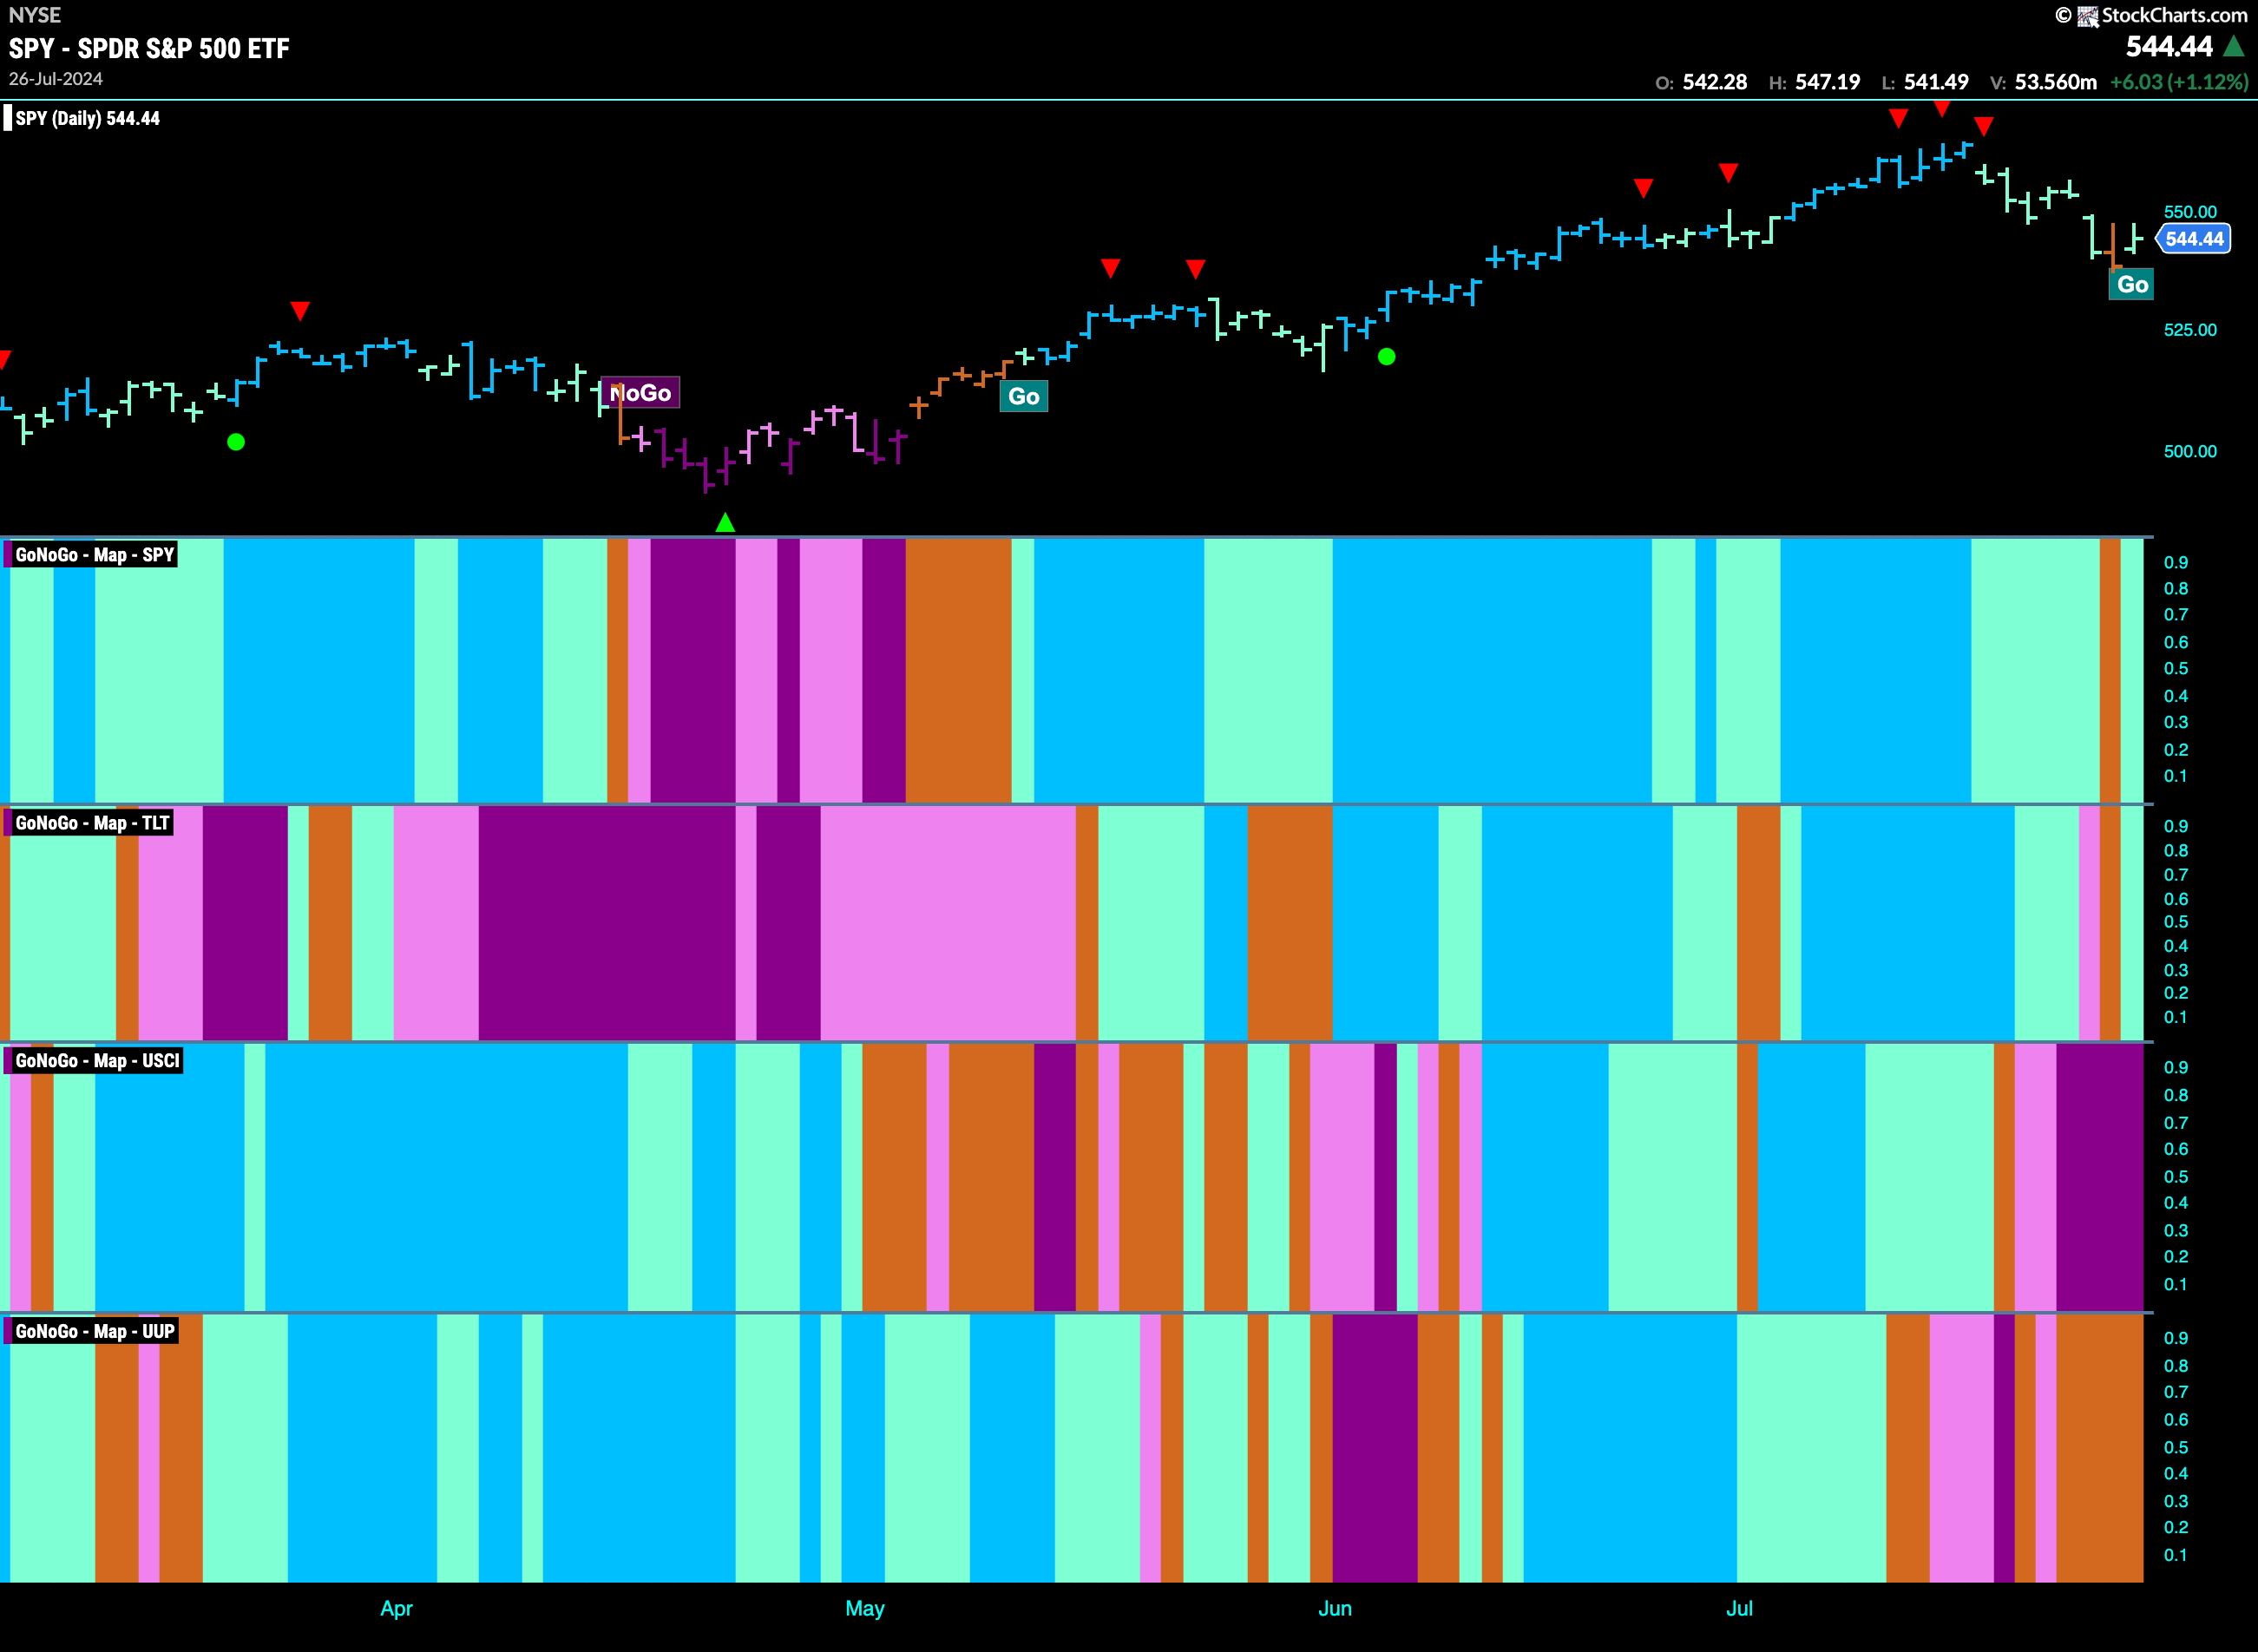
Good morning and welcome to this week’s Flight Path. Equities had another tough week last week and we saw an amber “Go Fish” bar for the first time since this latest “Go” trend began. Encouragingly, GoNoGo Trend painted a weak aqua “Go” bar on the last day of the week but has the damage been done? Treasury bond prices also fell briefly out of the “Go” trend but also ended the week with an aqua “Go” bar. U.S. commodities fell deeper into a “NoGo” as the indicator painted strong purple bar. The dollar still cannot make up its mind and we saw a string of “Go Fish” this past week.
$SPY Manages to Maintain a “Go” for Now
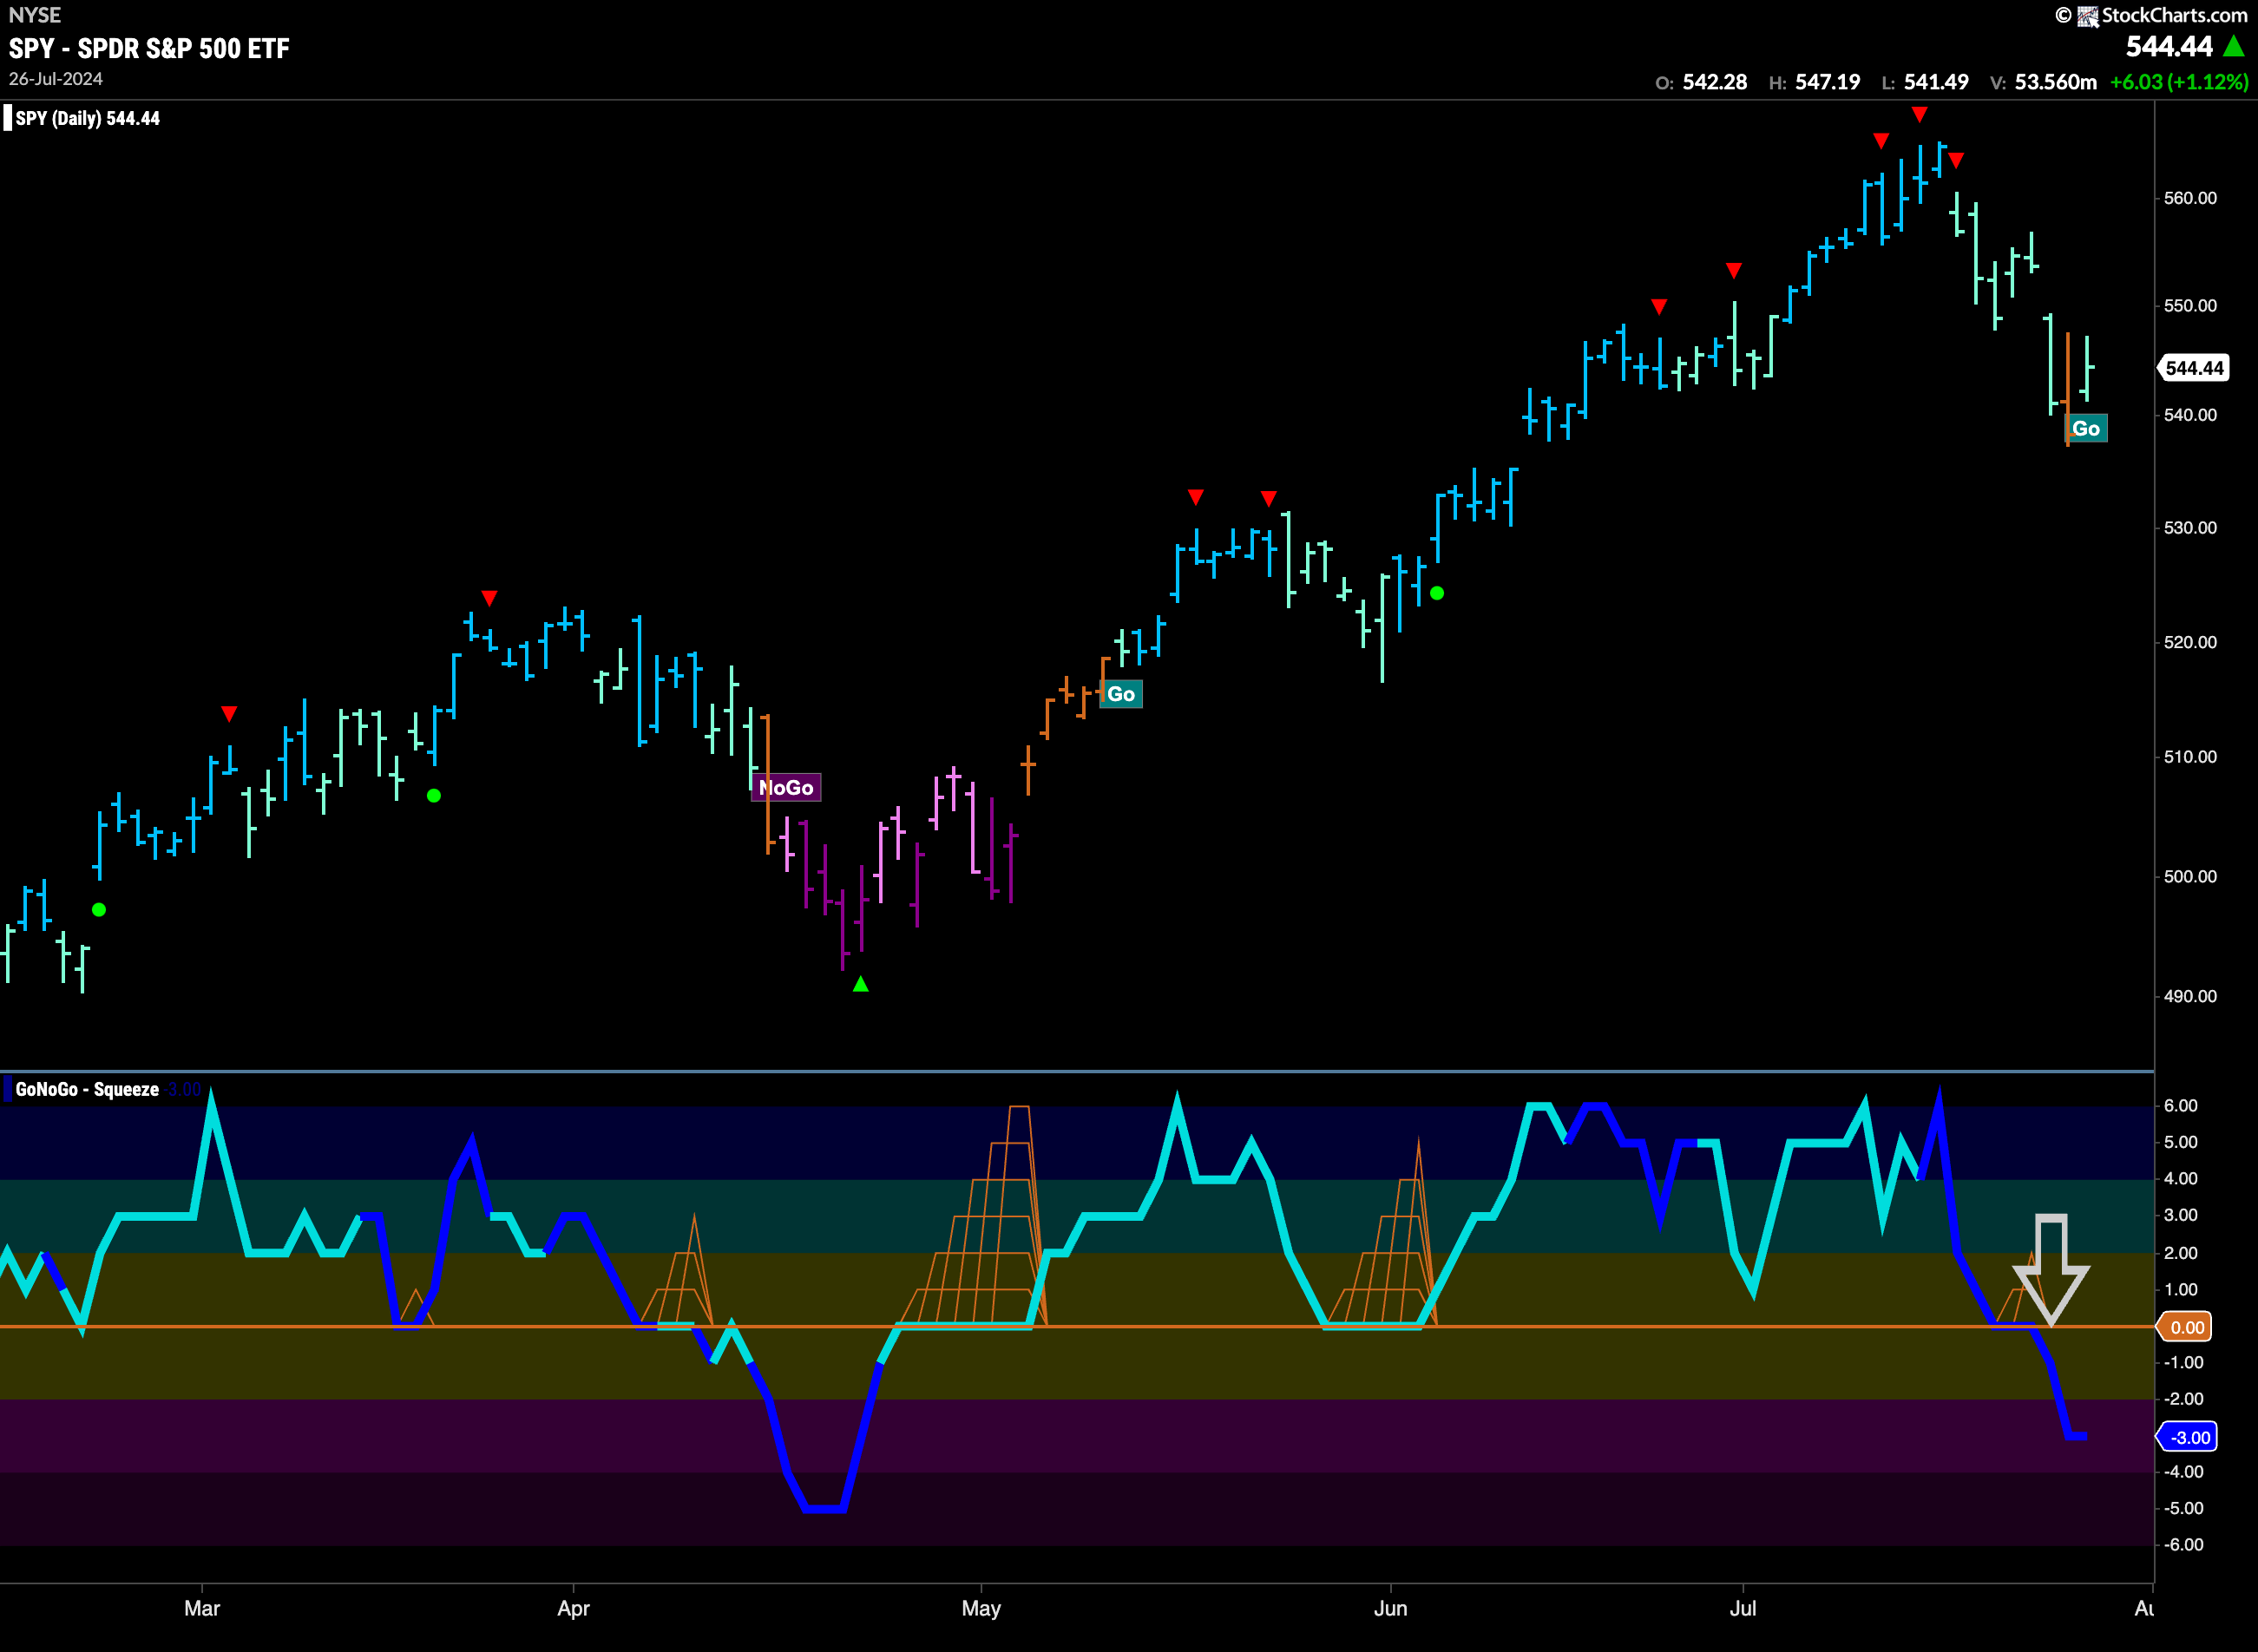
Price has fallen further since the Go Countertrend Correction Icons that we saw at the top. This week a “Go Fish” bar was painted as the market expressed its uncertainty. This comes as GoNoGo Oscillator crashed through the zero line into positive territory on heavy volume. We know that in a healthy trend the oscillator should find support at that level and so we know now that momentum is out of step with the “Go” trend. We will be wary here of more price deterioration.
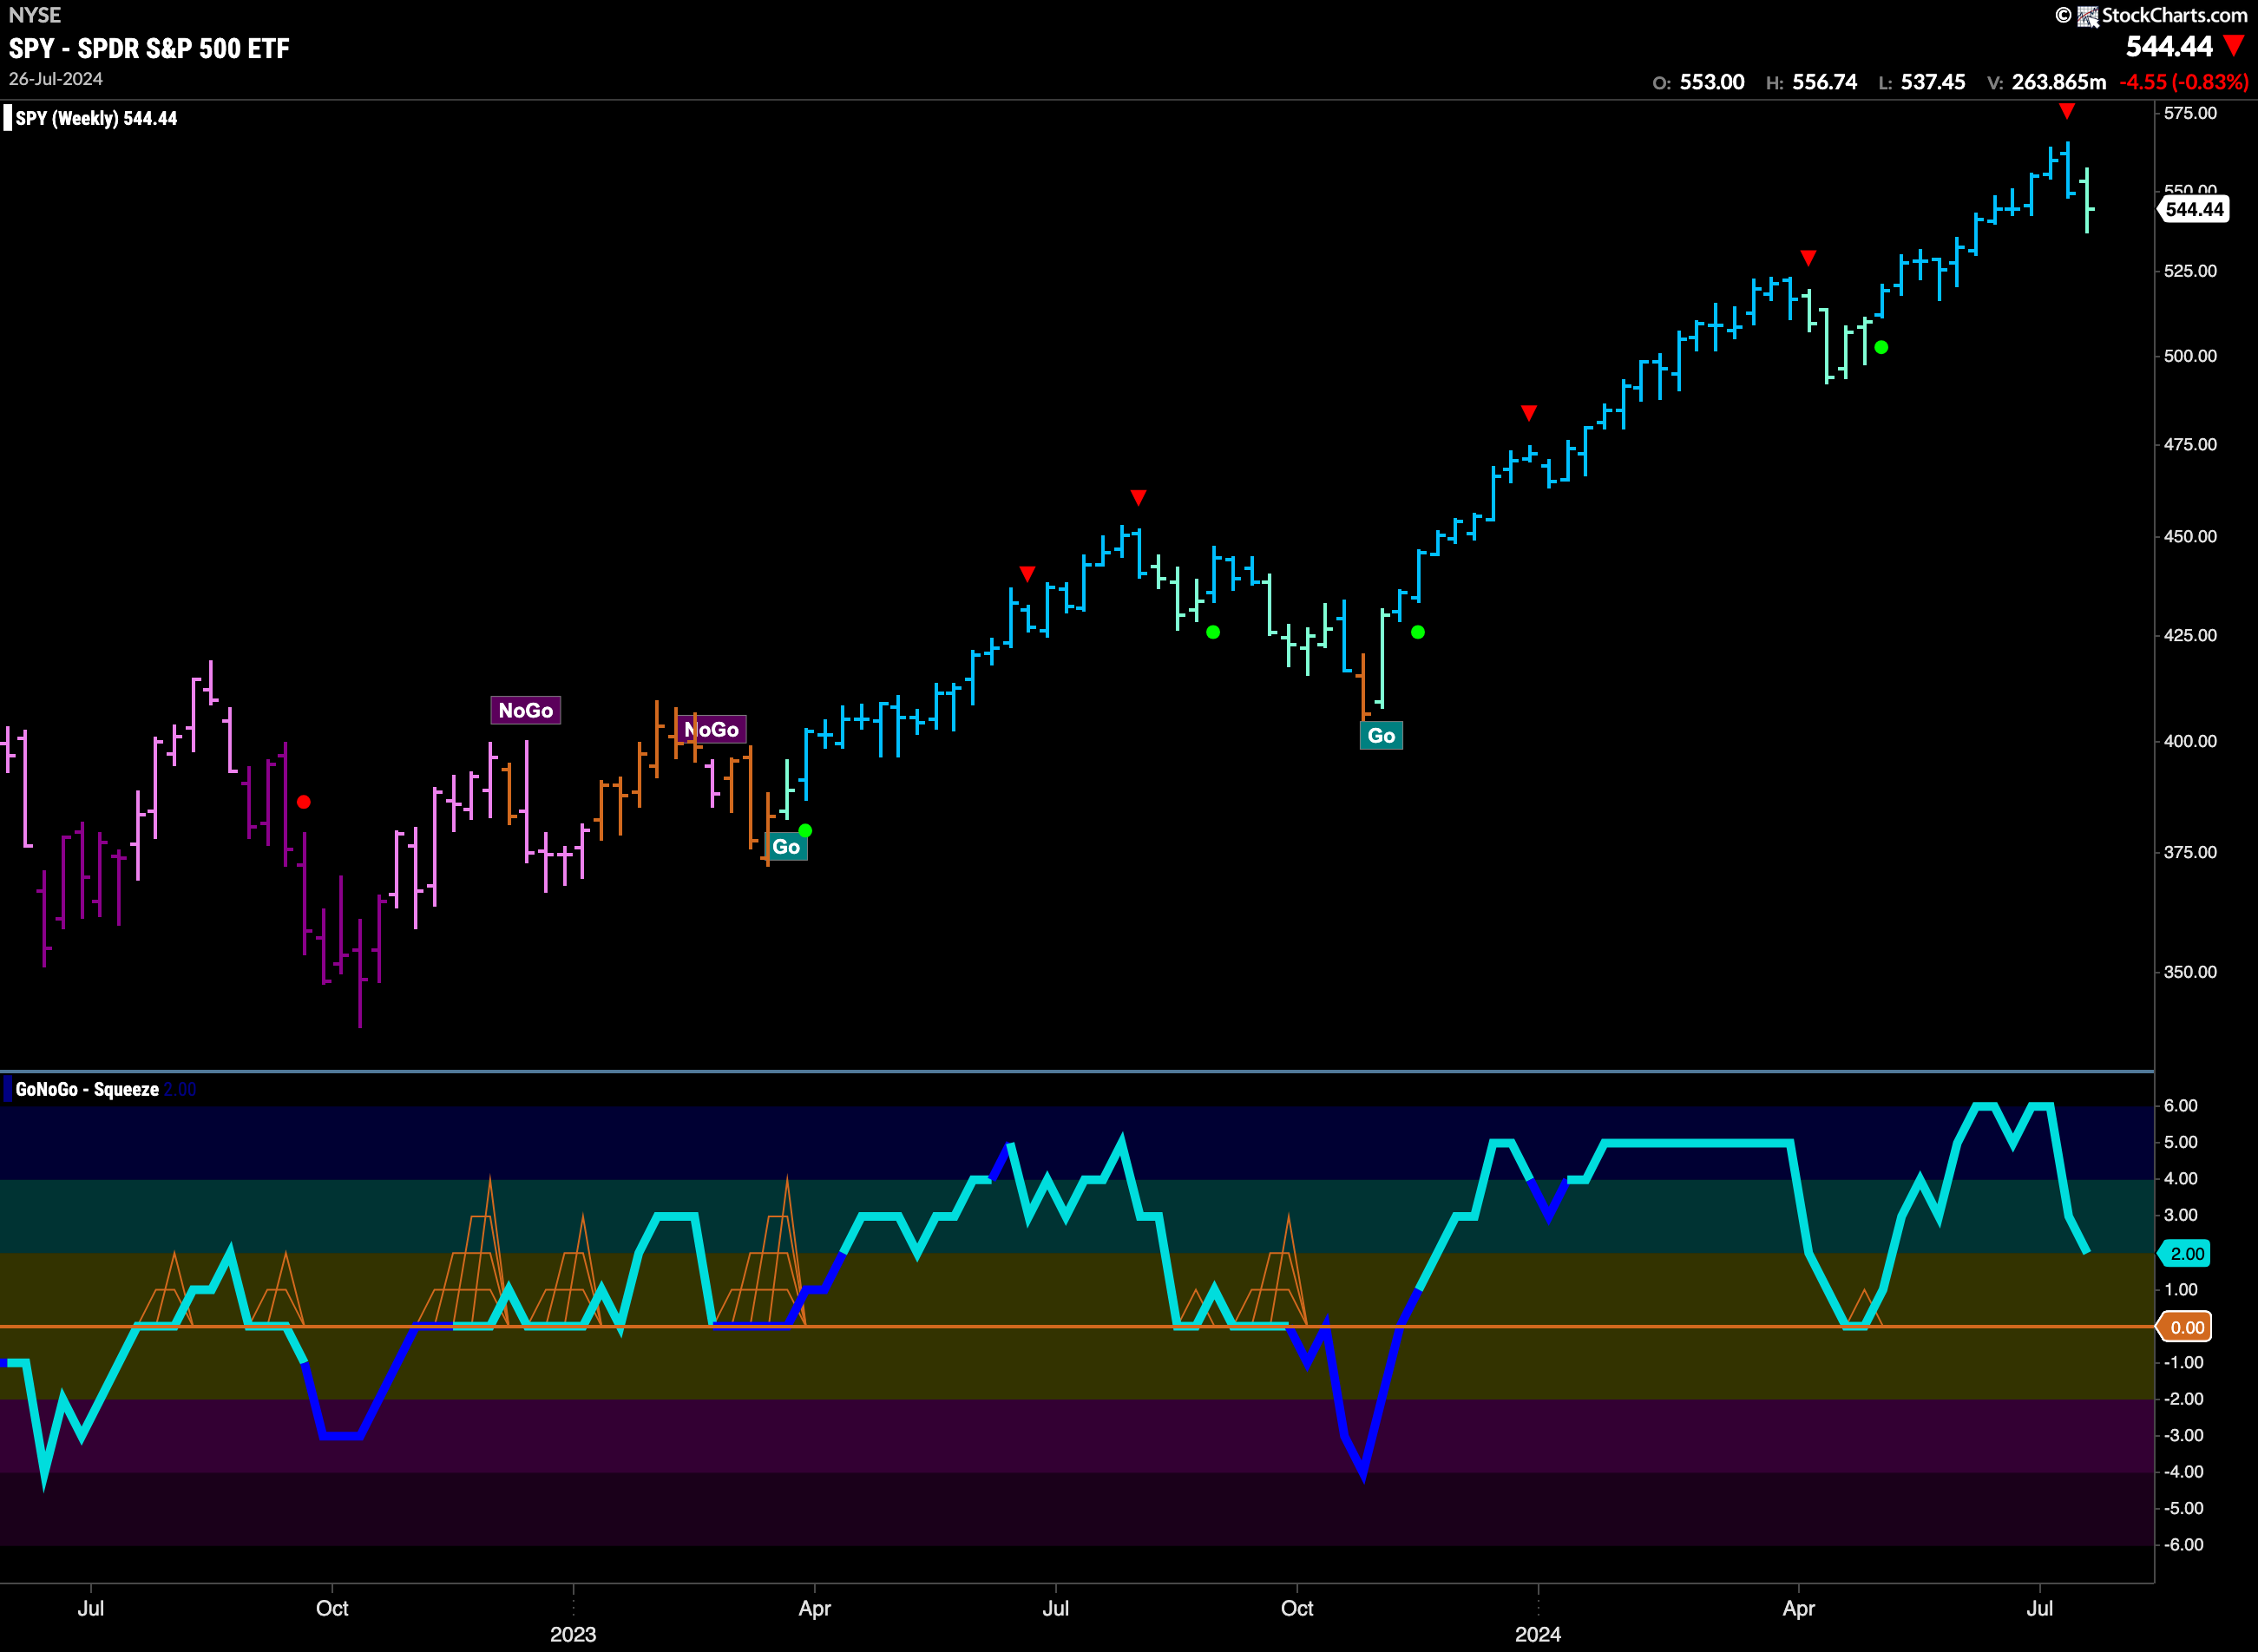
A hint of weakness on the weekly chart. For the first time in almost three months we did not close in a strong blue bar. We also note the Go Countertrend Correction Icon (red arrow) that appeared at the top. This suggests that price may struggle to move higher in the short term because momentum has waned. We will look to see if the oscillator finds support at zero as it gets closer.
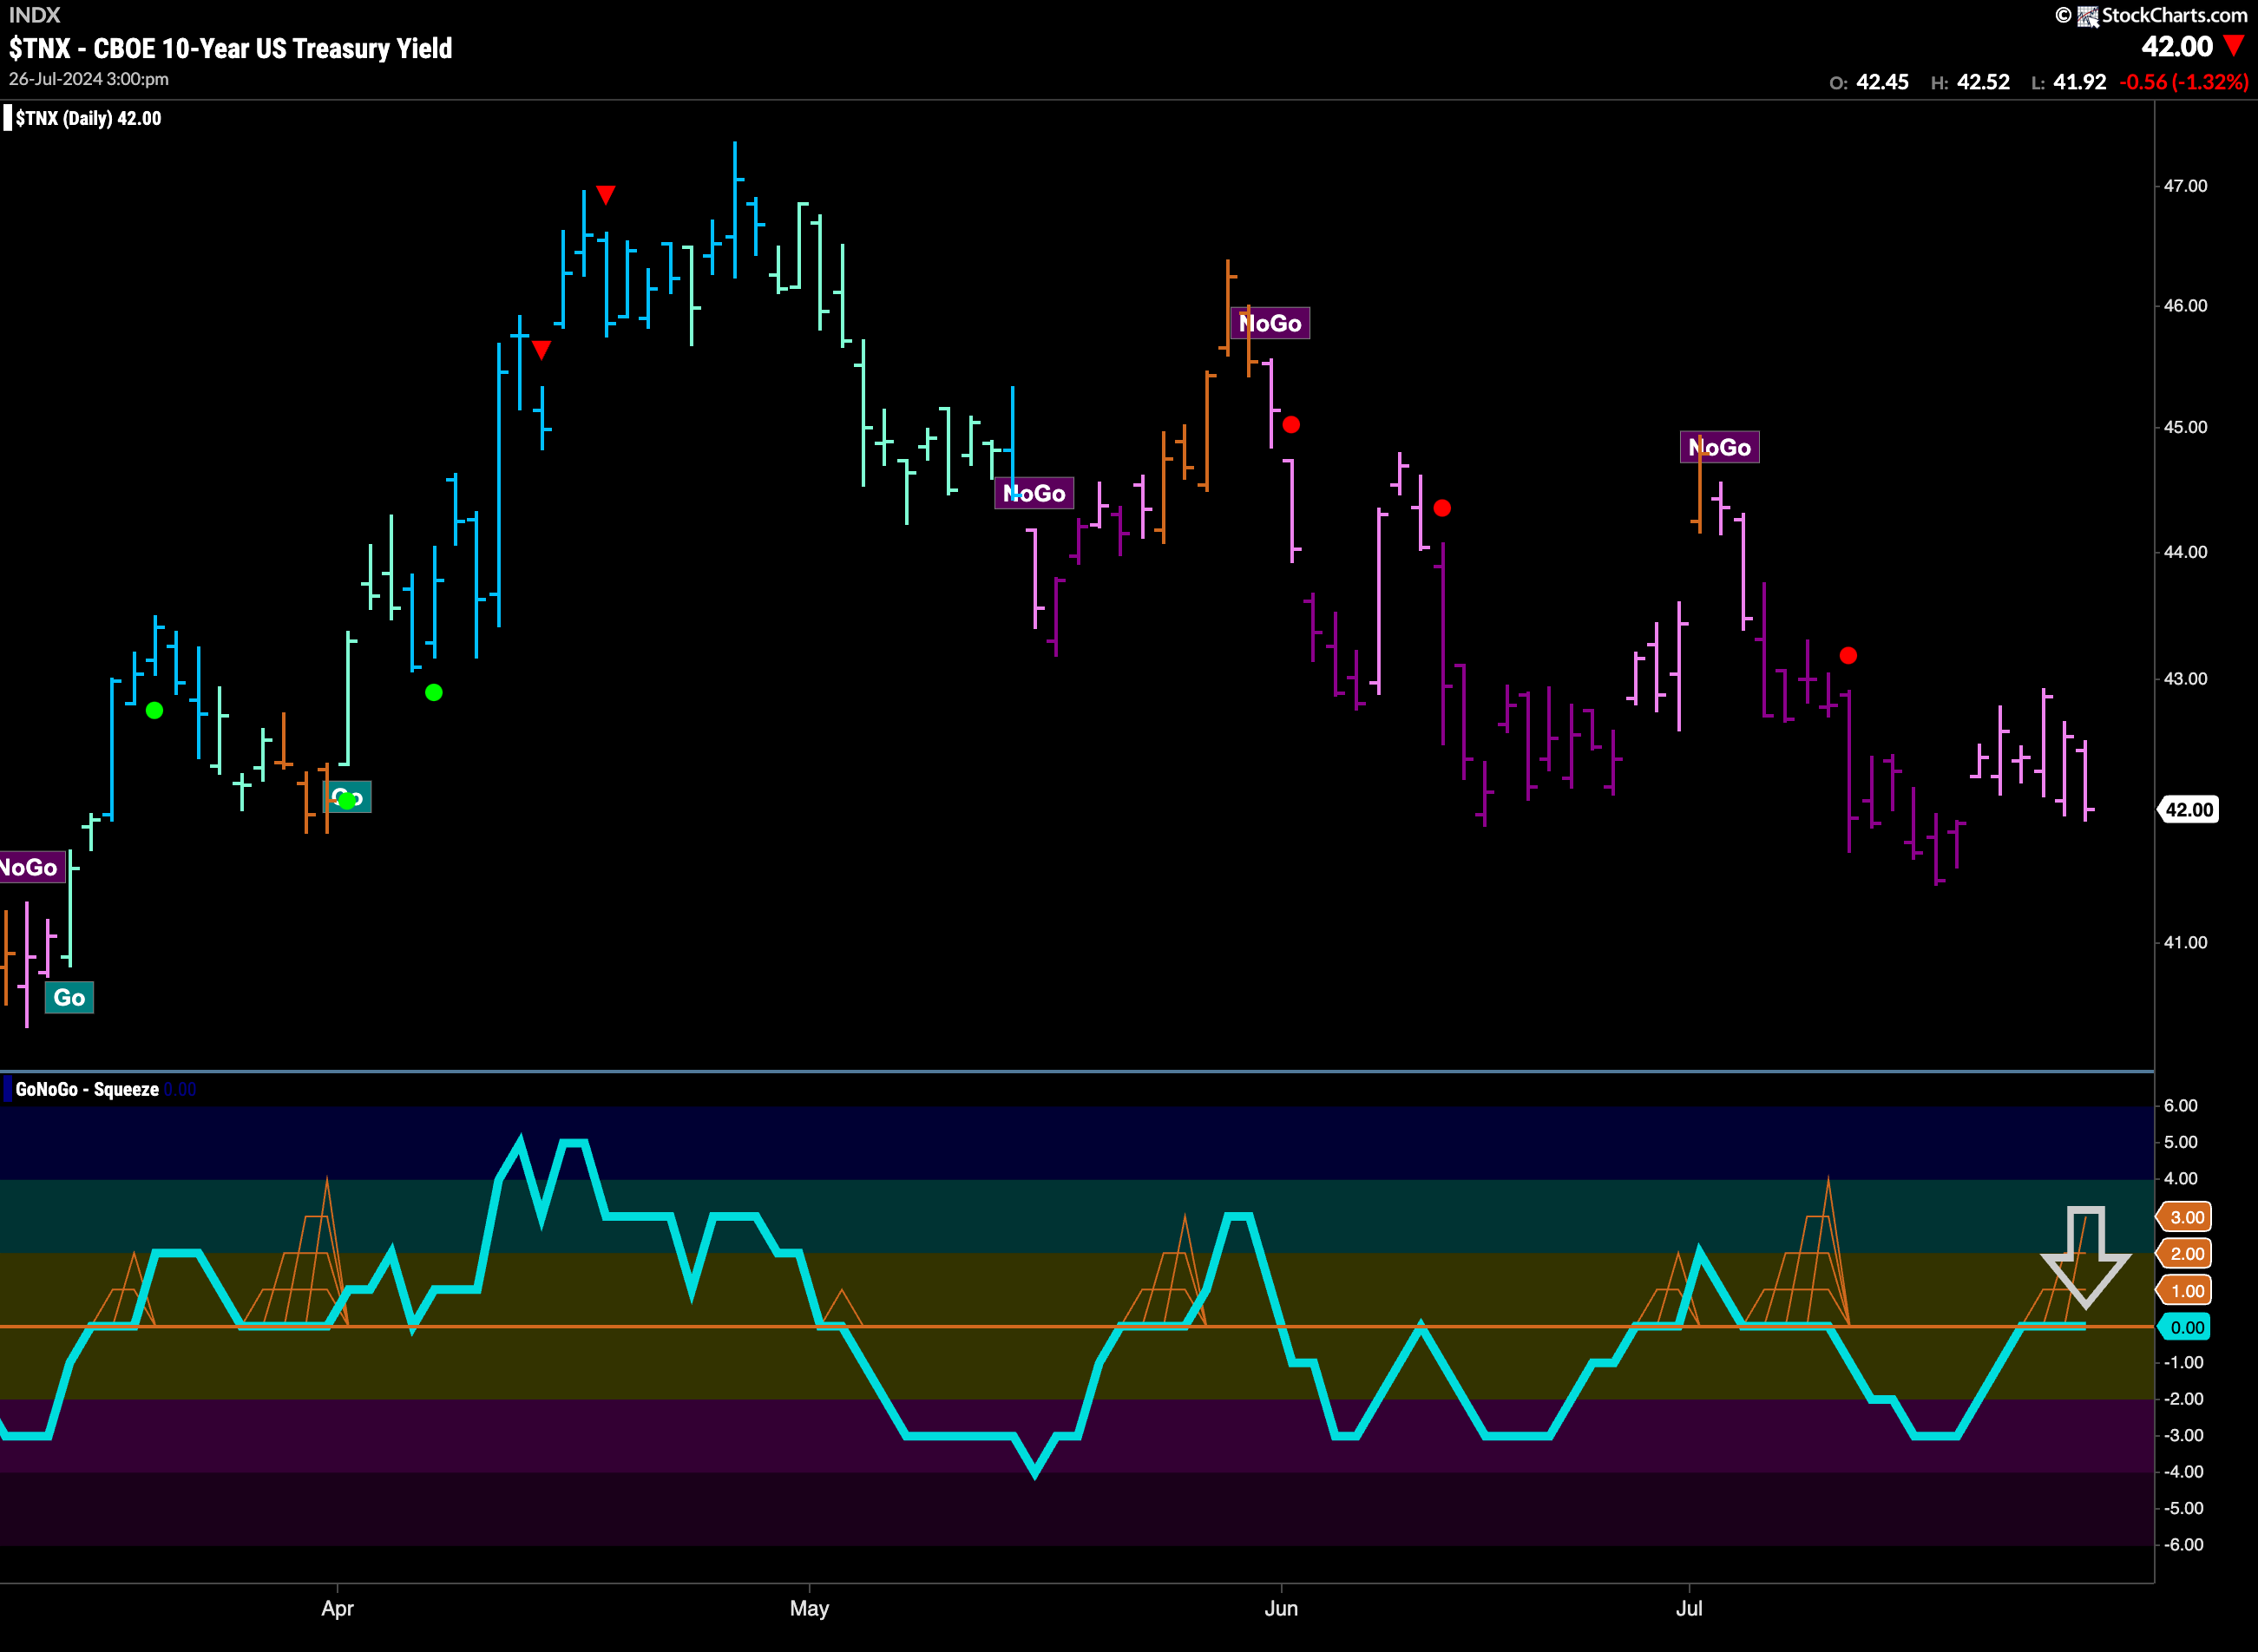
Treasury Rates in “NoGo” but Paint Weak Pink Bars
This week we saw a week of uninterrupted pink “NoGo” bars. Price seems to have set a new lower high as we ended the week lower. If we turn our eye to the GoNoGo Oscillator we can see that it is testing the zero line from below. If this NoGo trend is to remain in place we expect to see this level act as resistance. If GoNoGo Oscillator is turned away into negative territory we will look for price to make an attempt at new lows.
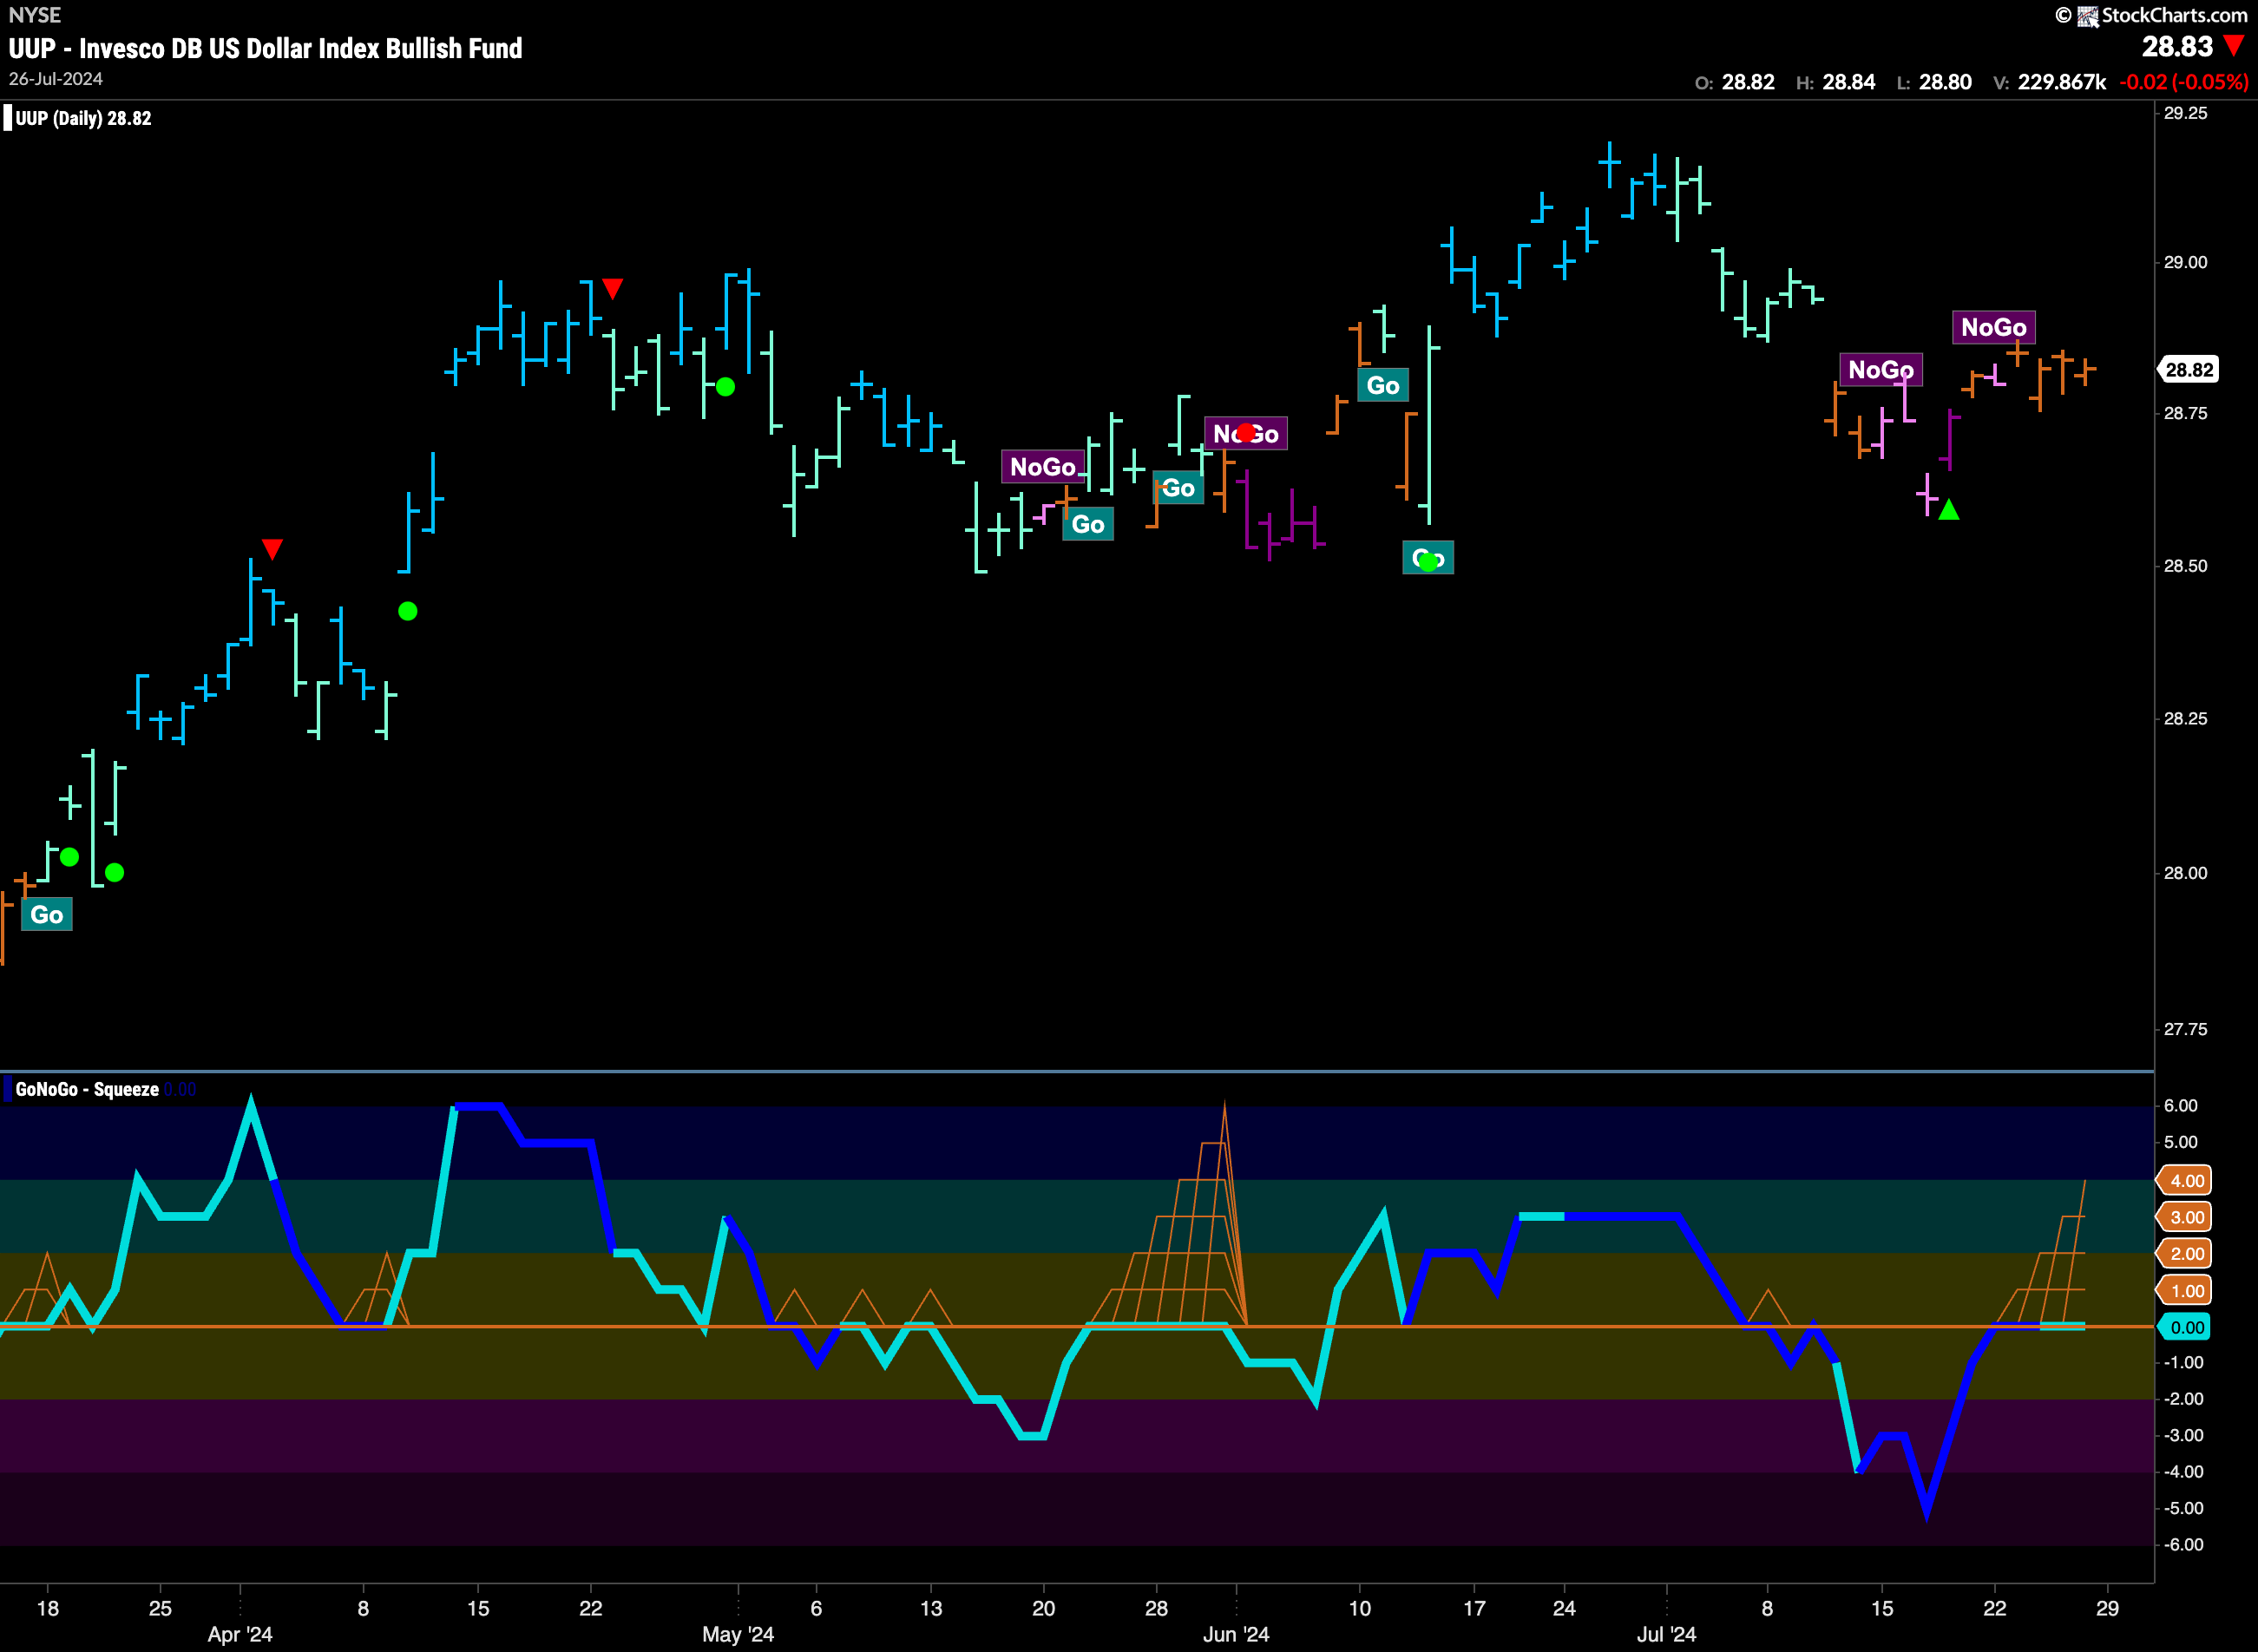
Continued Uncertainty for the U.S. dollar
Its been a few weeks now that we’ve been talking about uncertainty in the U.S. dollar. This week we saw “Go Fish” bars dominate as price moved mostly sideways. GoNoGo Oscillator is riding the zero line after rising to it from below. We see a GoNoGo Squeeze climbing to its Max. We will pay close attention to the direction of the break. If the oscillator breaks back into negative territory then we will look for price to move lower.
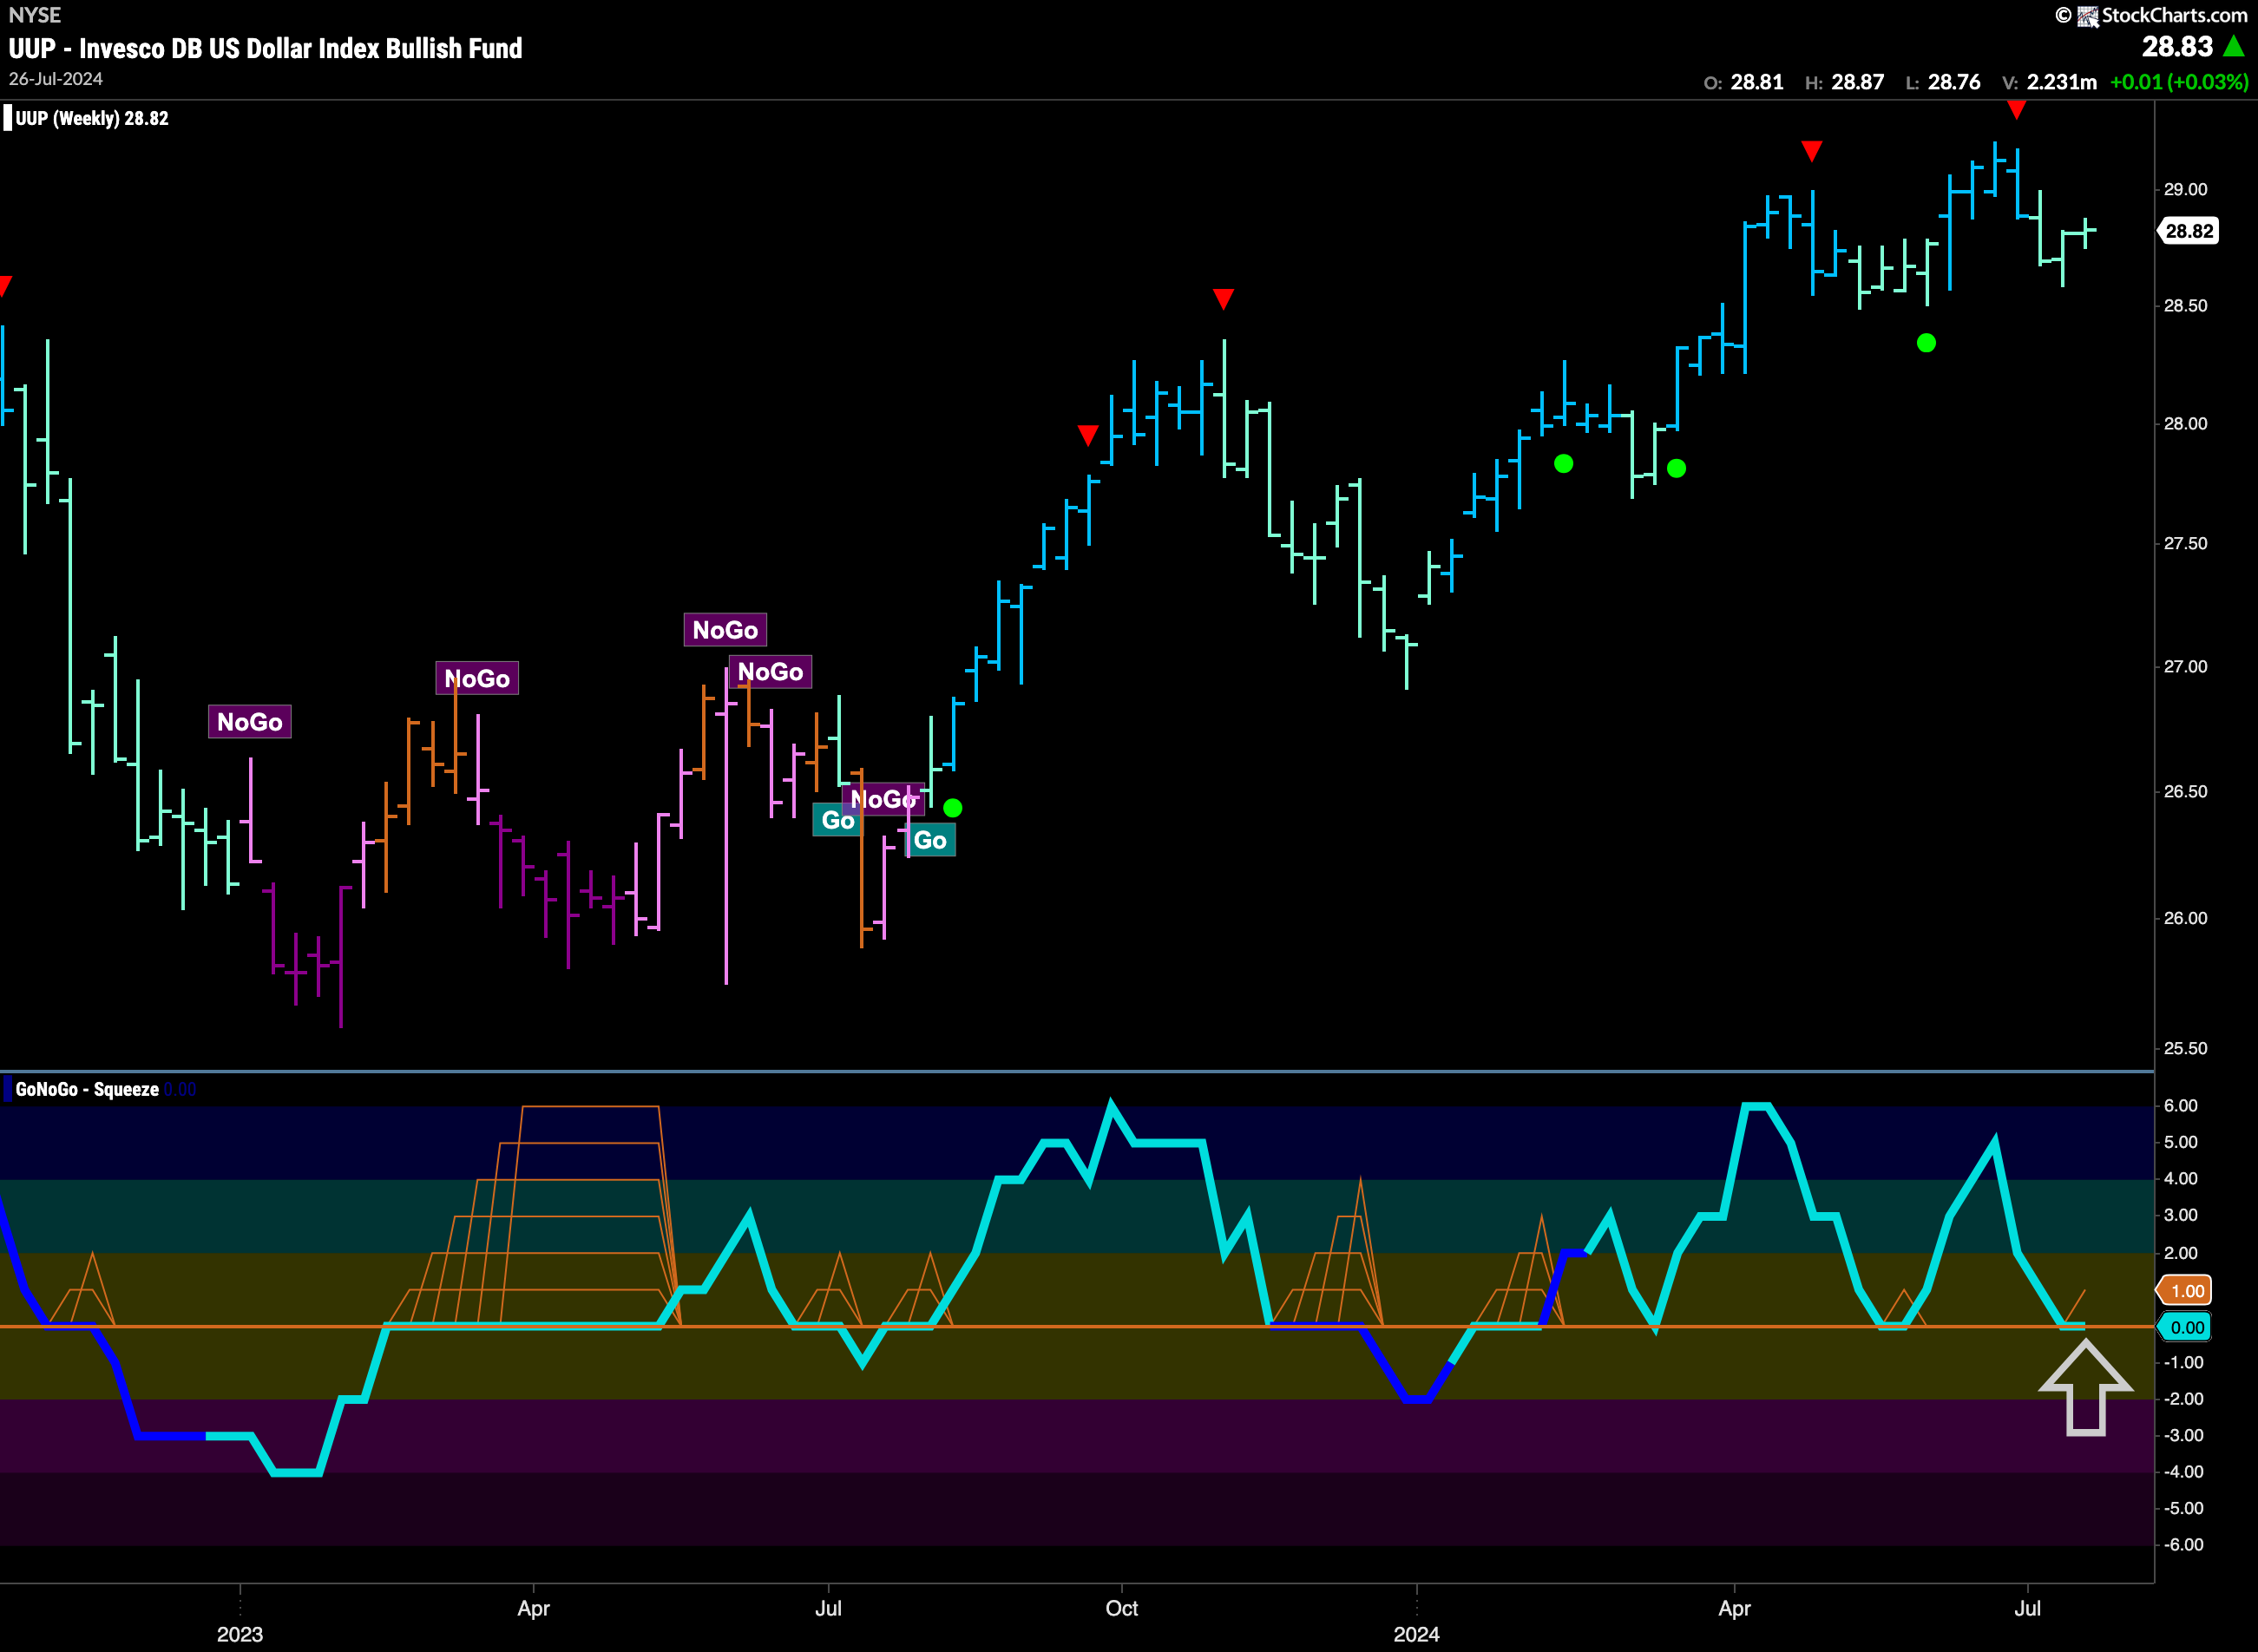
The weekly chart shows us that the “Go” trend is still in place but there is continued weakness as the indicator paints another weaker aqua “Go” bar. GoNoGo Oscillator is at the zero line where we will watch to see if it finds support. If it does, and rebounds back into positive territory then it is likely that price has set another higher low and we will look for price to challenge for new highs.
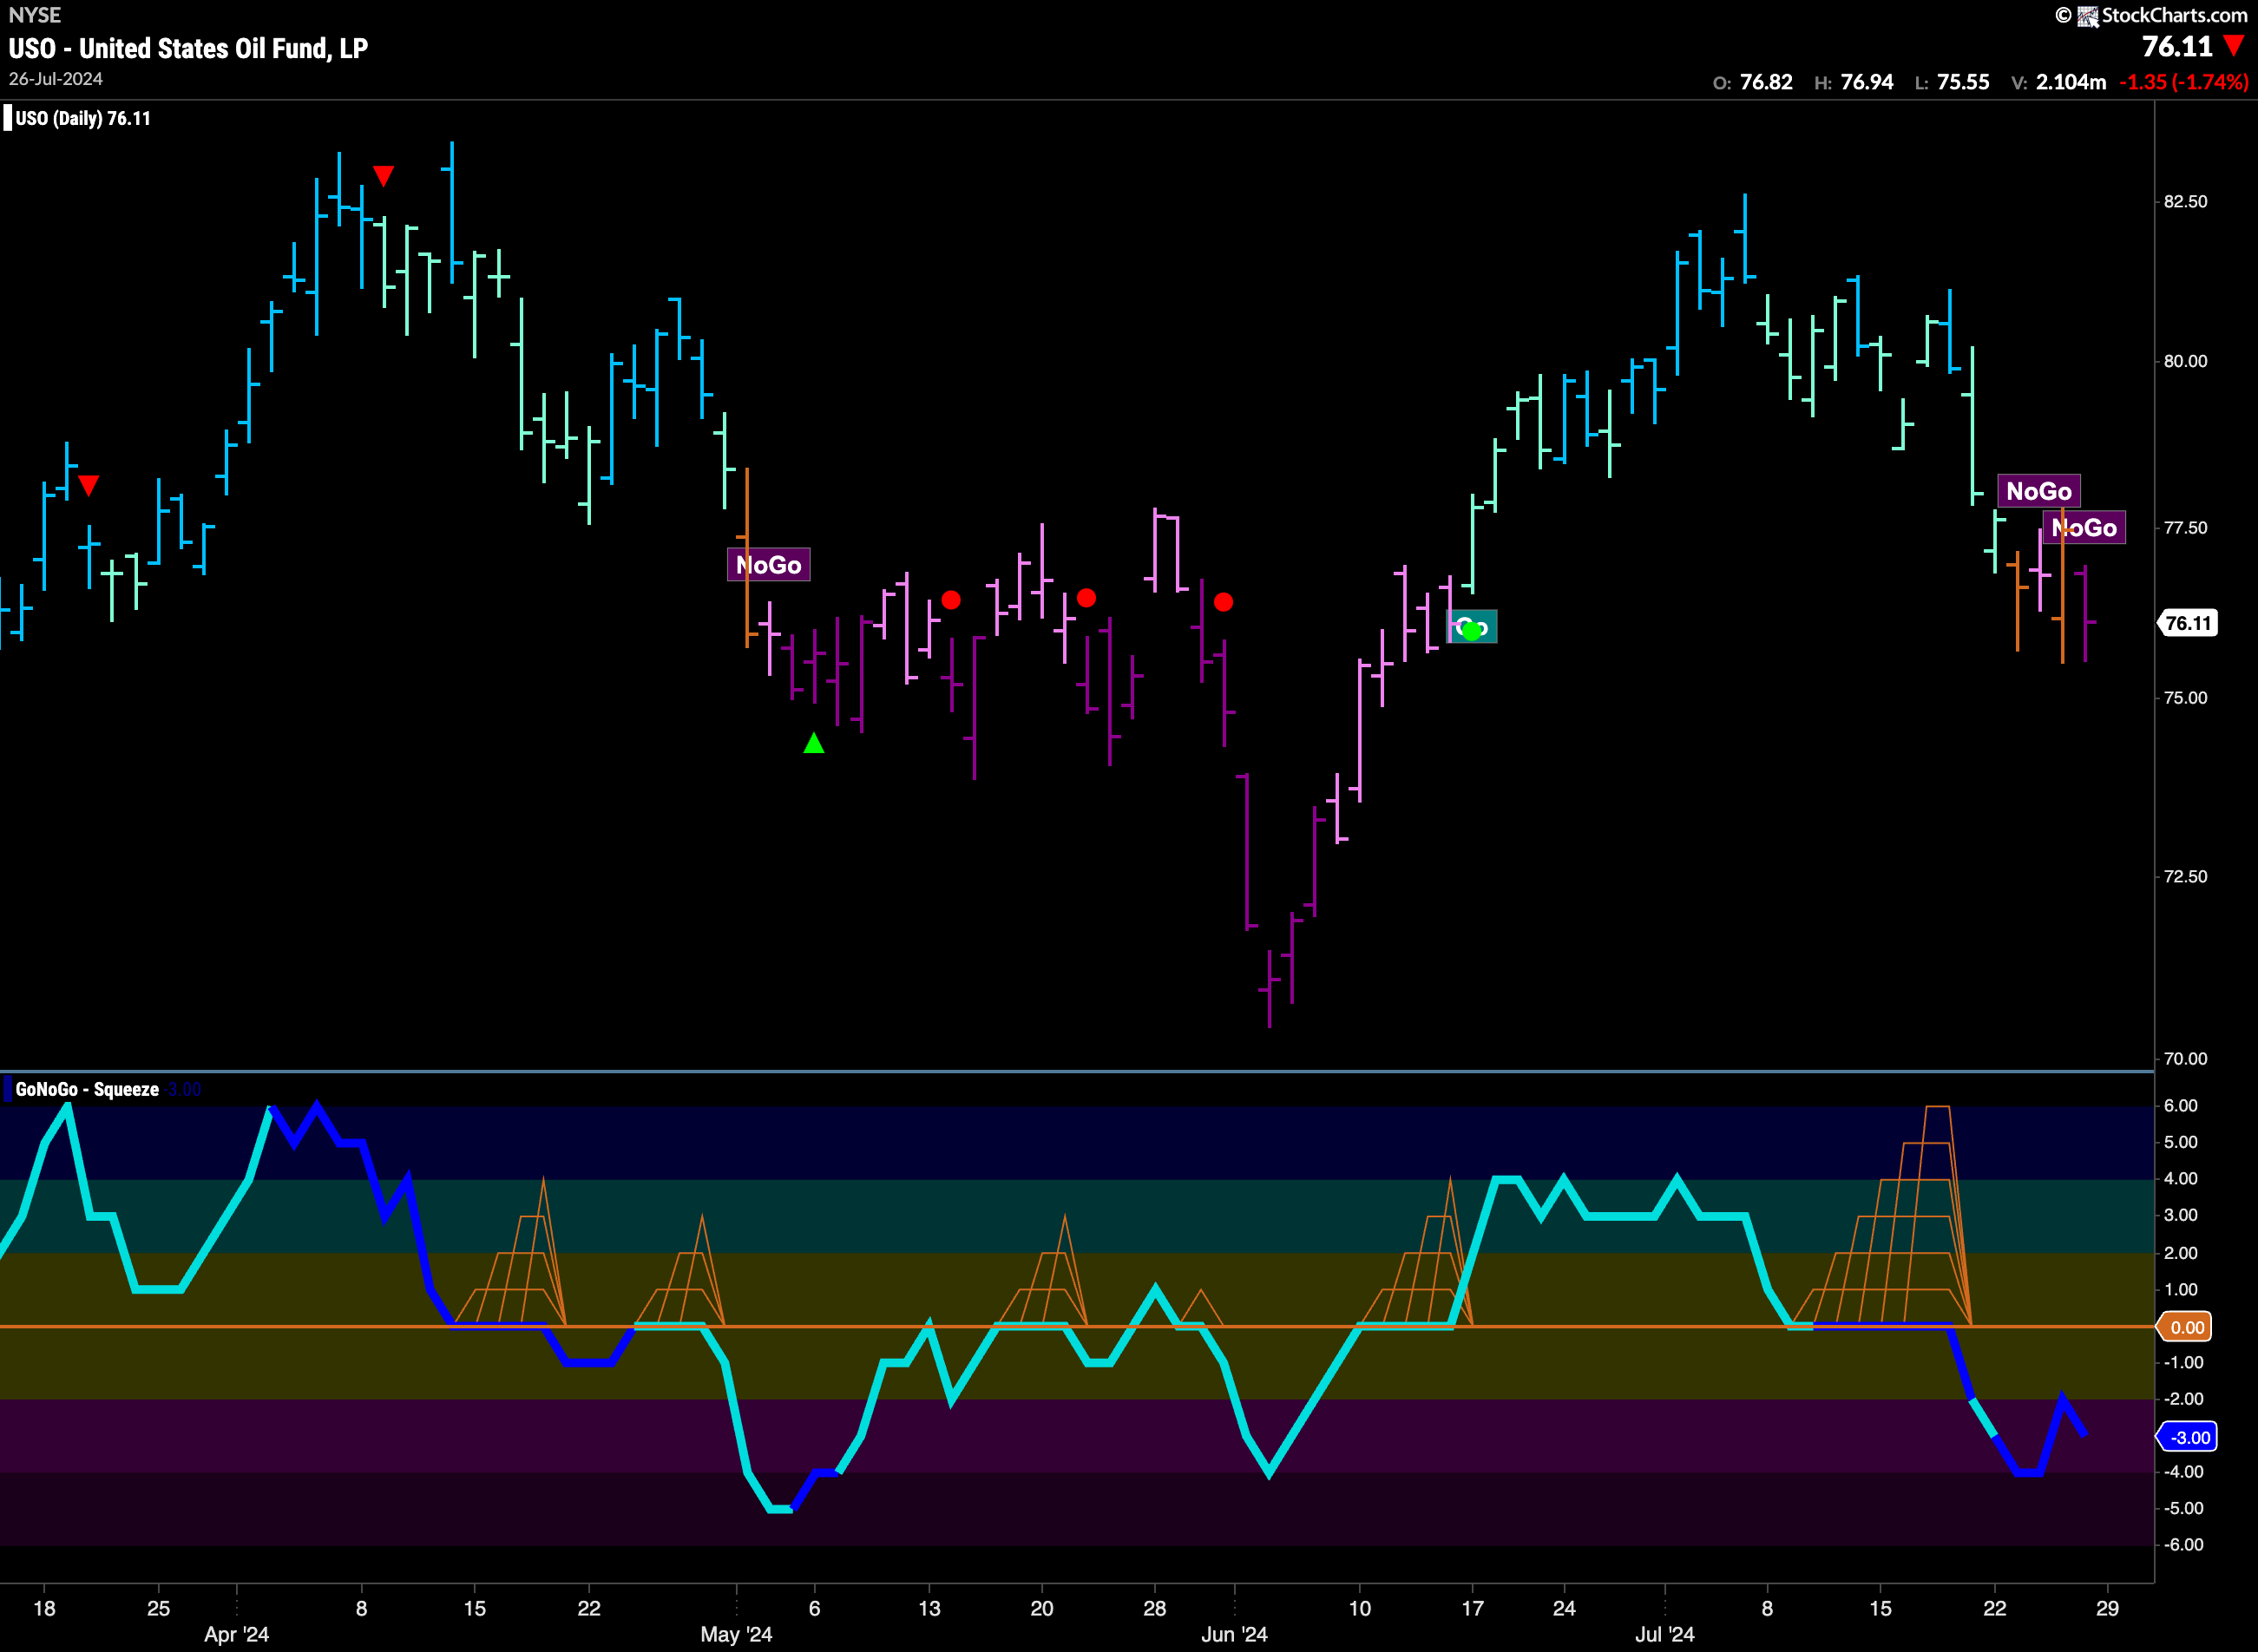
USO Caves to Pressure of a New “NoGo”
We saw price fall lower this week and GoNoGo Trend mixed amber “Go Fish” bars of uncertainty with pink and purple “NoGo” colors. The week closed with the strong purple “NoGo”. This came after GoNoGo Oscillator broke out of a Max GoNoGo Squeeze into negative territory on heavy volume. This suggested the change in trend and now we see that the Oscillator is at a value of -3. Momentum is on the side of the new “NoGo”.
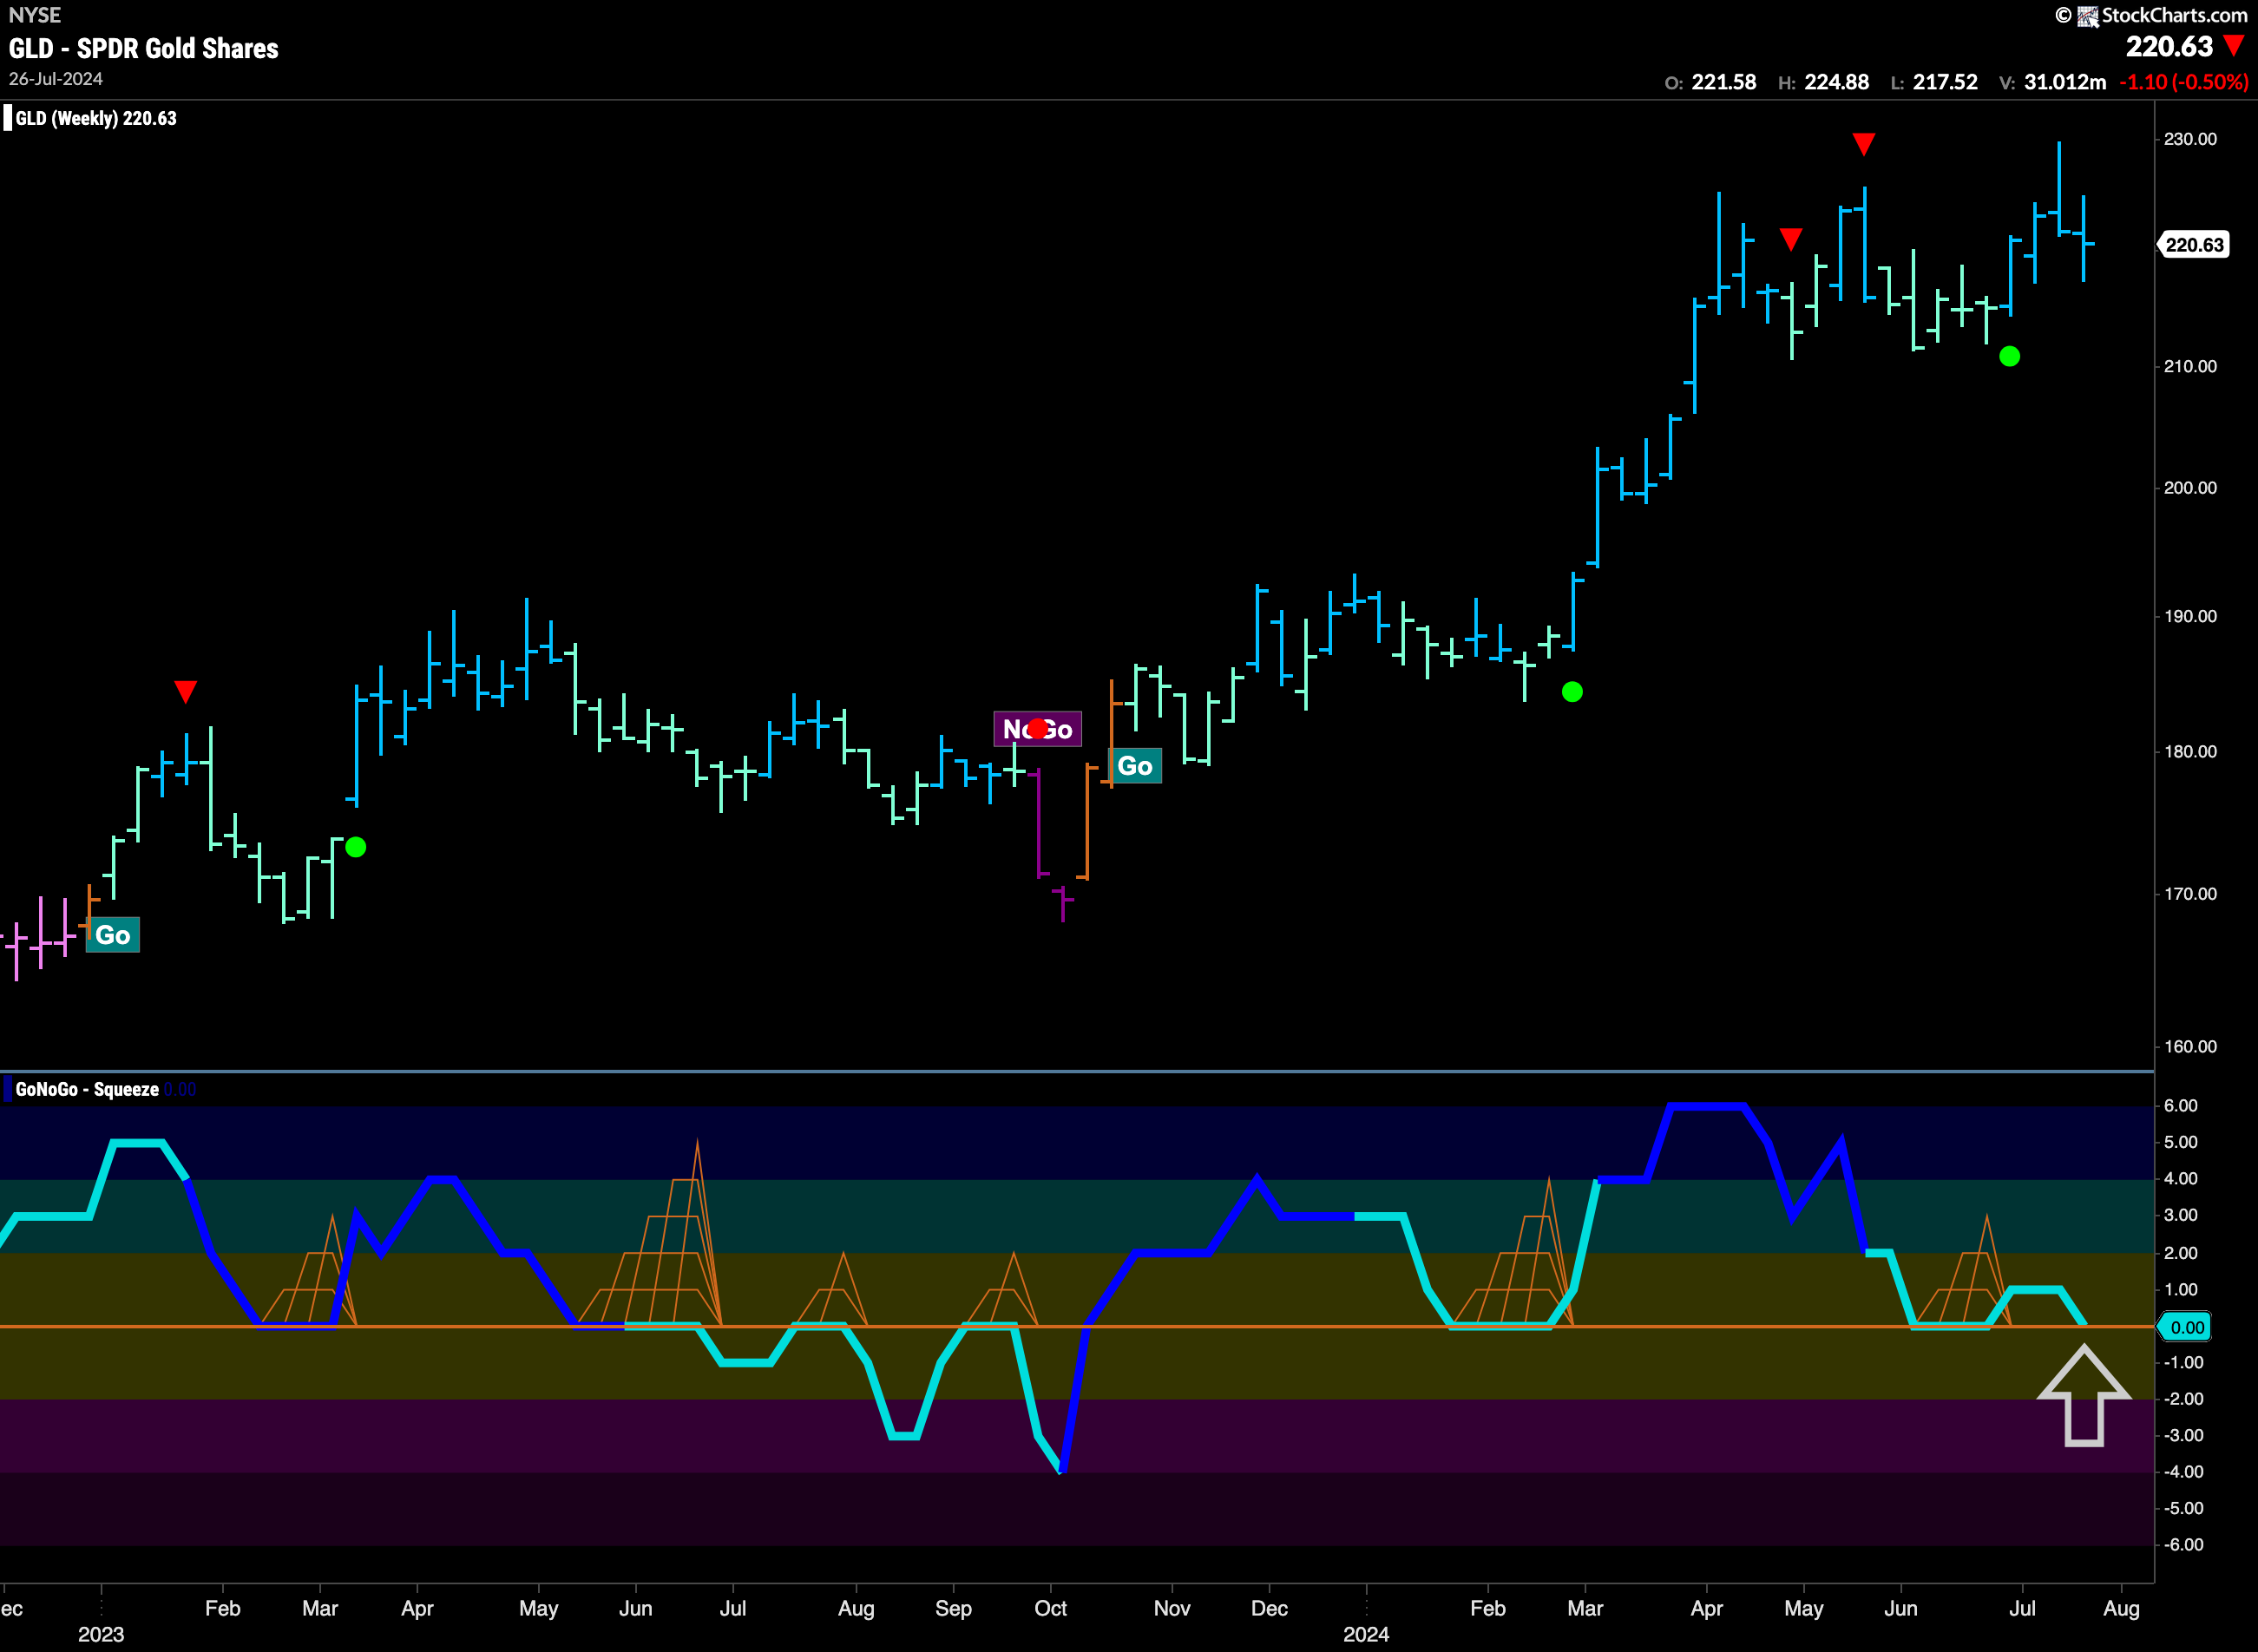
Gold Puts Pressure on Prior Highs
The weekly chart of Gold below that the trend is a strong “Go”. It is interesting to note that price was unable to set a new higher close after threatening to do so last week. Another strong blue “Go” bar ensures that the bulls are in control and we’ll look for further price movement to challenge for new highs. This will happen if GoNoGo Oscillator finds support at the zero line and can rebound back into positive territory.
Sector RelMap
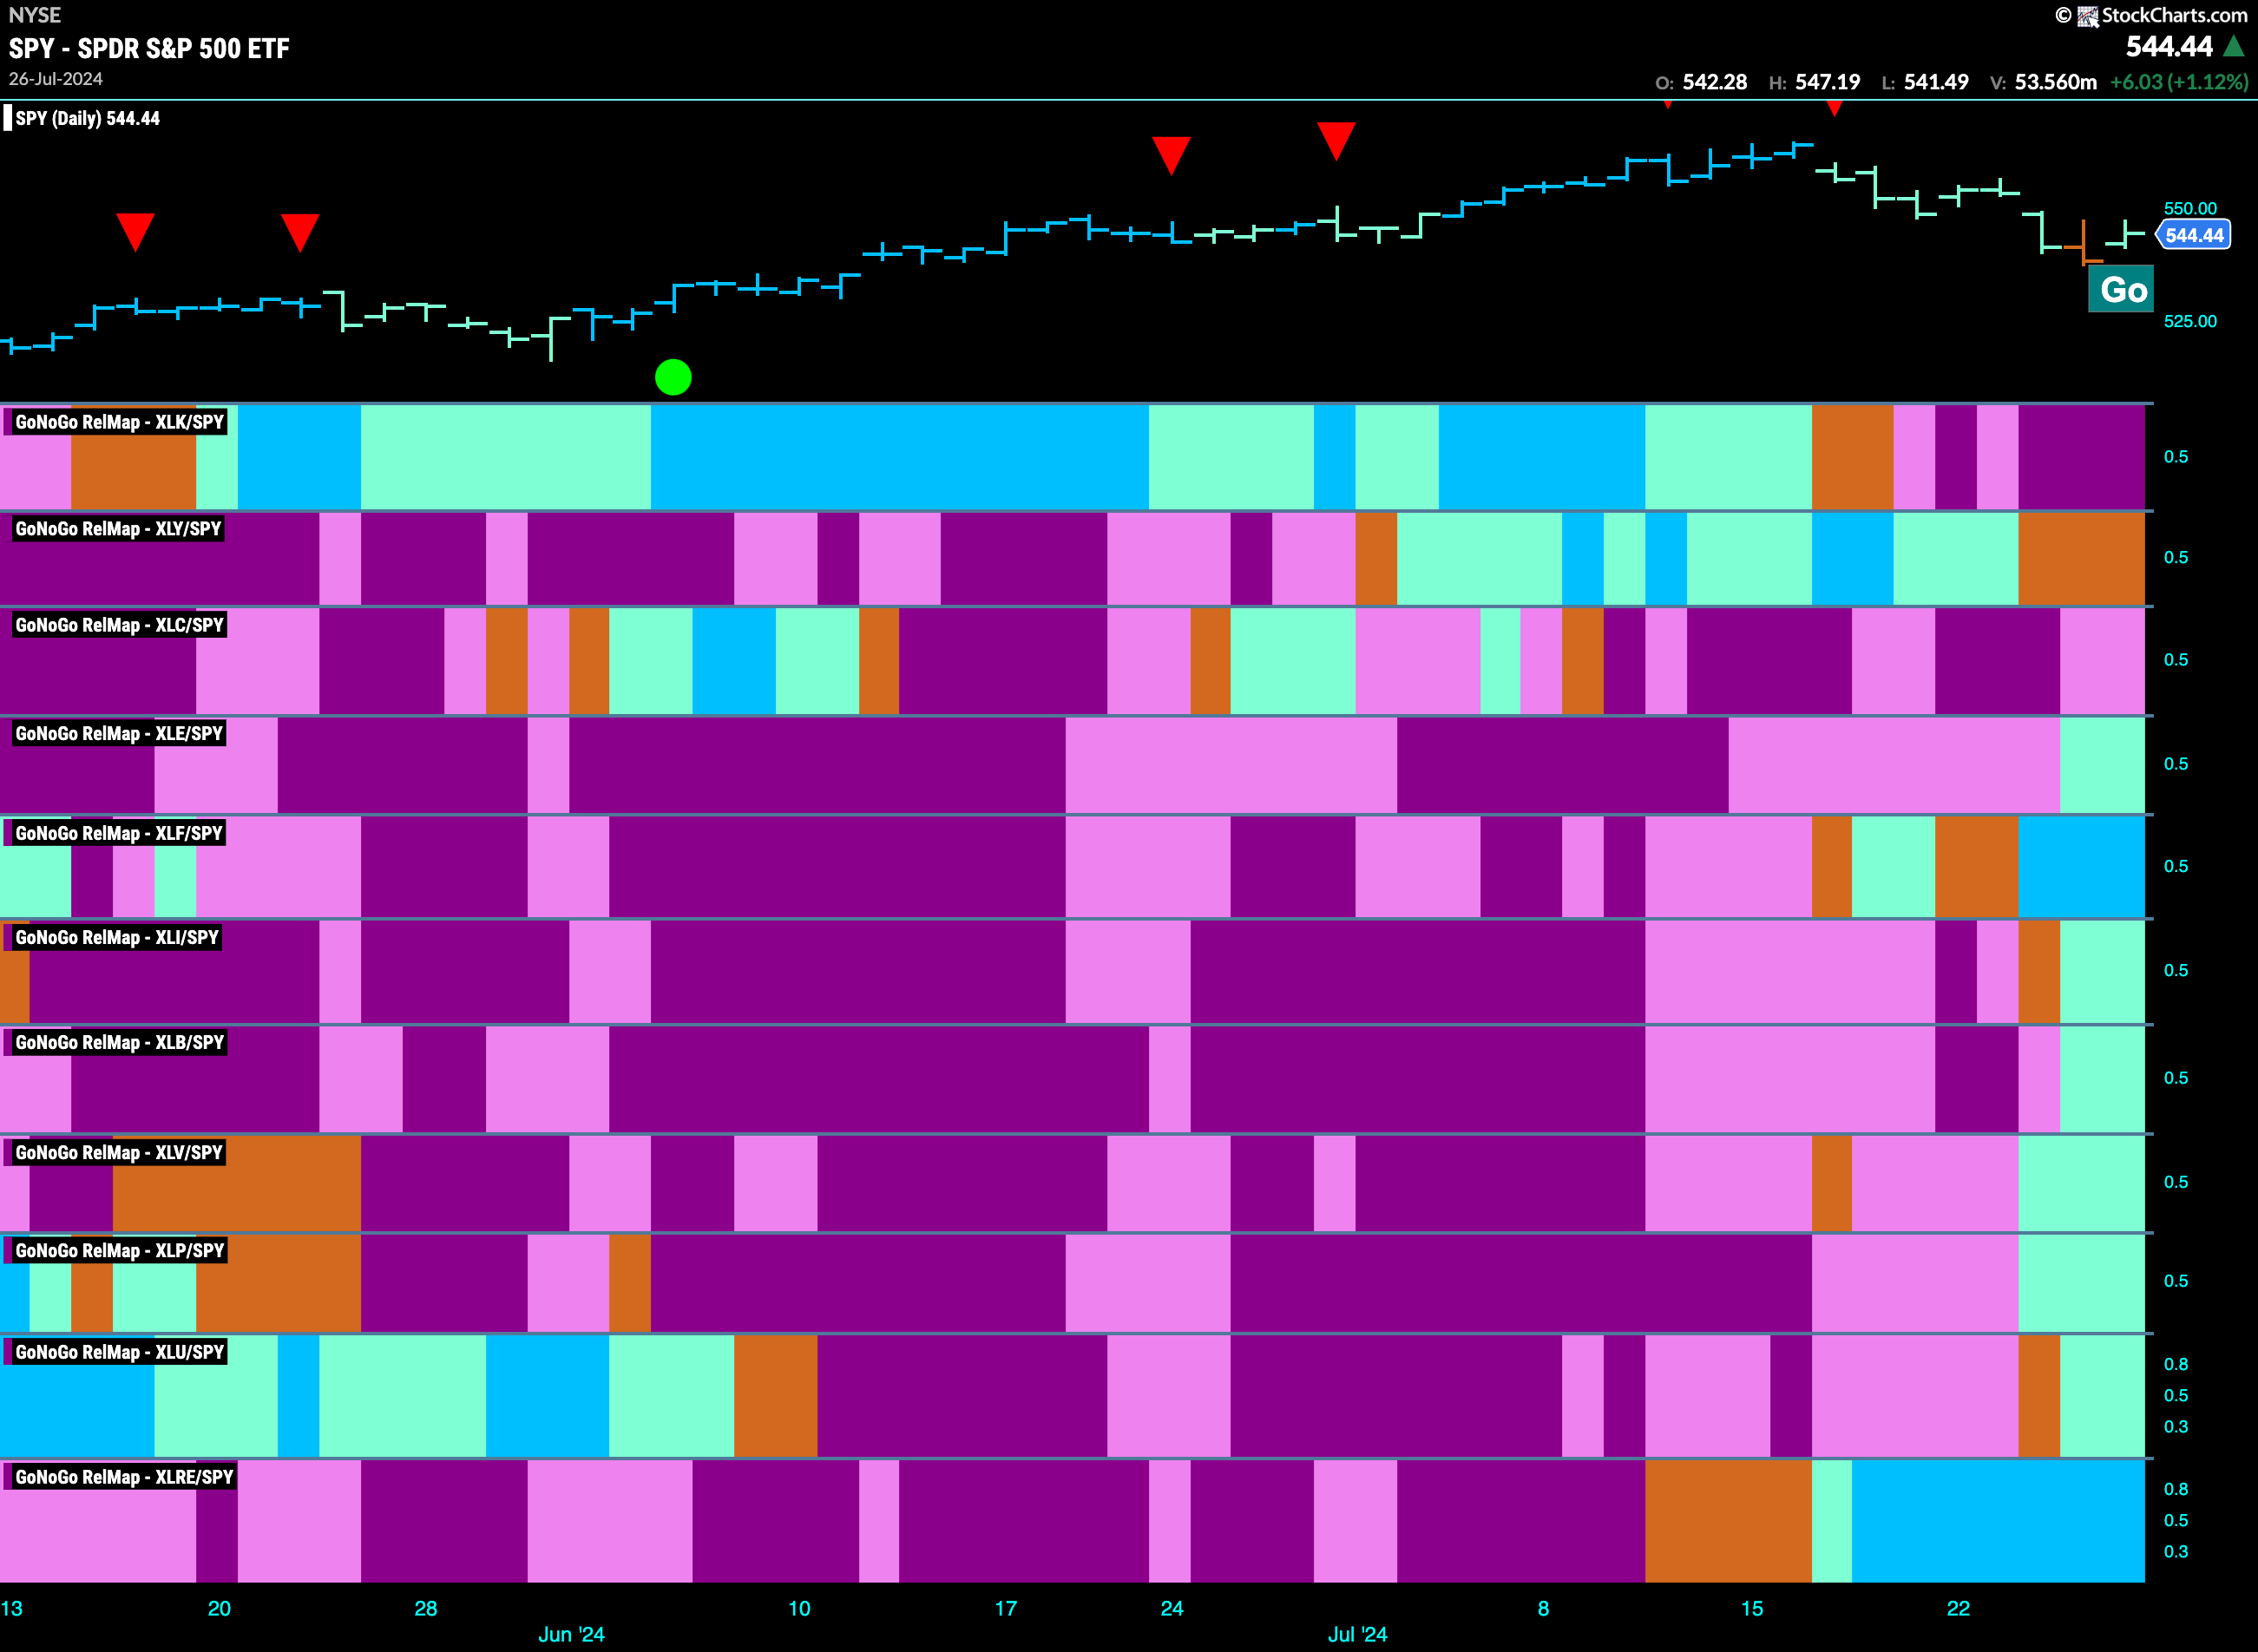
Below is the GoNoGo Sector RelMap. This GoNoGo RelMap applies the GoNoGo Trend to the relative strength ratios of the sectors to the base index. Looking at the map, we can see that 8 sectors are outperforming the base index this week. $XLE, $XLF, $XLI, $XLB, $XLV, $XLP, $XLU and $XLRE are painting relative “Go” bars.
The Financials Sector Sees Strength
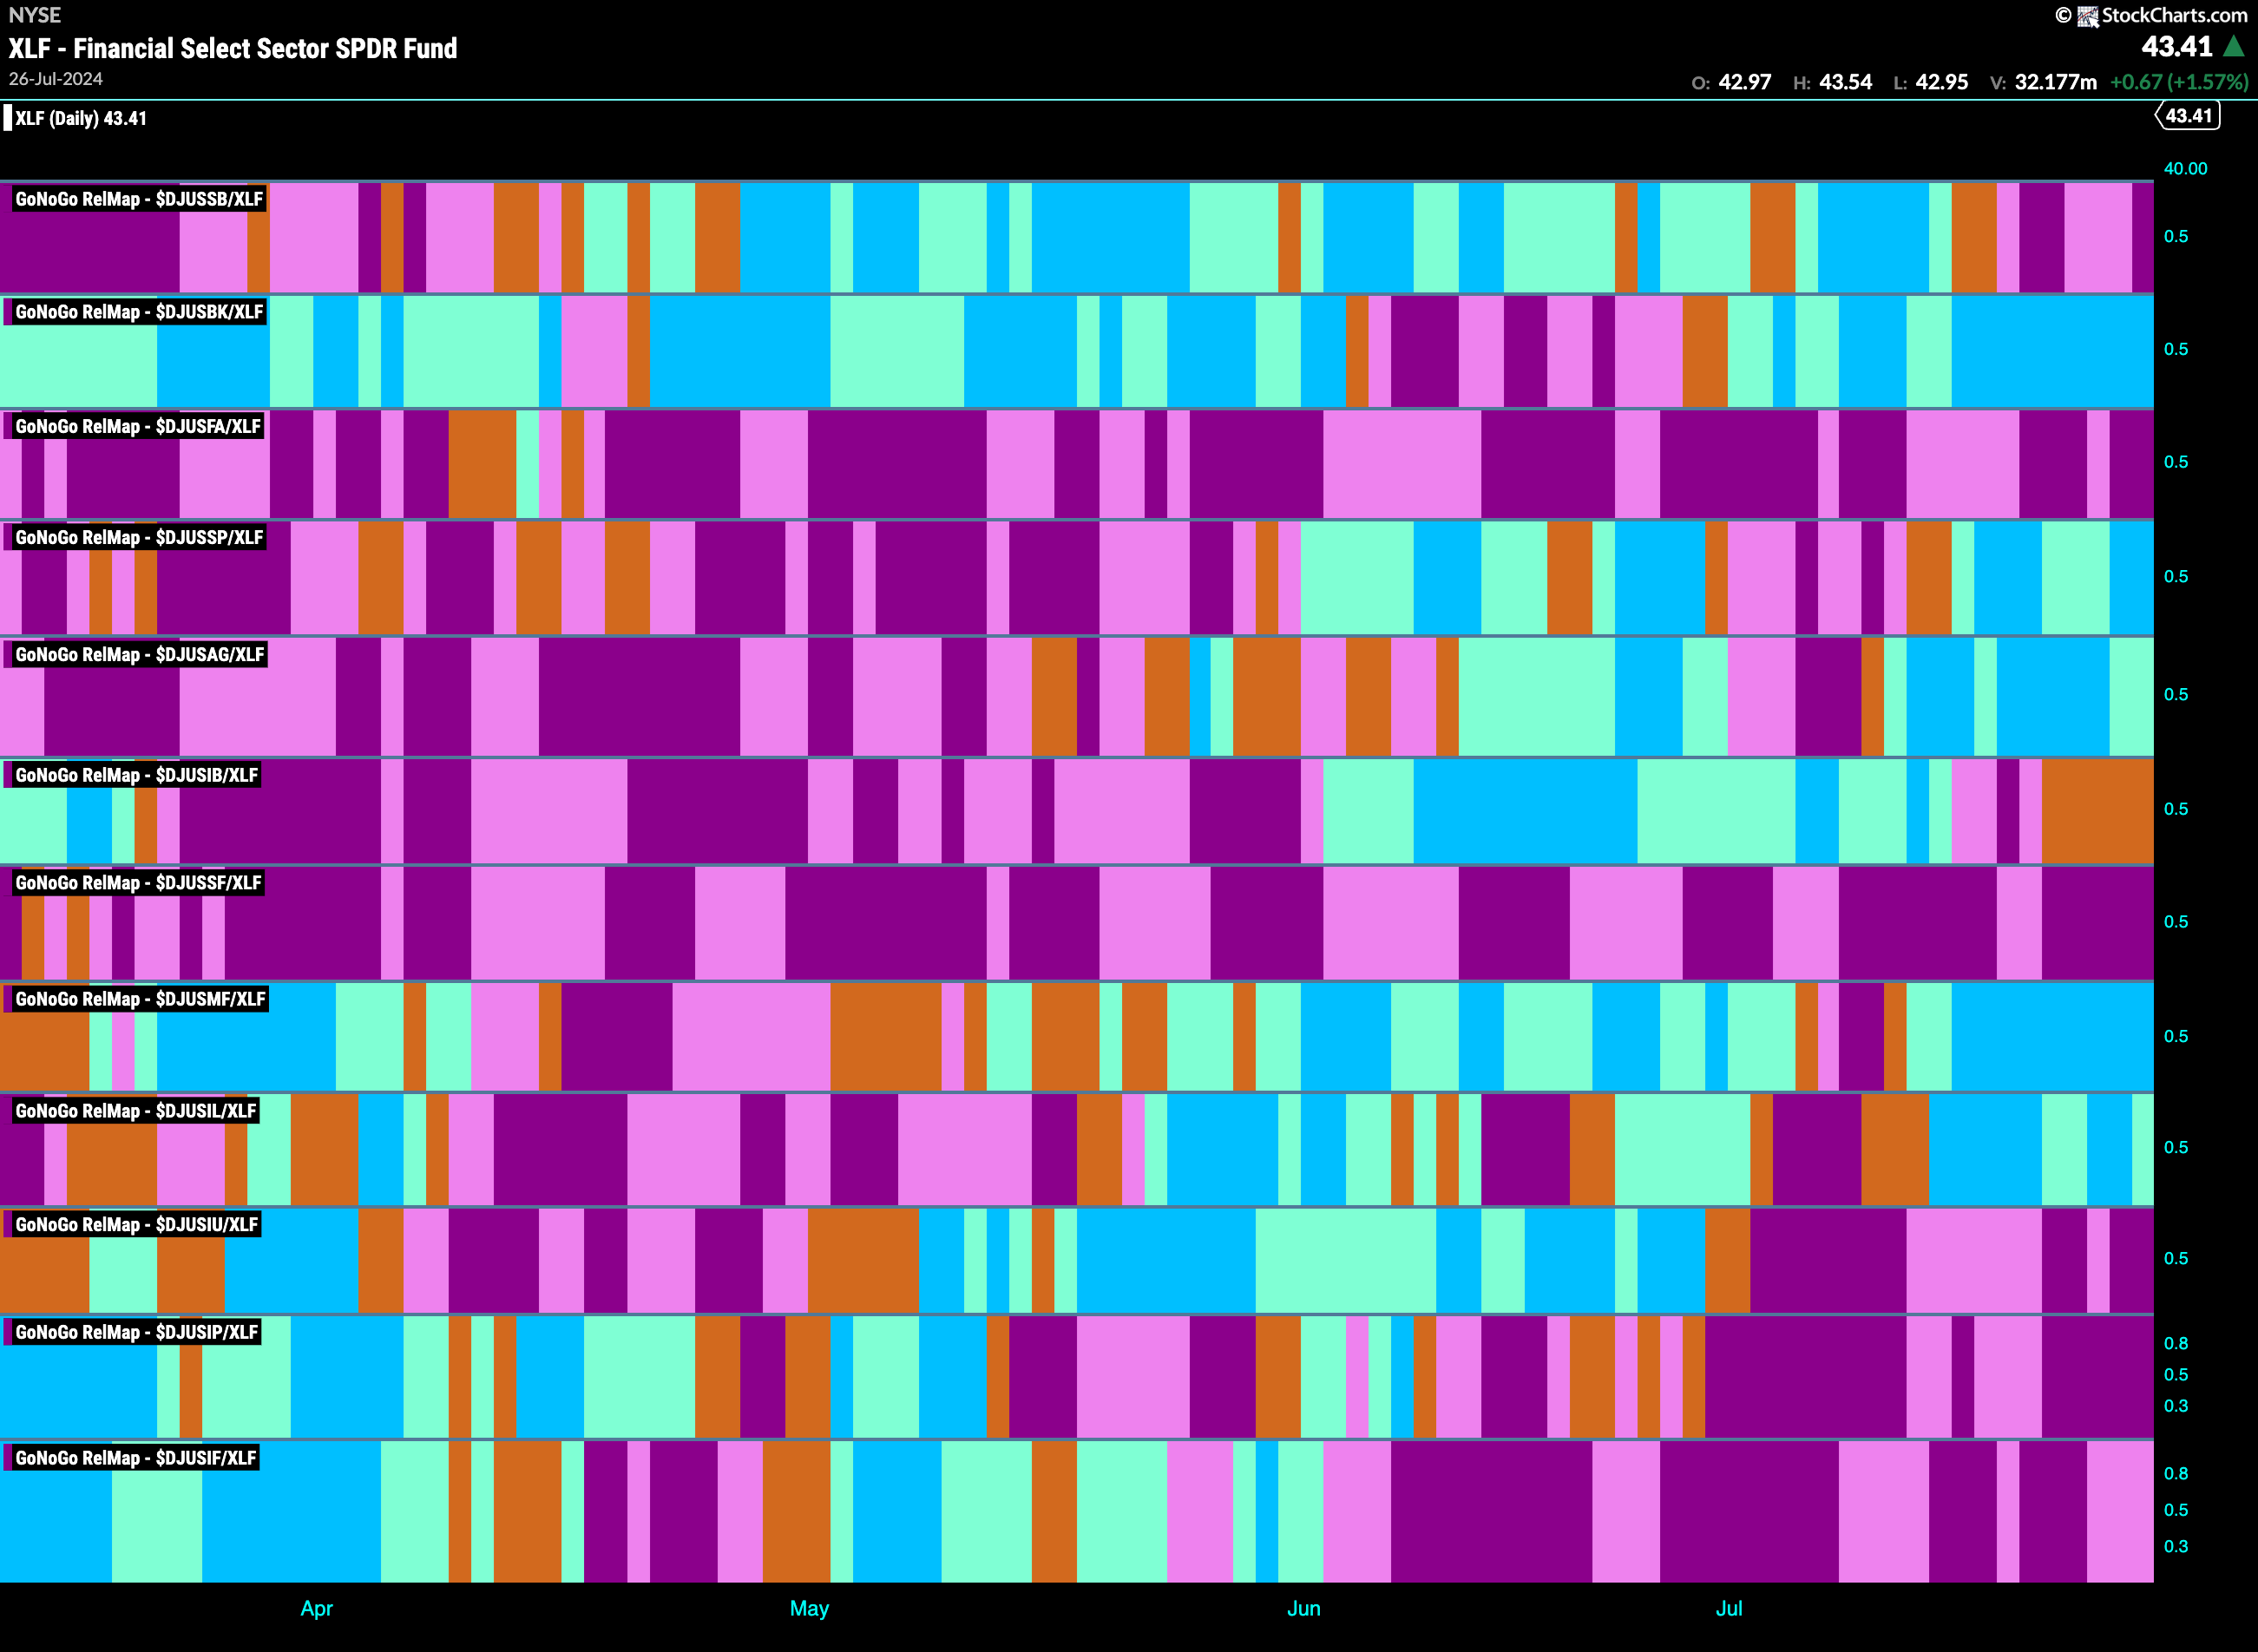
On a relative basis, we saw in the above GoNoGo Sector RelMap that the financials sector was able to maintain strong blue “Go” bars for the entire week. This prompts us to look again at the sector and inside its makeup to see where that relative strength is coming from. There are several sub groups that have began relative “Go” trends but the banks sub group has been in a “Go” trend the longest and is painting strong blue bars.
$KB Breaks to New Highs
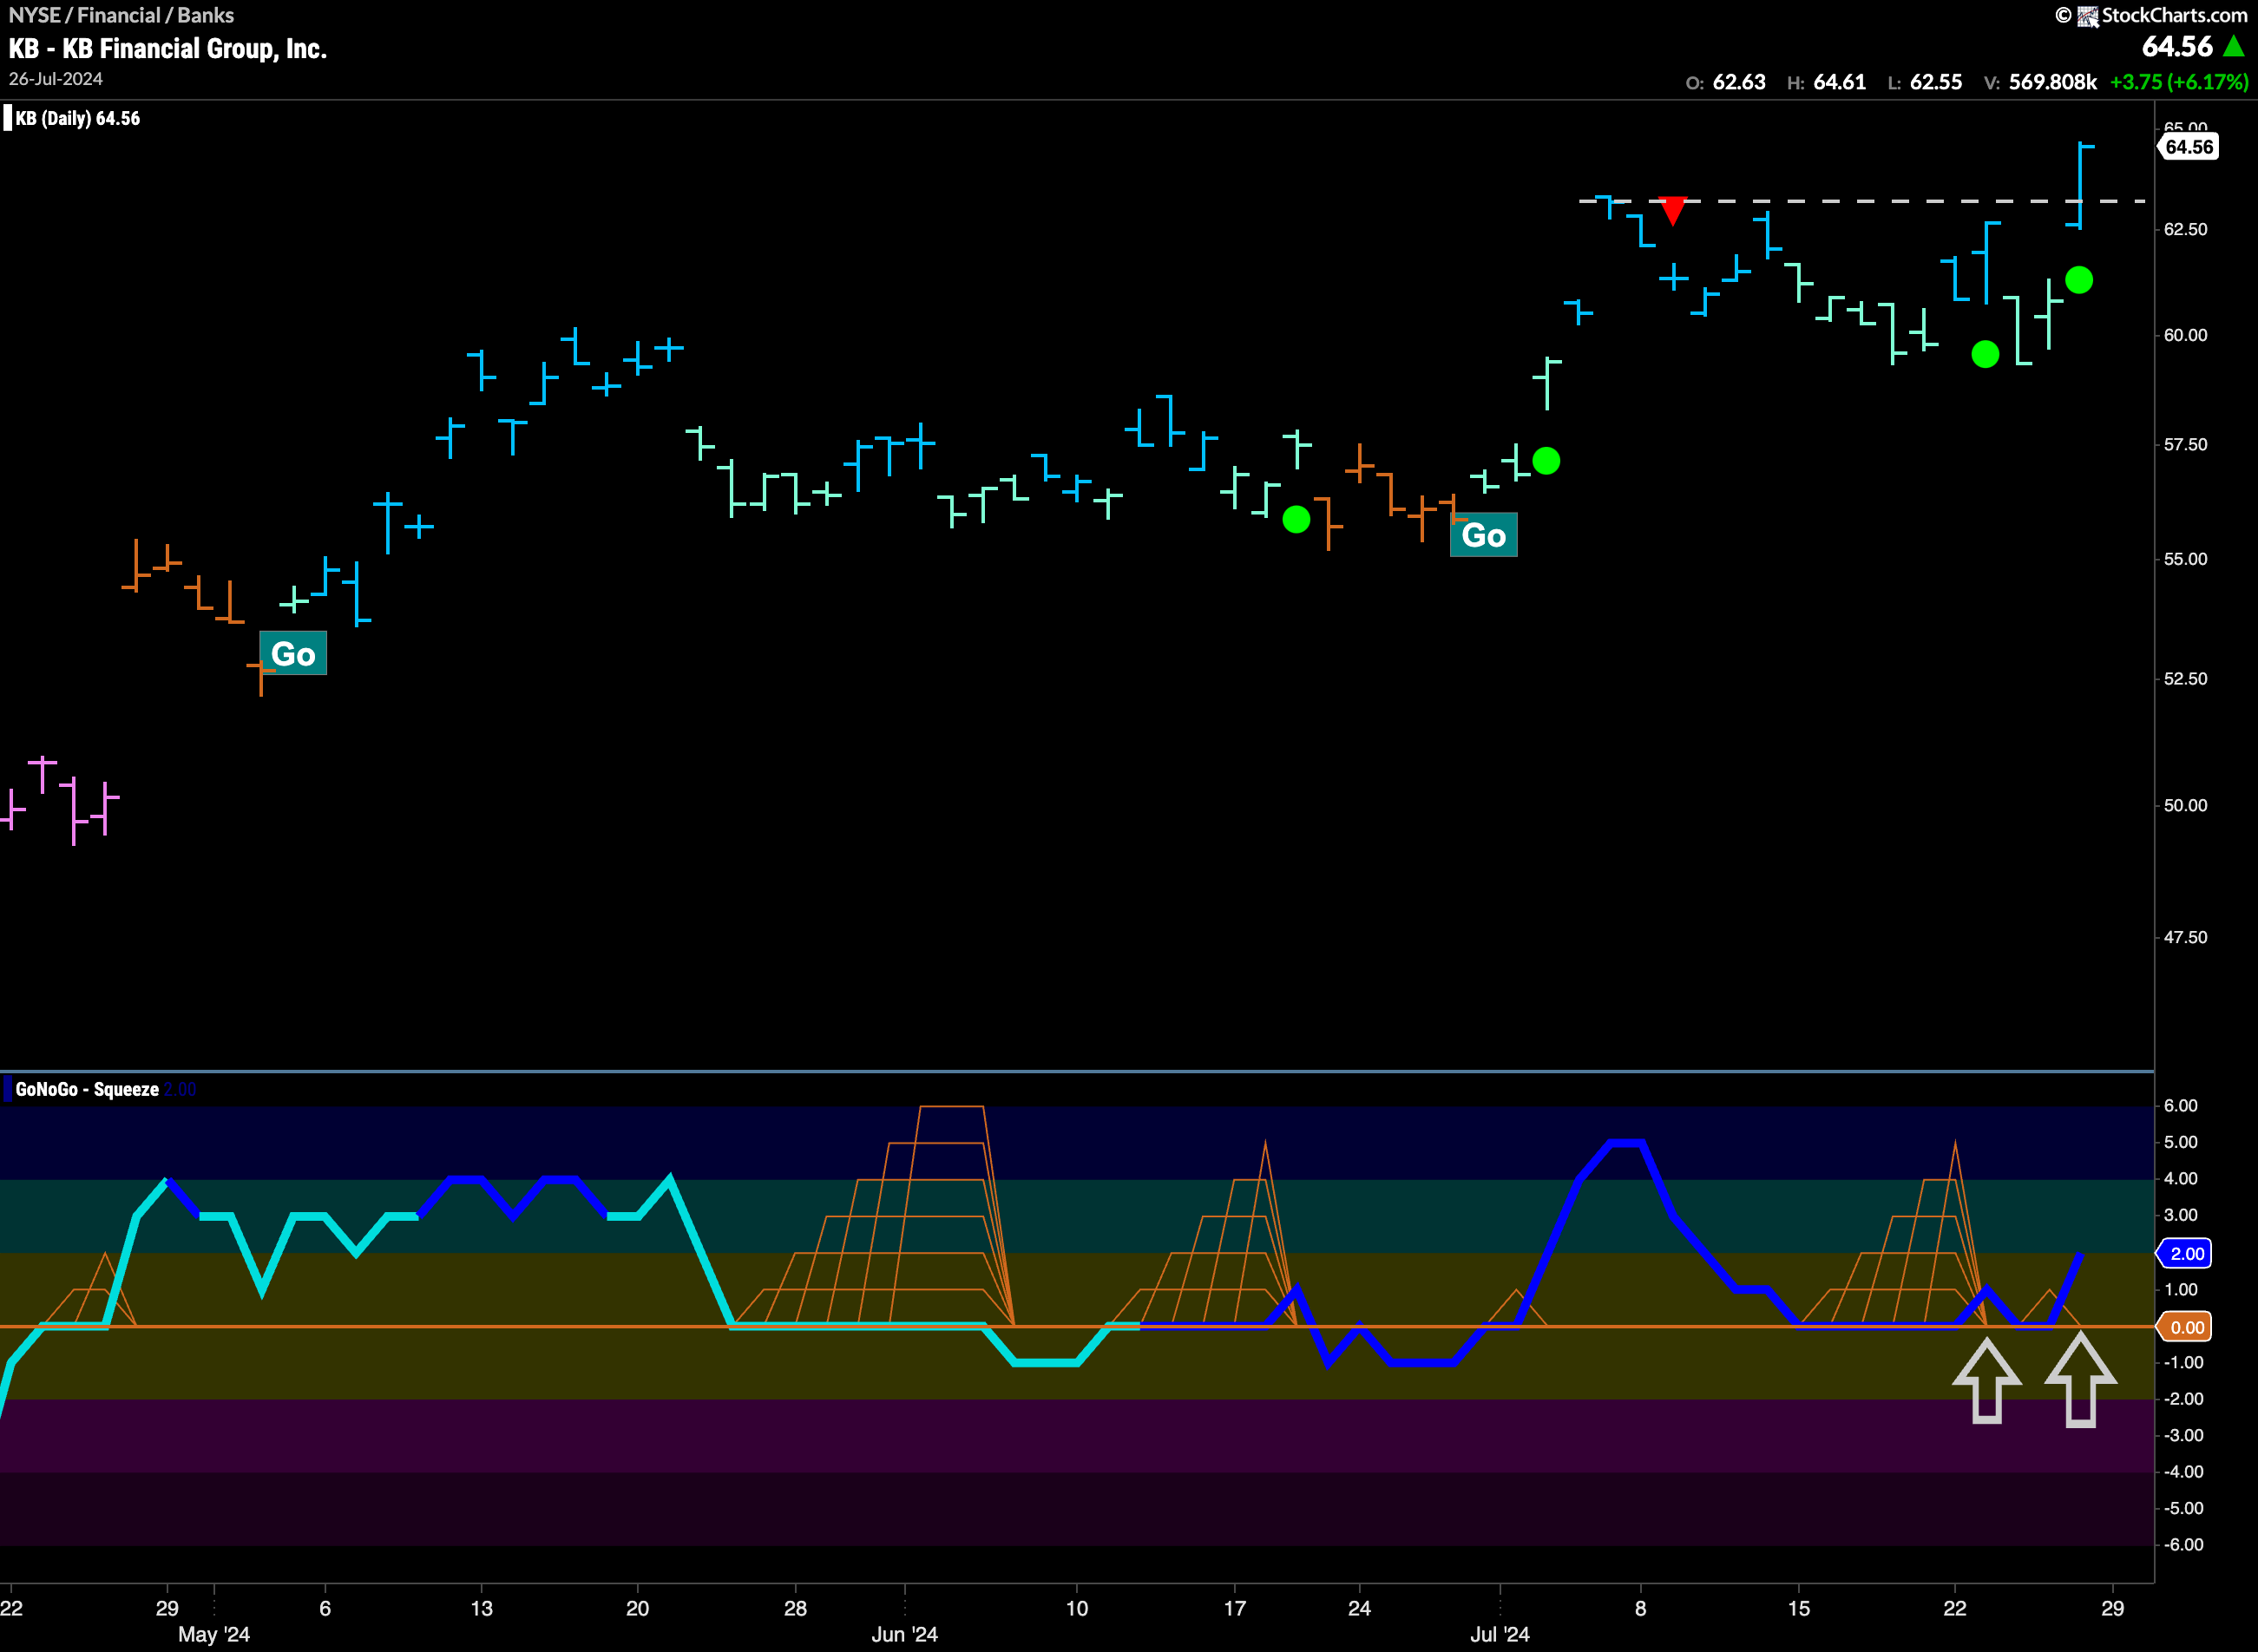
$KB has received a push from momentum and price has jumped to a new high. We can see that after a Go Countertrend Correction Icon (red arrow) price moved mostly sideways for a few weeks. GoNoGo Trend painted many weaker aqua bars and GoNoGo Oscillator fell to test the zero line. It remained there for several bars allowing the climbing grid of GoNoGo Squeeze to rise. As the Oscillator broke out of the Squeeze into positive territory we saw Go Trend Continuation Icons on the chart which told us the “Go” trend was healthy. Now, with a strong blue “Go” bar, price is making a new high with momentum on its side.
$CUBI Breaks out of Continuation Pattern
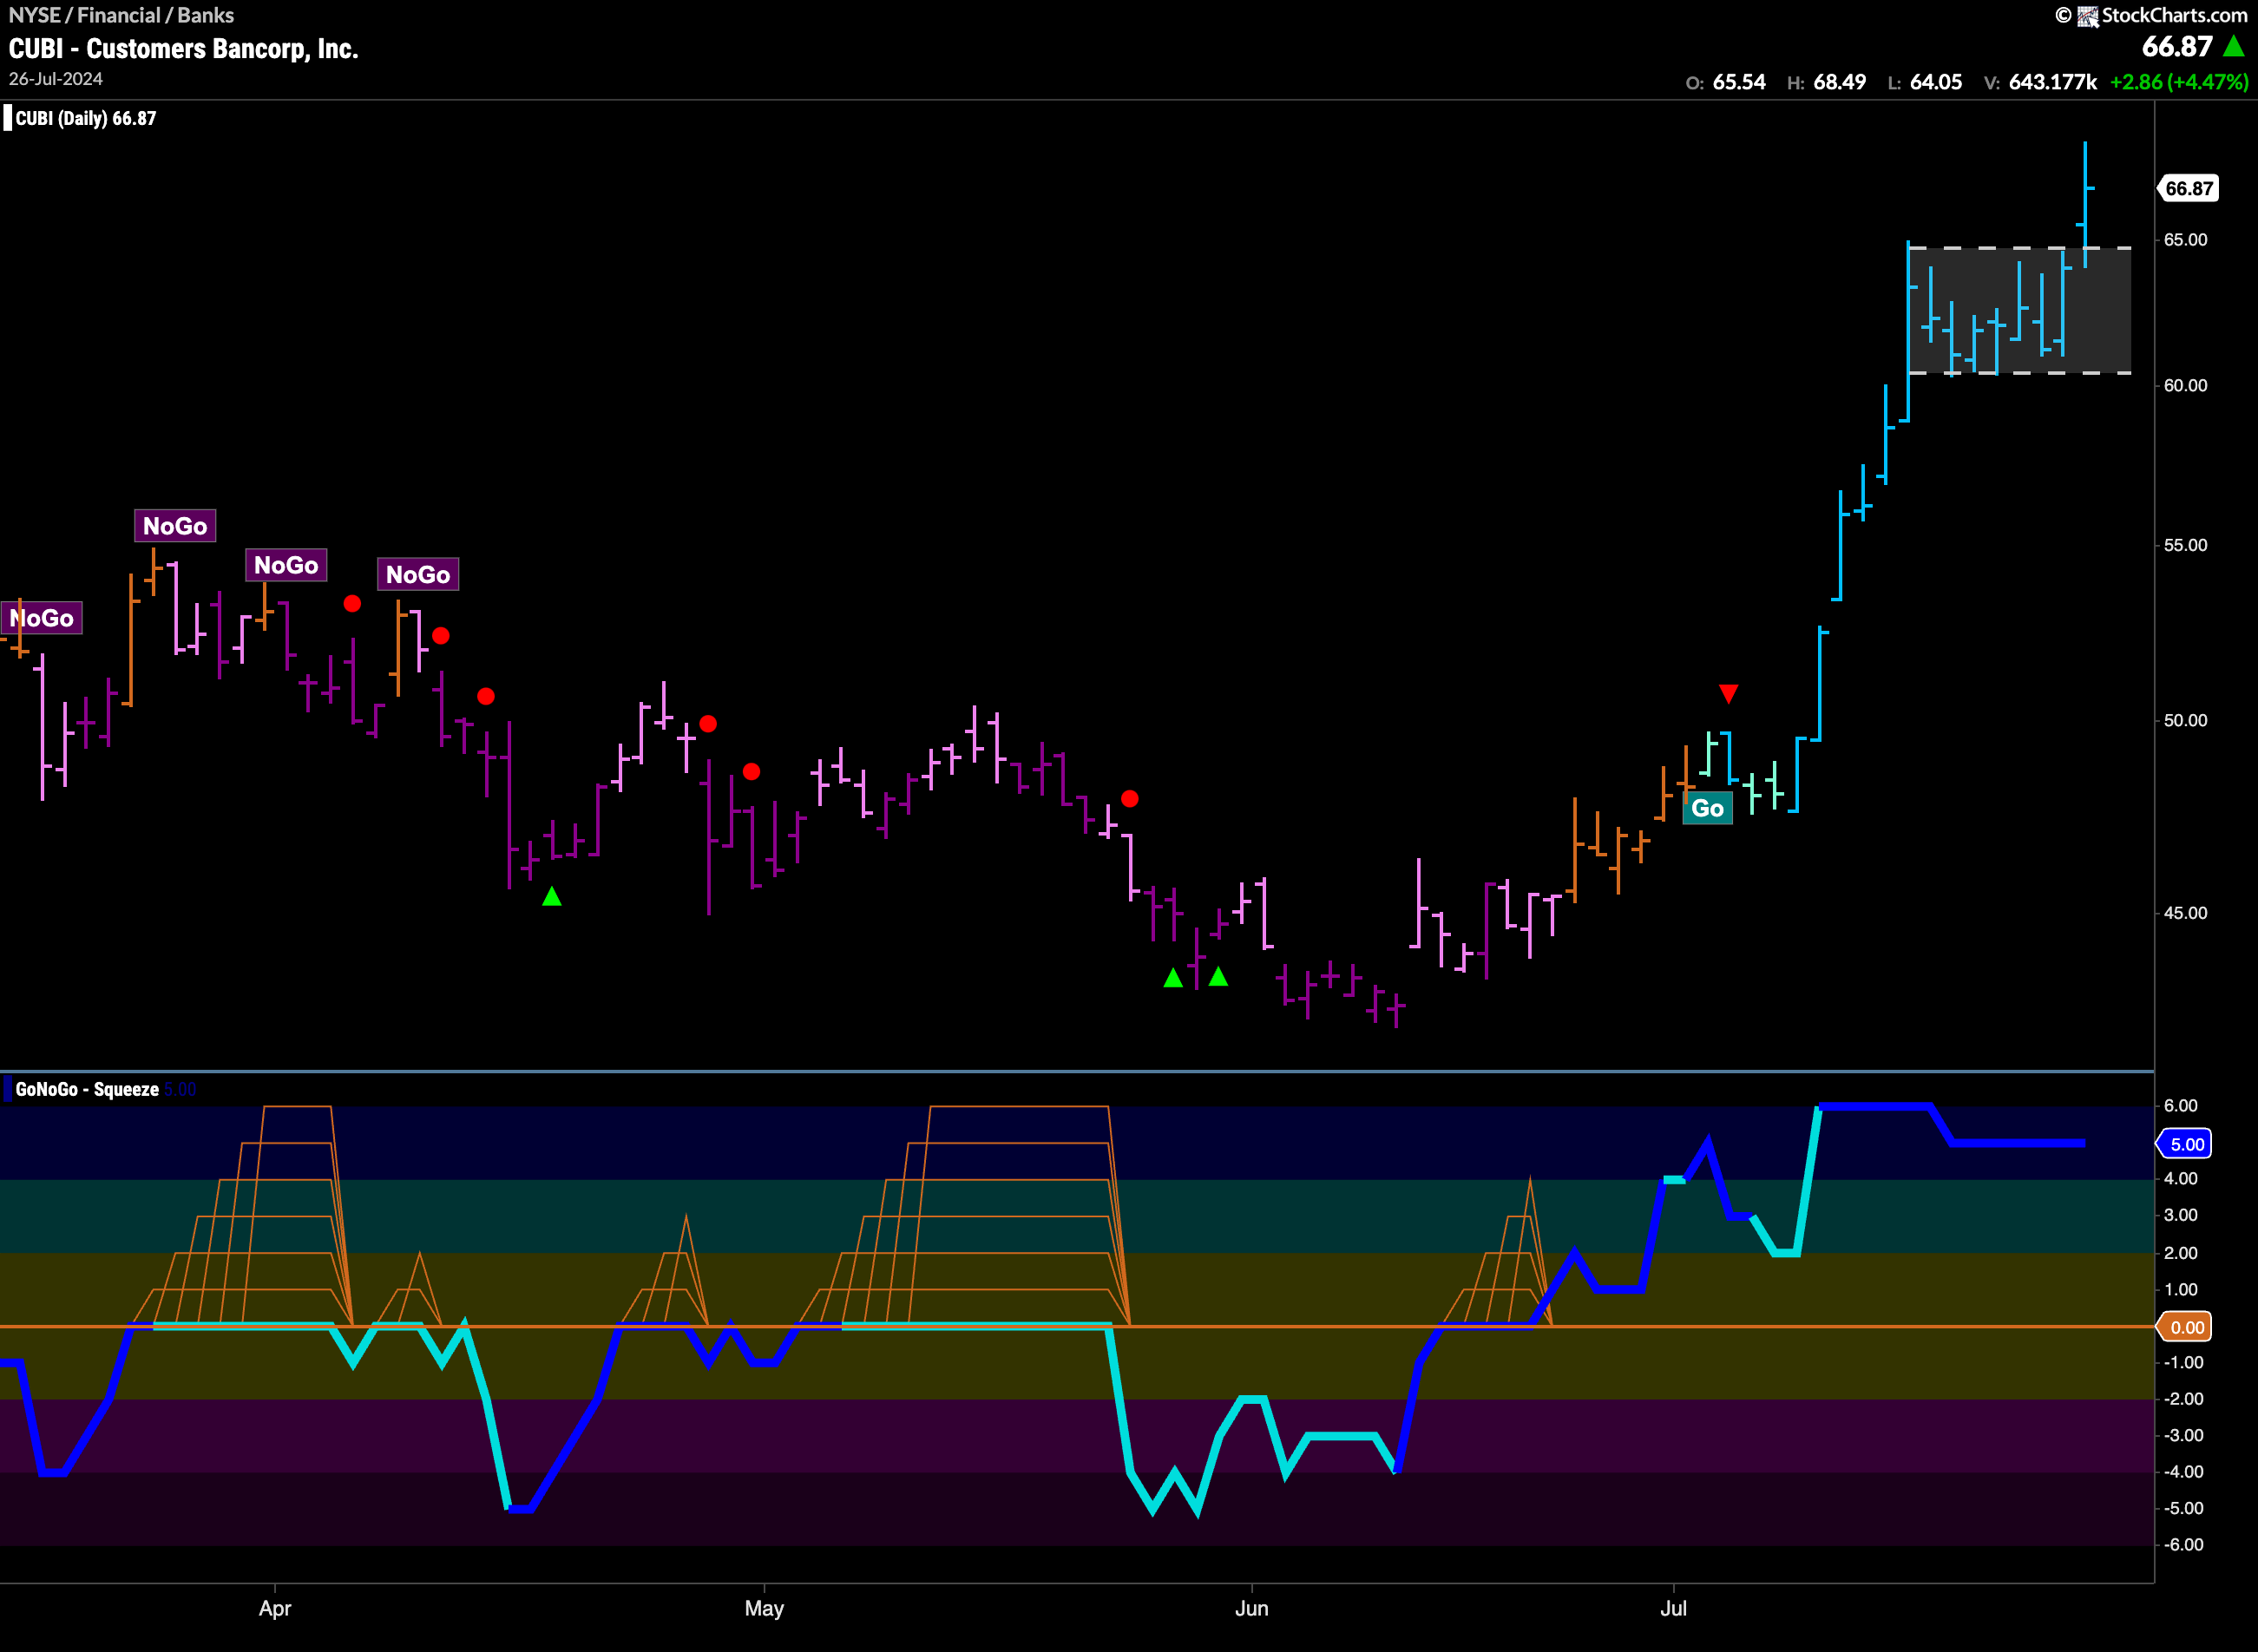
$CUBI saw price move sideways for over a week and that allows us to highlight the area on the chart with a small channel annotation. On the last bar of the week, price was able to break higher. What is interesting in this chart is that GoNoGo Oscillator has not dropped out of overbought territory for the duration of the sideways movement. We will want to see price consolidate at these new levels. As price does that, we will watch the Oscillator to see if it can stay at or above zero. Then we can look for price to climb.
