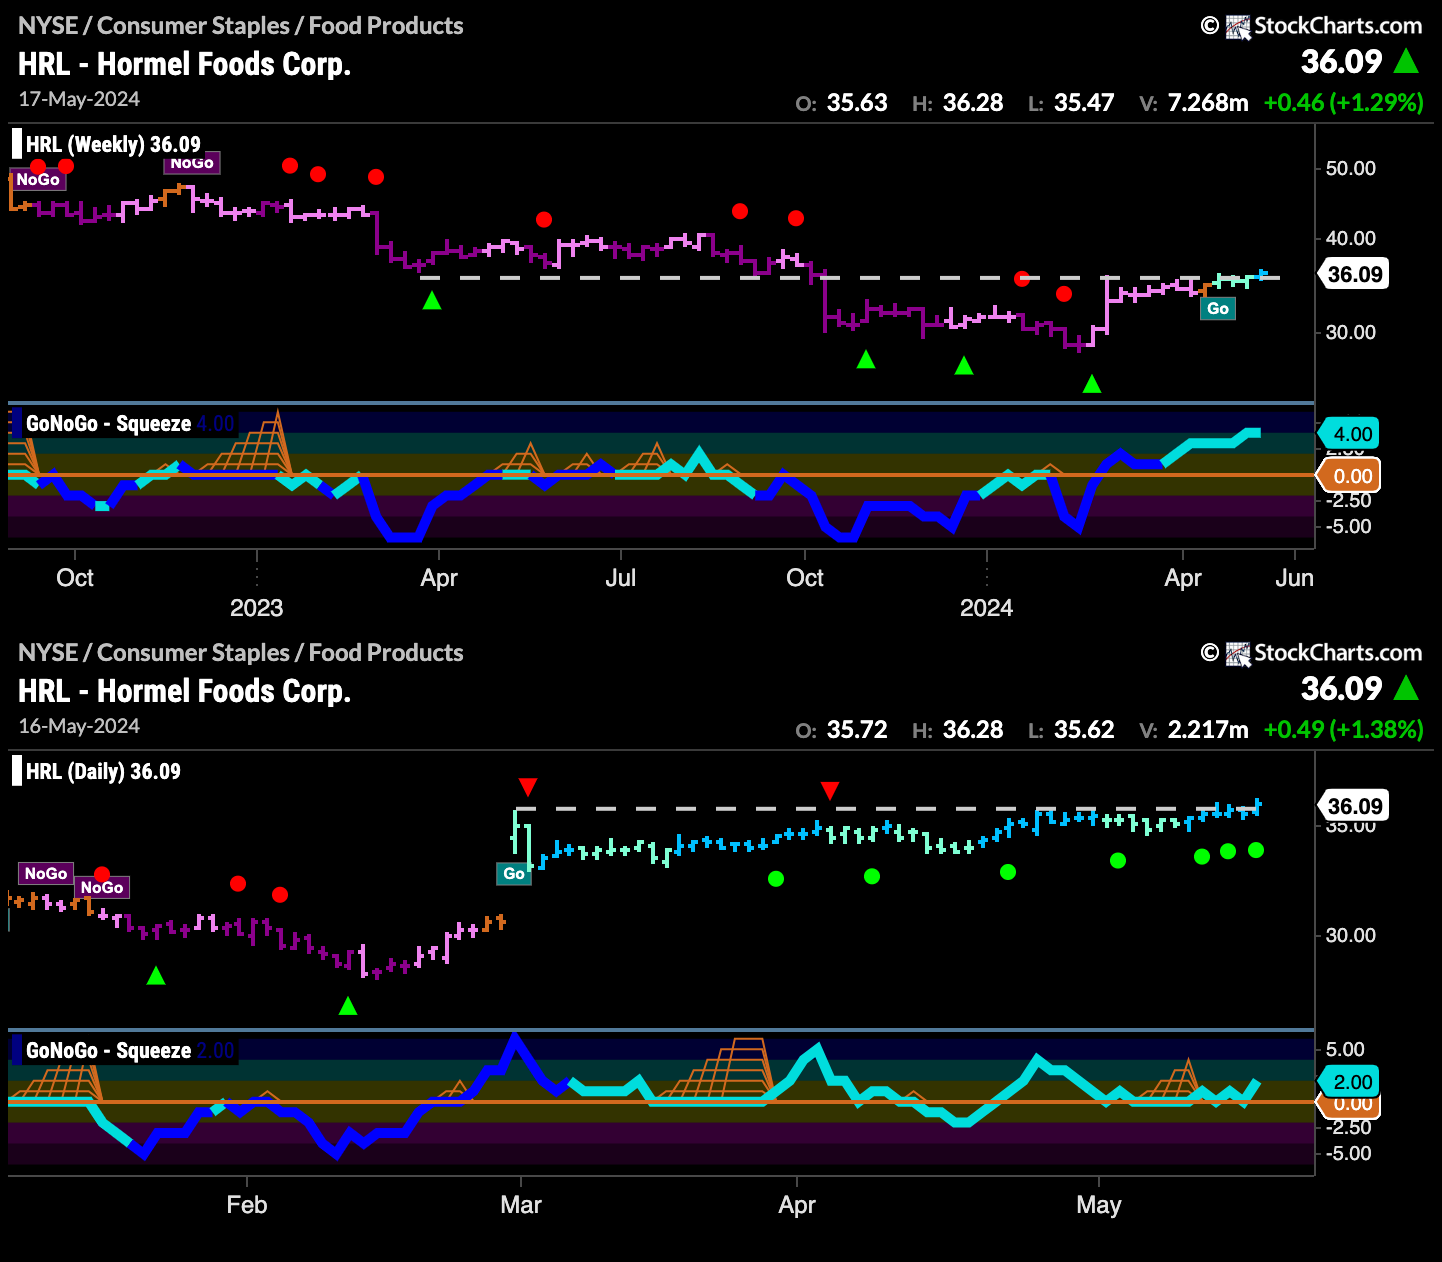
$HRL is in a daily and weekly “Go” trend as you can see in the charts below.
The second chart below shows the GoNoGo Suite of tools applied to daily prices and you can see that since gapping higher at the very beginning of March into the “Go” trend, price has moved sideways since. GoNoGo Trend has been able to hang on to “Go” colors, and GoNoGo Oscillator has been able to predominantly find support at the zero line. Most recently, as price runs up against horizontal resistance, we see that the oscillator has tested the zero line several times and each time has found support. We will watch to see if this renewed momentum will give price the push it needs to break to new highs. If we look at the top, longer, weekly chart, we can see how strong this resistance is, as it comes from over a year ago. The concept of polarity tells us that what was once support can become resistance and we see that here. However, with a new “Go” on the weekly trend and GoNoGo Oscillator in positive territory, we may see a sustained attempt for price to set a new high.


