
Good morning and welcome to this week’s Flight Path. We saw some resolution of the uncertainty in the markets this past week. Equities came out of a string of amber “Go Fish” bars to paint an aqua “Go” bar on Friday. The $SPY is a “Go”. However, as we’ll see, there remain some concerns over the strength of this move off the lows. Treasury bond prices remained in a “NoGo” but painted another complete week of weaker pink bars. The U.S. commodity index was unable to trend, as we saw amber “Go Fish” bars dominate again this week. The dollar remained in its “Go” trend and we saw some strength later in the week as blue bars returned.

$SPY Enters a “Go” Trend
After a week of amber “Go Fish” bars representing uncertainty, we saw a fresh “Go” trend emerge on the last day of the week as GoNoGo Trend painted an aqua bar. This is the first of the “Go” colors, so we will want to see stronger blue bars follow. This came after GoNoGo Oscillator broke out of a Max GoNoGo Squeeze into positive territory. This leading indication of positive momentum was a good sign as it told us that momentum was no longer on the side of the prior “NoGo” trend.

The larger weekly chart is very positive. After a period of weaker aqua “Go” bars that followed the Go Countertrend Correction Icon (red arrow) we have seen a blue “Go” bar return. This coincides with GoNoGO Oscillator finding support at the zero line. We now can say that momentum is resurgent in the direction of the “Go” trend. The green circle we see on the chart is a Go Trend Continuation Icon, visually informing us that momentum is confirming the underlying “Go” trend. We will look for price to make an attempt at a new higher high over the next few weeks.

Rates Stabilize at Lower Levels
GoNoGo Trend painted another week of aqua “Go” bars. This tells us that the trend remains in place but we are seeing continued weakness. Price seemed to consolidate last week with not much movement higher or lower. This is after a drop that was preceded by GoNoGo Oscillator failing to find support at the zero level. GoNoGo Oscillator is now in negative territory but not yet oversold. This negative momentum is out of step for the “Go” trend and so we have some concerns about the health of the “Go” trend.

Dollar Looks for Support at Key Levels
The”Go” trend remains and indeed strengthened at the end of this past week. Price found support at prior high levels and rallied back through the gap we saw in April. Now, as price seems to have set a higher low, we see GoNoGo Trend painting stronger blue bars and GoNoGo Oscillator back testing the zero line from below. For this “Go” trend to remain strong, GoNoGo Oscillator will need to regain positive territory. If we see momentum turn positive that would give us a Go Trend Continuation Icon (green circle) under the price bar and we could expect price to climb to test new highs.

The weekly chart shows that we continue to find support at the horizontal levels we see on the chart that are coming in the form of prior highs. Having climbed above that level over the past month, it is important that price is holding and consolidating above. GoNoGo Trend shows that bright blue “Go” bars have remained and GoNoGo Oscillator is in positive territory but no longer overbought. We will watch to see if price can continue to find support here.

Oil in “NoGo” Trend
$USO shows that the new “NoGo” trend continued this week albeit with the GoNoGo Trend indicator painting weaker pink bars in the back half of the week. As price fell on Friday, GoNoGo Oscillator halted its run to the zero level and remained at a value of -1. We will be looking to see if the oscillator rolls over here and falls further into negative territory. If it does we would likely see price attempt a leg lower and set a new lower low.

Gold Found its Feet
$GLD saw an end to the string of weaker aqua bars this week and instead the GoNoGo Trend indicator painted a complete week of stronger blue bars. Price is still below the recent highs but once again is climbing after putting in what now looks like a higher low. GoNoGo Oscillator has returned to test the zero line from below. After its brief foray in to negative territory it will be a boon for the “Go” trend if it can recapture positive territory. We would then see a Go Trend Continuation Icon (green circle) as we would be able to say that momentum was resurgent in the direction of the underlying “Go” trend. Should this happen, we would look for price to make an attempt at a new higher high.

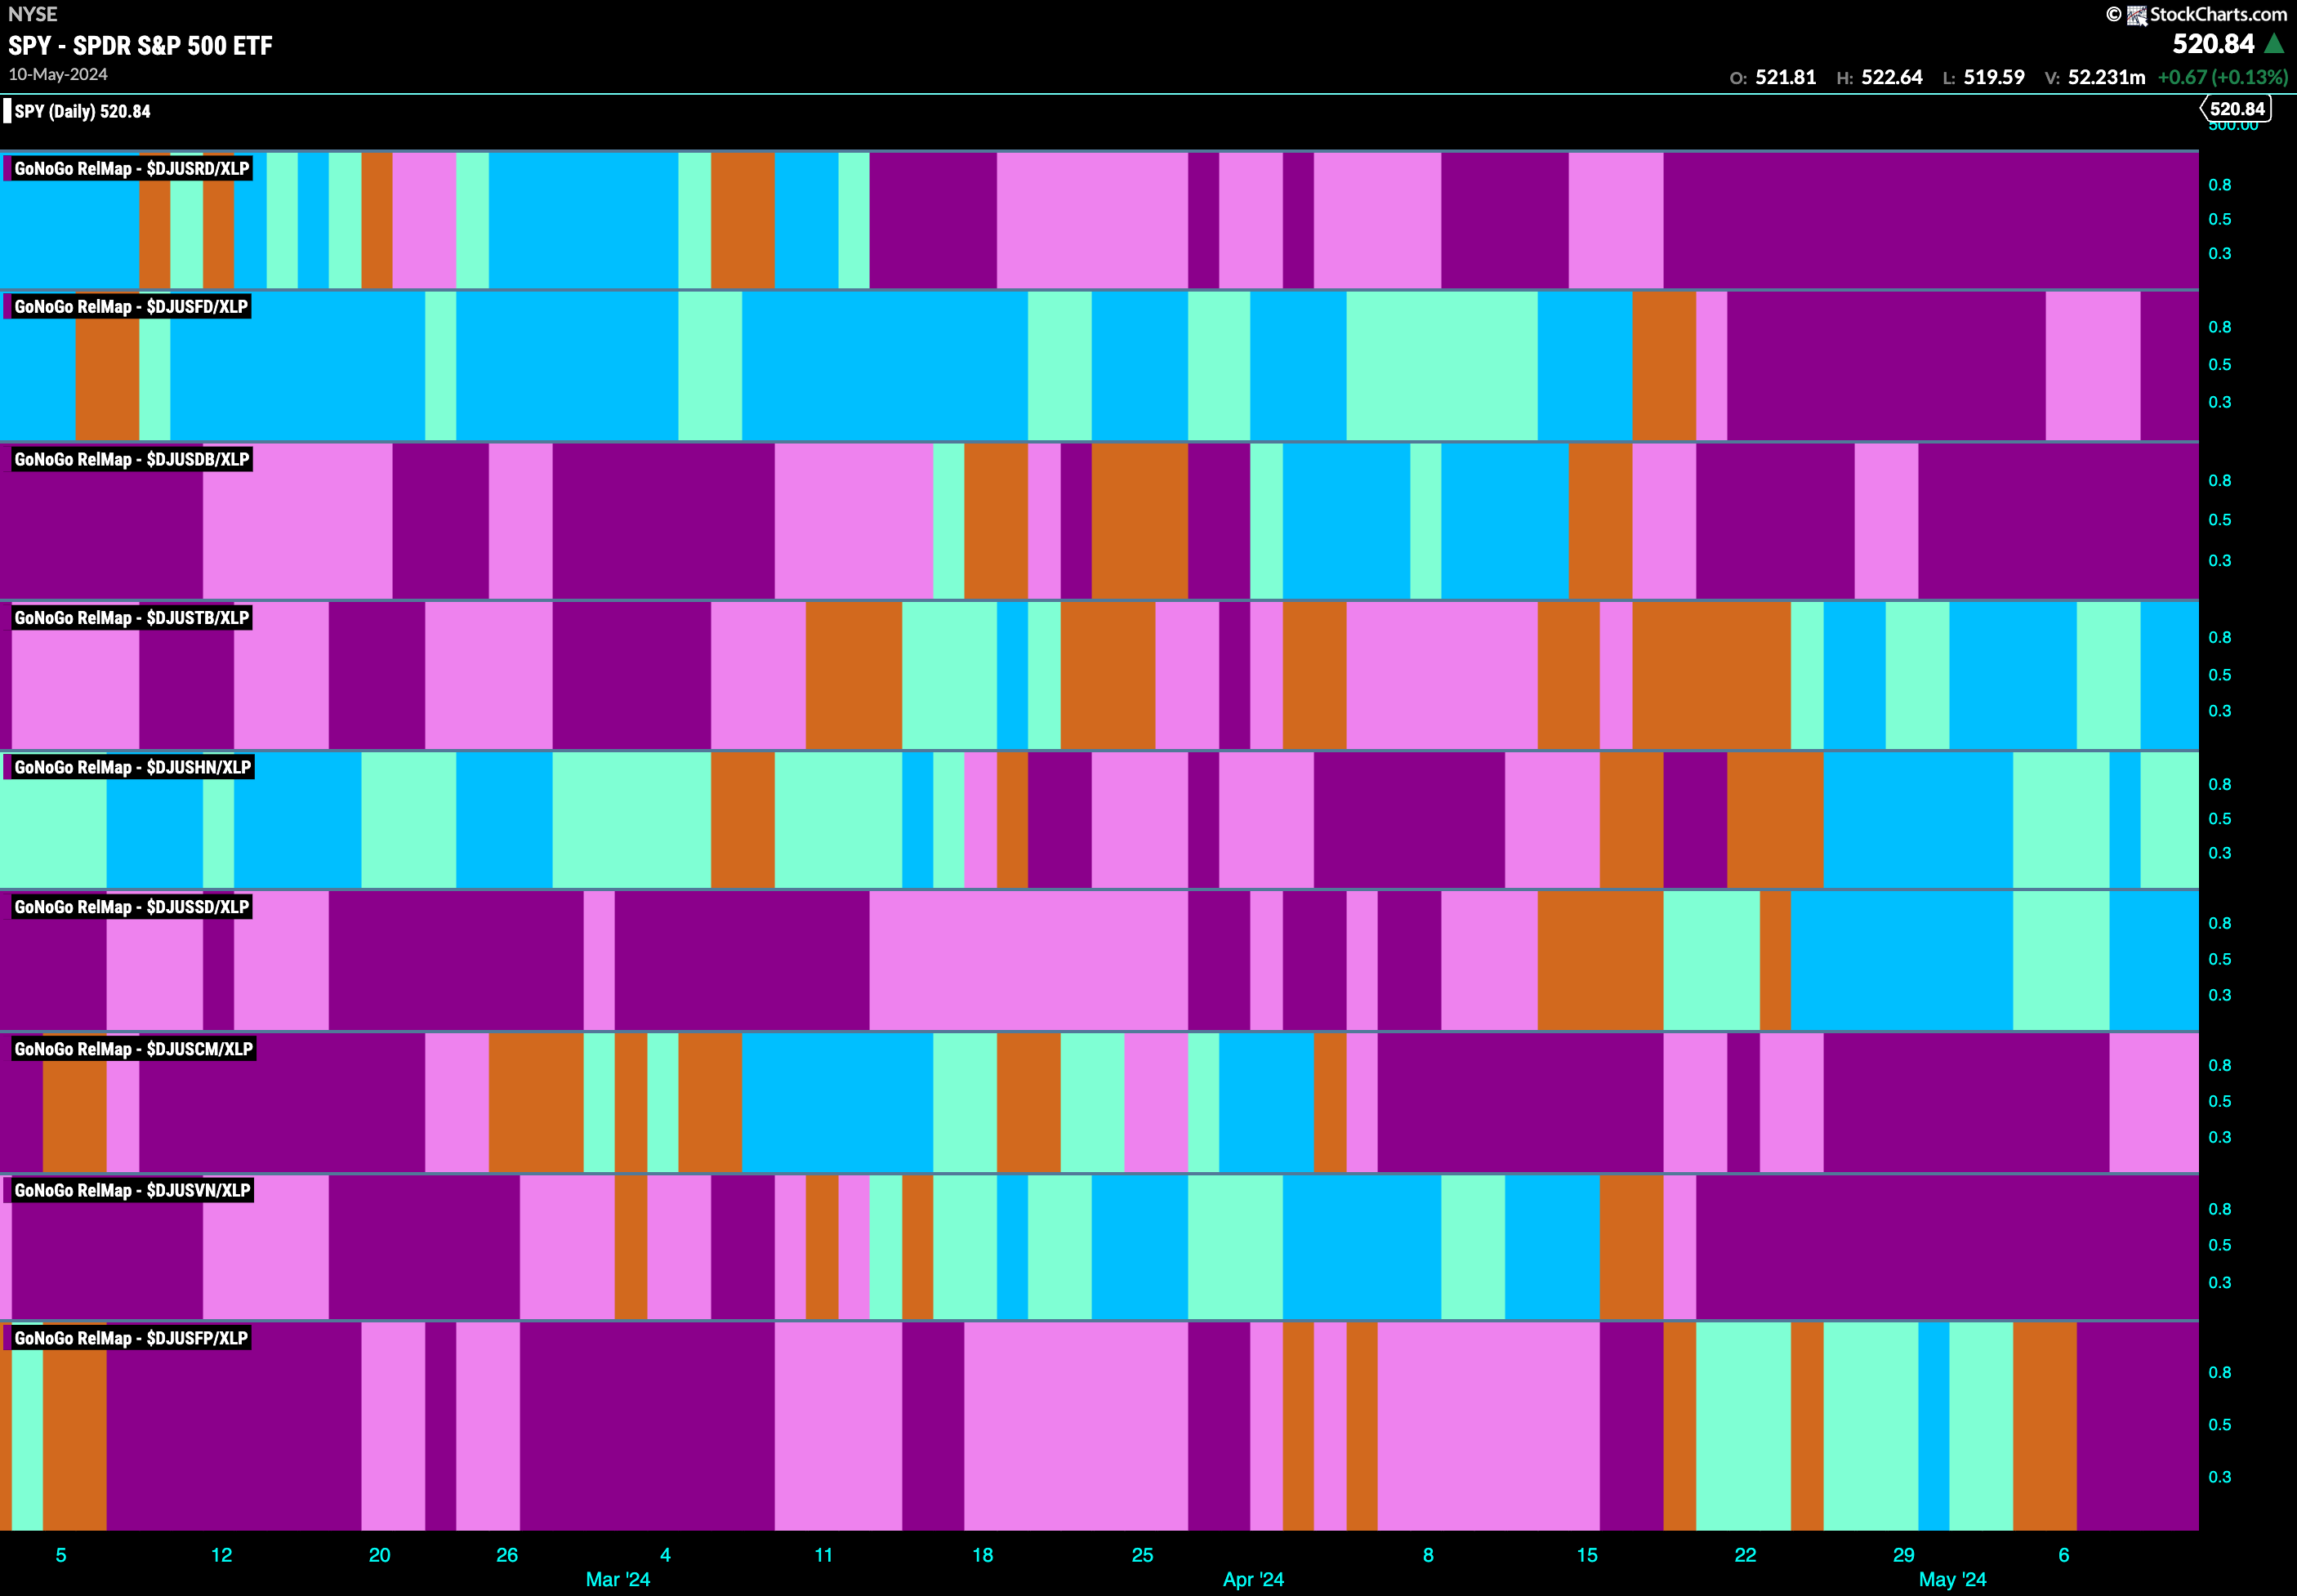
Sector RelMap
Below is the GoNoGo Sector RelMap. This GoNoGo RelMap applies the GoNoGo Trend to the relative strength ratios of the sectors to the base index. Looking at this map, we can quickly see where the relative outperformance is coming from as well as which sectors are lagging on a relative basis. This is a more defensive picture than we might like to see given the new “Go” trend that has emerged on the $SPY. Only 3 sectors are outperforming the base index this week. $XLF, $XLP, and $XLU are painting relative “Go” bars.

Relative “Go” Trend in Staples
If we look at the GoNoGo Suite of tools on the relative ratio of XLP:SPY, we can see that this changing technical environment is significant. Staples, has been relatively underperforming the broader index for a whole year and so as that changes we wonder what this means for the health of the new rally in equity prices. We would definitely want to see other areas of the market join in with the defensive sectors for us to have more confidence in the bullish narrative going forward. However, as the staples sector rallies of its base (on this relative chart) it reminds us that we can look for opportunities in any area of the market.

Staples Sub-Group RelMap
Given what we discussed above, let’s break down the consumer staples index. As we saw in the RelMap above the sector is in a relative “Go” trend to the broader index and that relative trend has just started to paint strong blue bars. If we take a look at a break down of the sub groups below we can see that it is the middle of the map that is leading this out-performance. Non durable home products, soft drinks and tobacco are the leaders.

$REYN Setting up for Attack on Prior High
In the nondurable home products index, $REYN is a security that has seen price move lower following multiple Go Countertrend Correction Icons (red arrows) in March. Since then we have seen a choppy correction that has seen GoNoGo Trend struggle to consistenly paint trend colors. Recently, after a dominance of amber “Go Fish” bars of uncertainty we saw GoNoGo Oscillator burst off the zero line on heavy volume and this lead to a new “Go” trend. Now, having painted a couple of strong blue “Go” bars and the oscillator rising on heavy volume, we will watch to see if price can climb higher and make an attack on prior highs.

$CELH Looks for New “Go”?
In an attempt to find an early opportunity, we can look at the chart below of $CELH. After a Go Countertrend Correction Icon (red arrow) in March, we saw price move lower and GoNoGo Oscillator fail to find support at the zero line. This led to a “NoGo” trend that took prices lower still. However, recently, GoNoGo Oscillator climbed back to the zero line where it stayed, causing the climbing grid of GoNoGo Squeeze to rise to its Max. As the Squeeze was broken into positive territory on heavy volume, that signaled enough buying pressure to push price out of the “NoGo” and for GoNoGo Trend to paint amber “Go Fish” bars. We will watch to see in which direction the trend goes. If we can climb above the horizontal resistance we see on the chart it is likely that GoNoGo Trend will identify a new “Go” trend.


