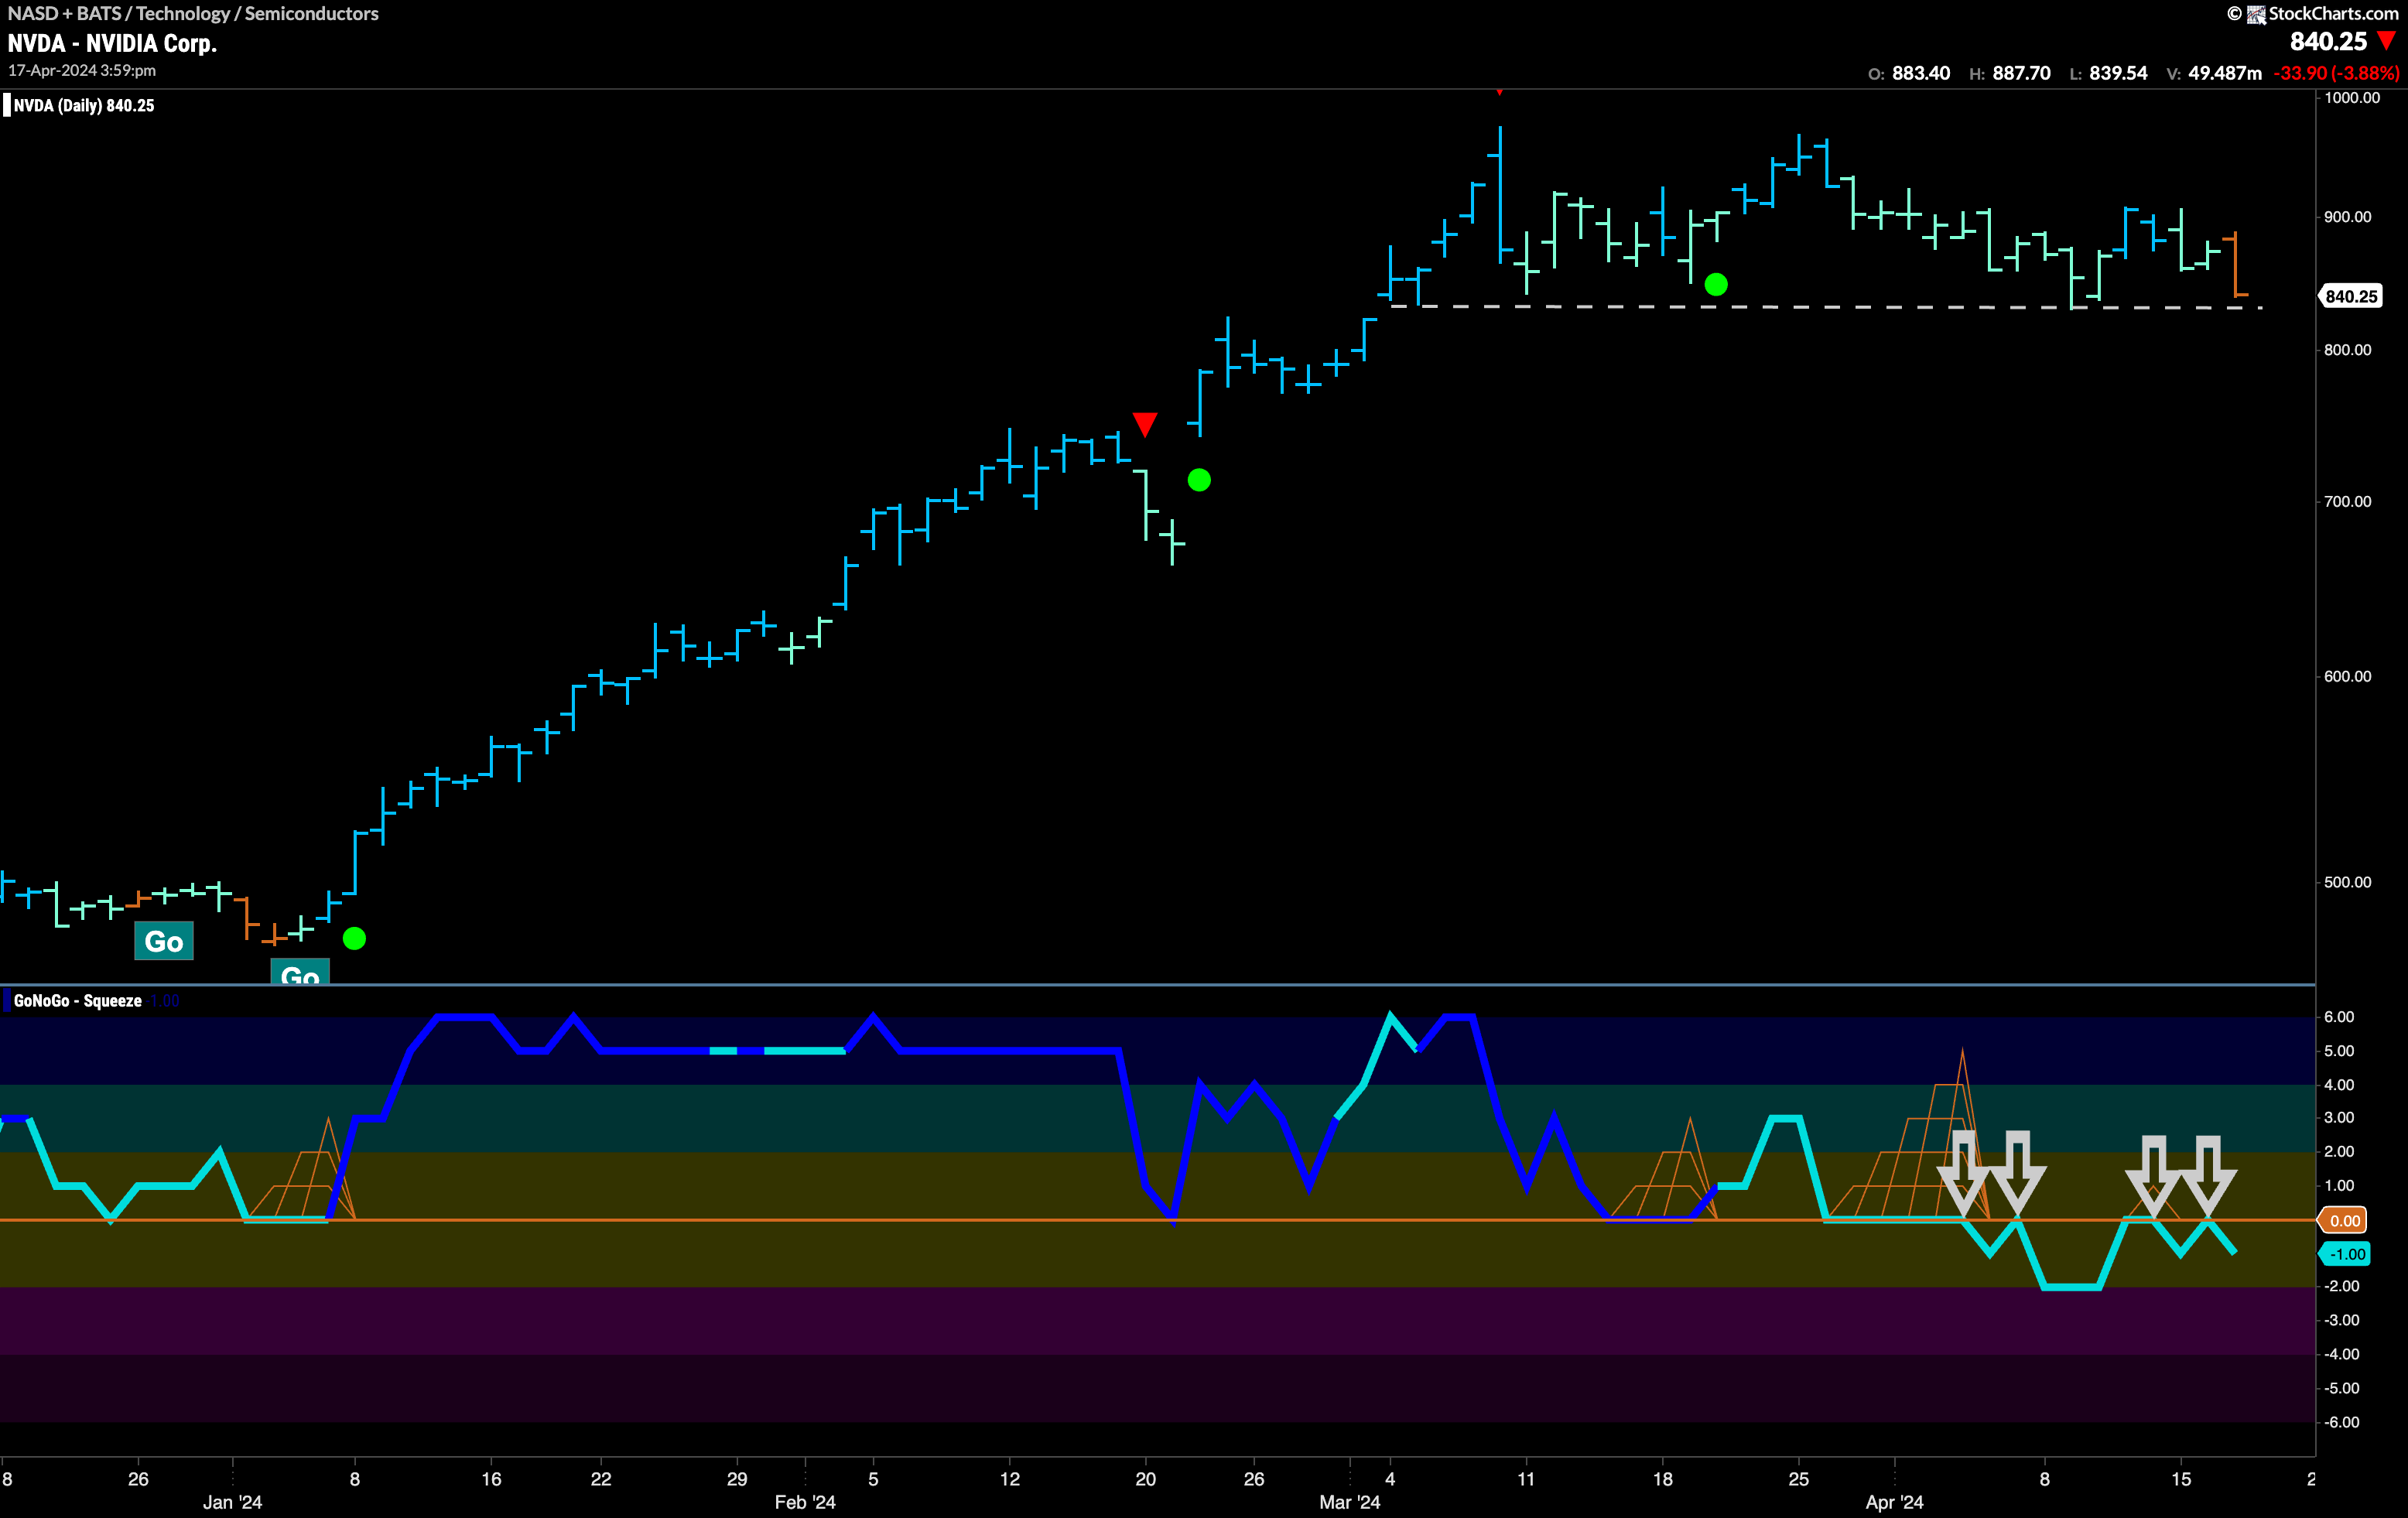
$NVDA has been in a “Go” trend since November of last year.
After an impressive series of higher highs and higher lows, we saw a Go Countertrend Correction Icon (red arrow) at the last high on March 8th. This suggested that price may struggle to go higher in the short term. Indeed price has moved mostly sideways since then, failing to make a new higher high. Earlier this month, we saw GoNoGo Oscillator fall to test the zero line from above, and it failed to find support. We know that in a strong “Go” trend the oscillator should stay at or above the zero line and so this was a concern. Since then, price has been able to find support at the horizontal level we see on the chart, but GoNoGo Trend has painted an amber “Go Fish” bar which represents uncertainty. As GoNoGo Oscillator gets turned away by the zero line back into negative territory, we will watch to see if price breaks below support. If it does, a “NoGo” trend could potentially follow as price will try to make new lows.


