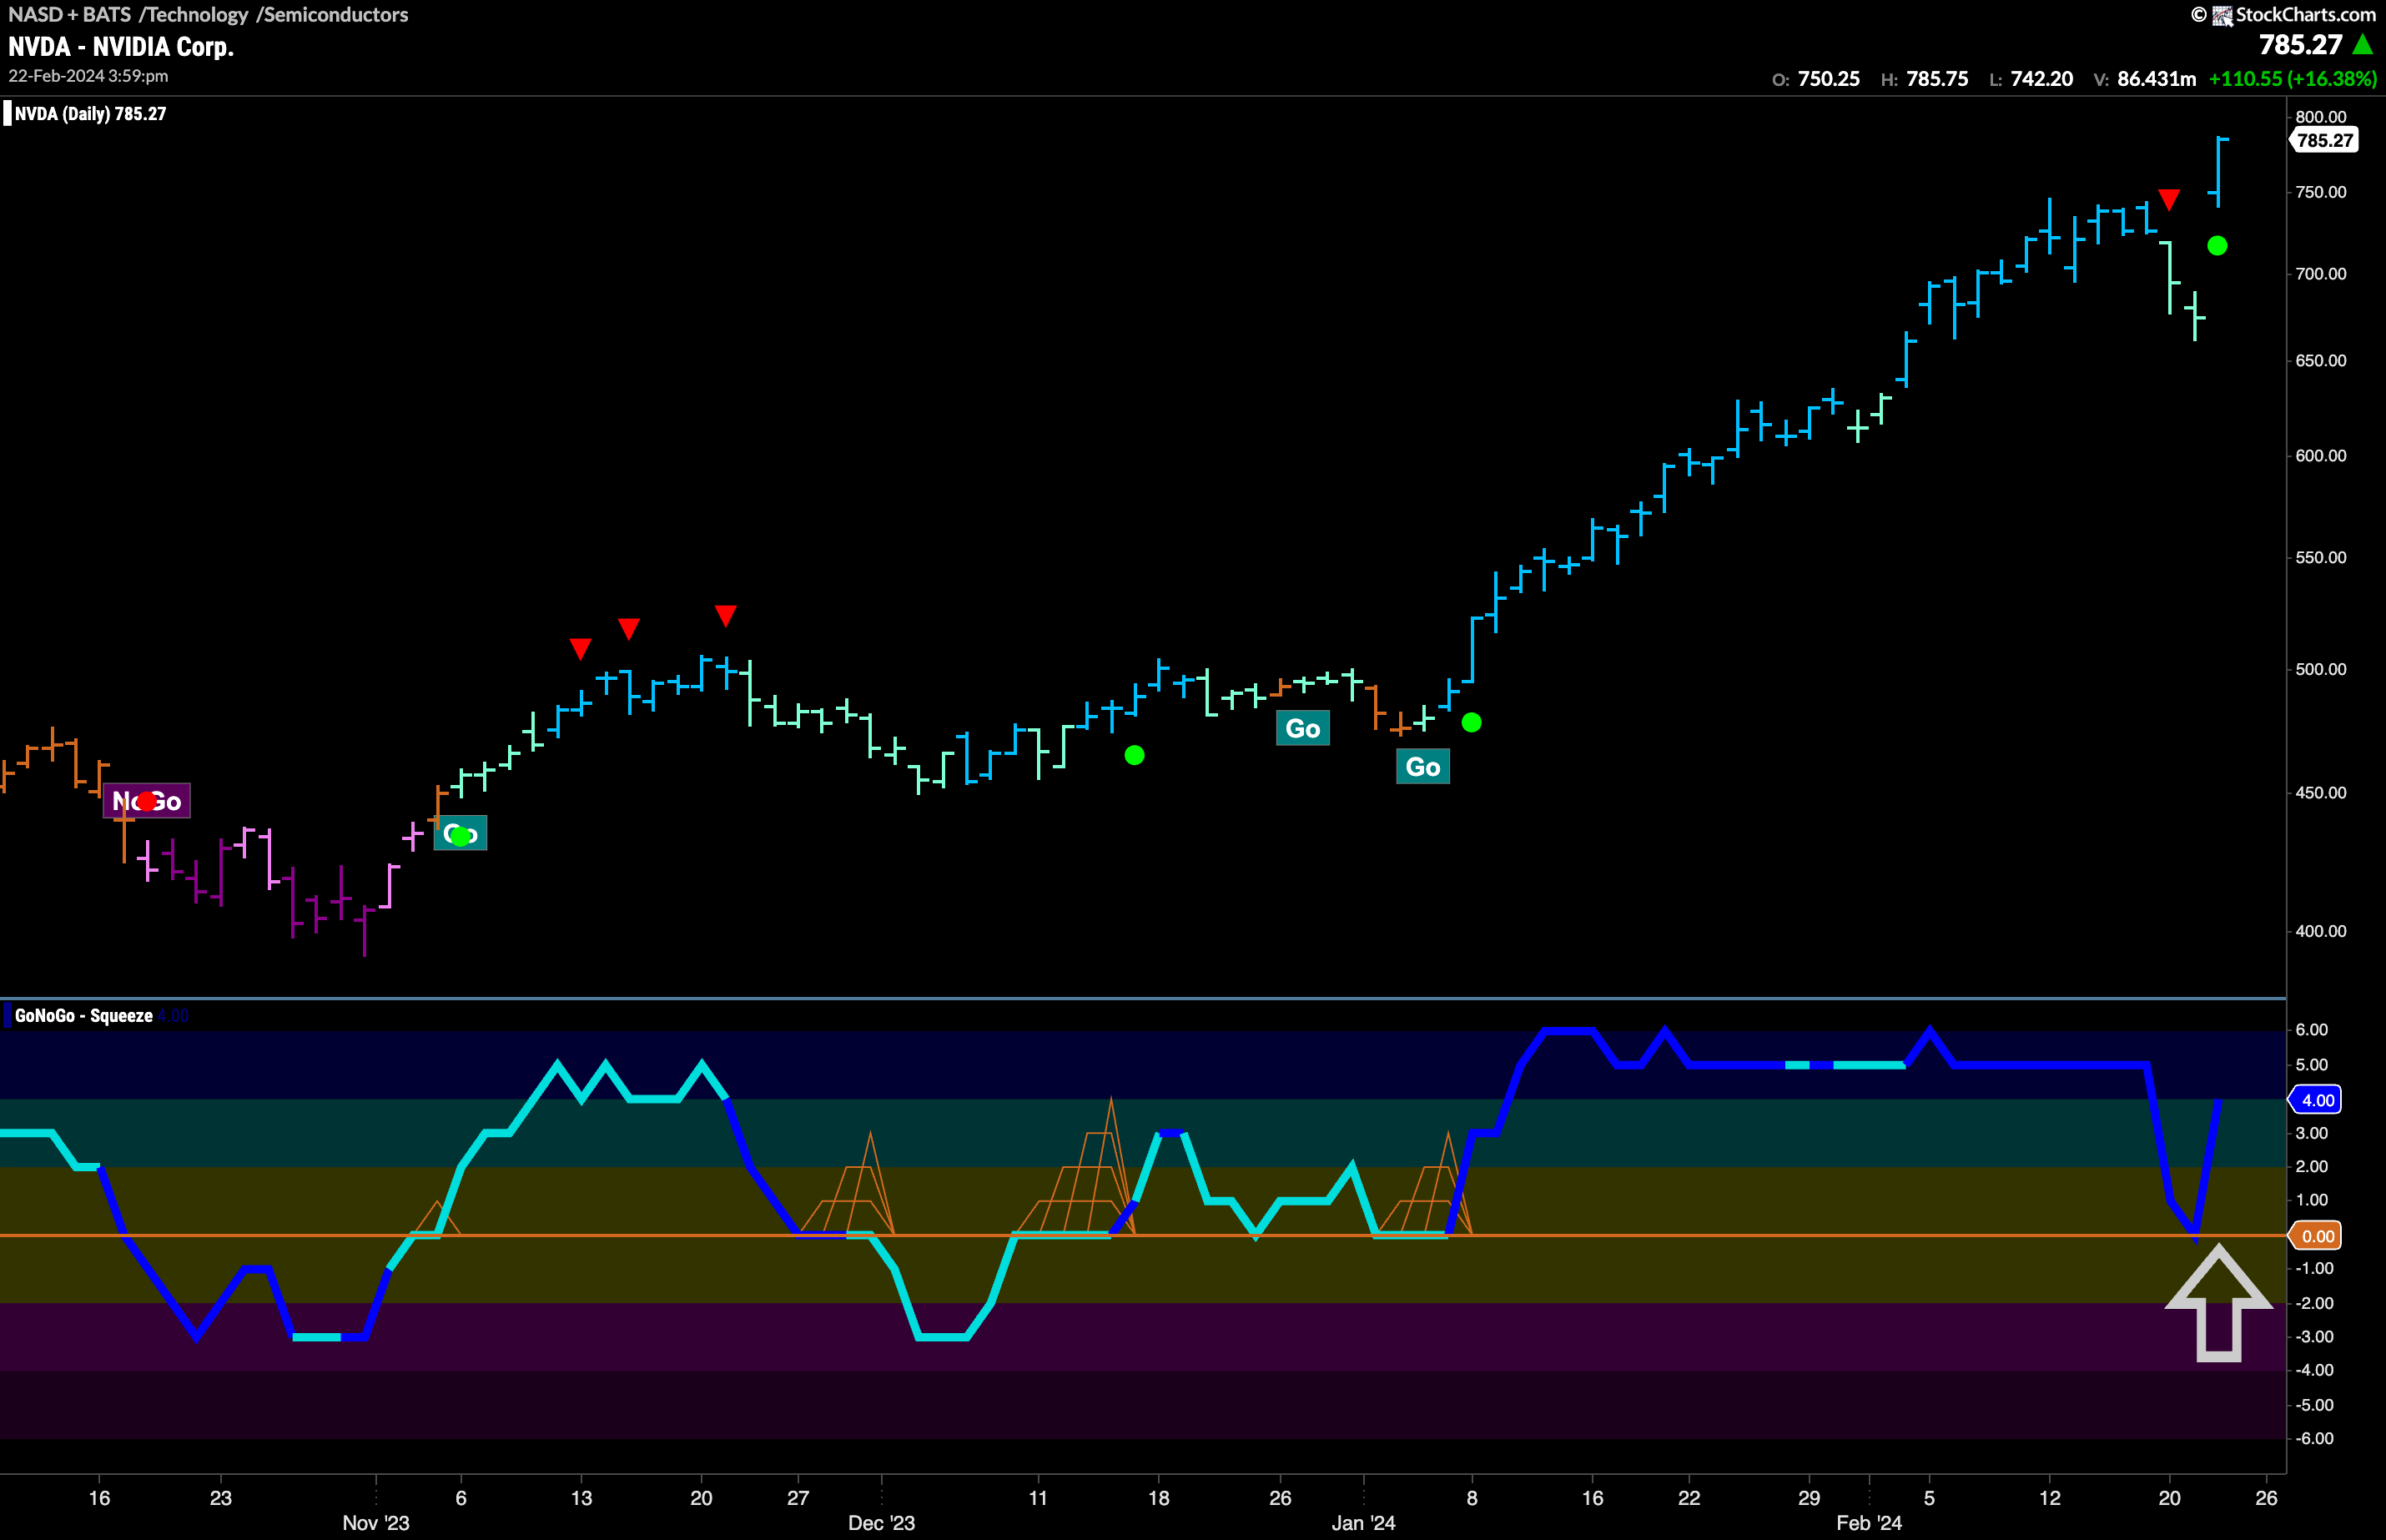

$NVDA has been in a “Go” trend since November of last year.
After a very strong run this year, we saw price hit a high and the GoNoGo Charts flagged a Go Countertrend Correction Icon (red arrow) indicating that price may struggle to go higher in the short term. GoNoGo Trend followed by painting a couple of weaker aqua bars as GoNoGo Oscillator fell to test the zero line from above. As momentum cooled, the question became whether or not the oscillator would find support at the zero line, and therefore staying on the side of the “Go” trend. We have our answer as the GoNoGo Oscillator has bounced sharply off zero back into positive territory as price gaps to new highs. With momentum resurgent in the direction of the underlying “Go” trend, we see a fresh Go Trend Continuation Icon (green circle) under the price bar. We will look for price to consolidate at these new highs.


