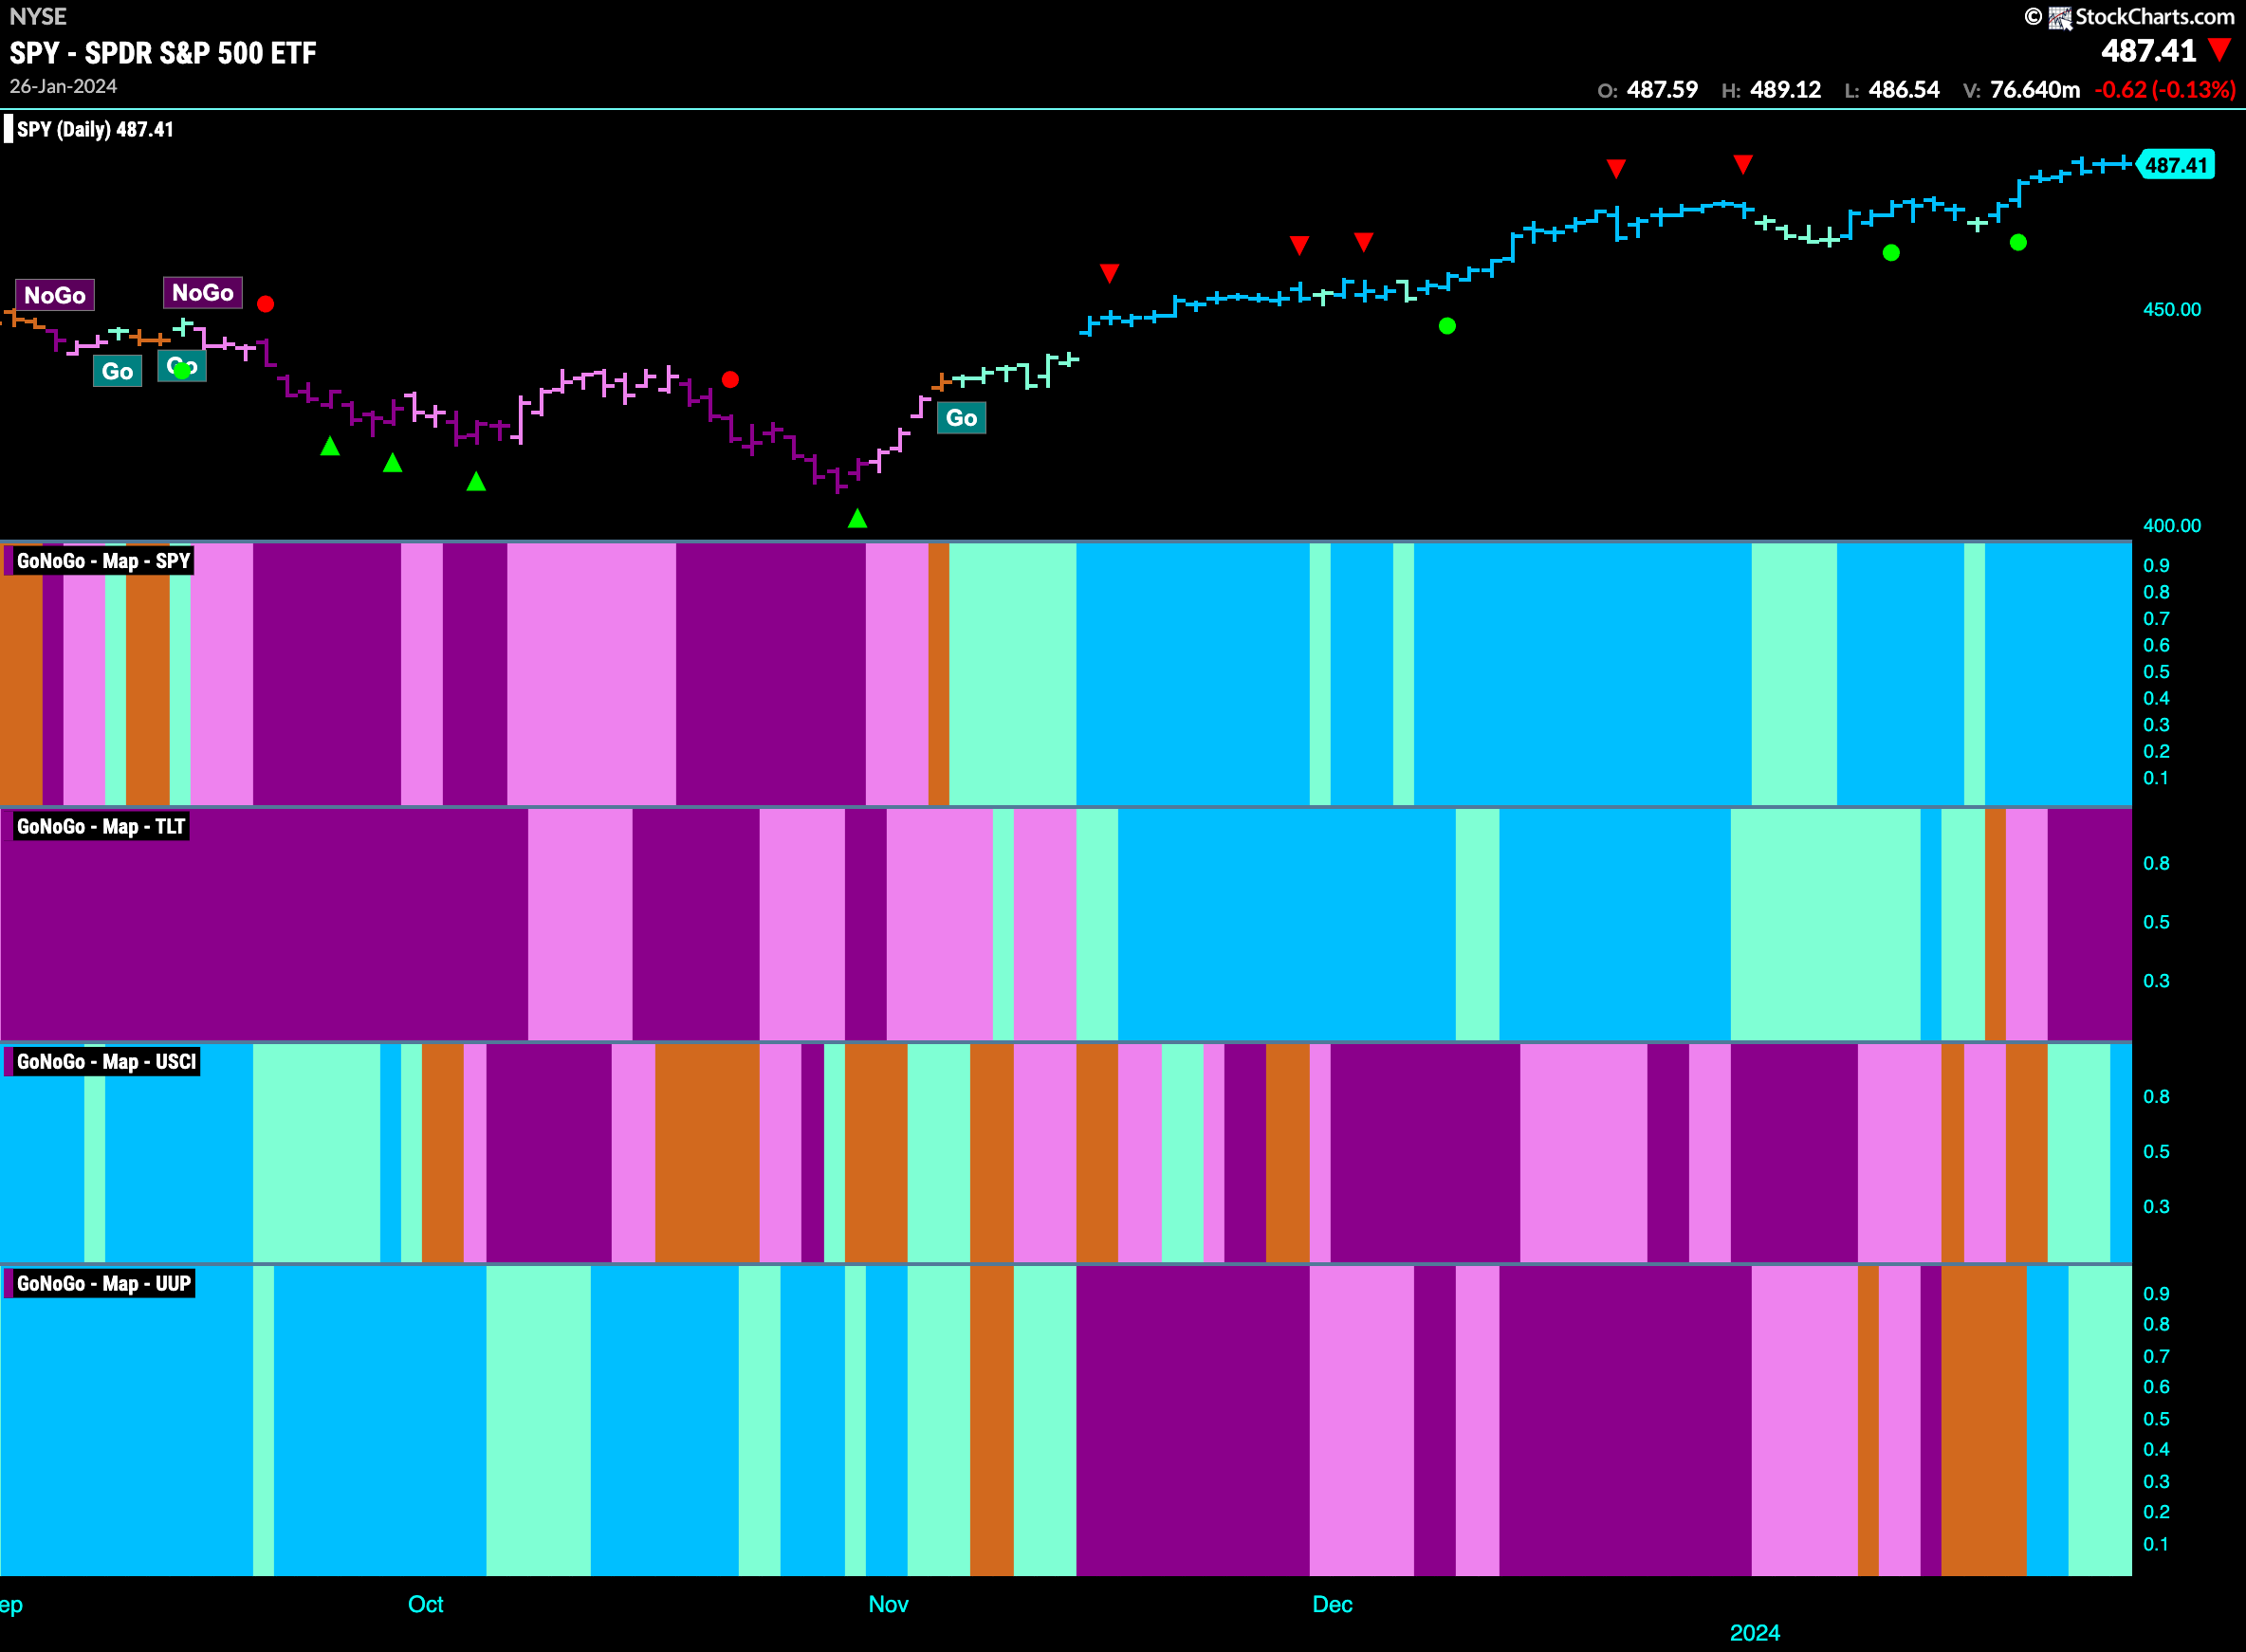
Good morning and welcome to this week’s Flight Path. Equities continued to show strength as GoNoGo Trend painted uninterrupted blue “Go” bars as prices hit new highs. Treasury bond prices fell deeper into a “NoGo” as we saw strong purple bars this week. Commodities were able to see the “Go” trend strengthen as the end of the week painted a strong blue “Go” bar. Likewise, the dollar was able to hang on to its new “Go” trend but painted some weaker aqua bars this week.
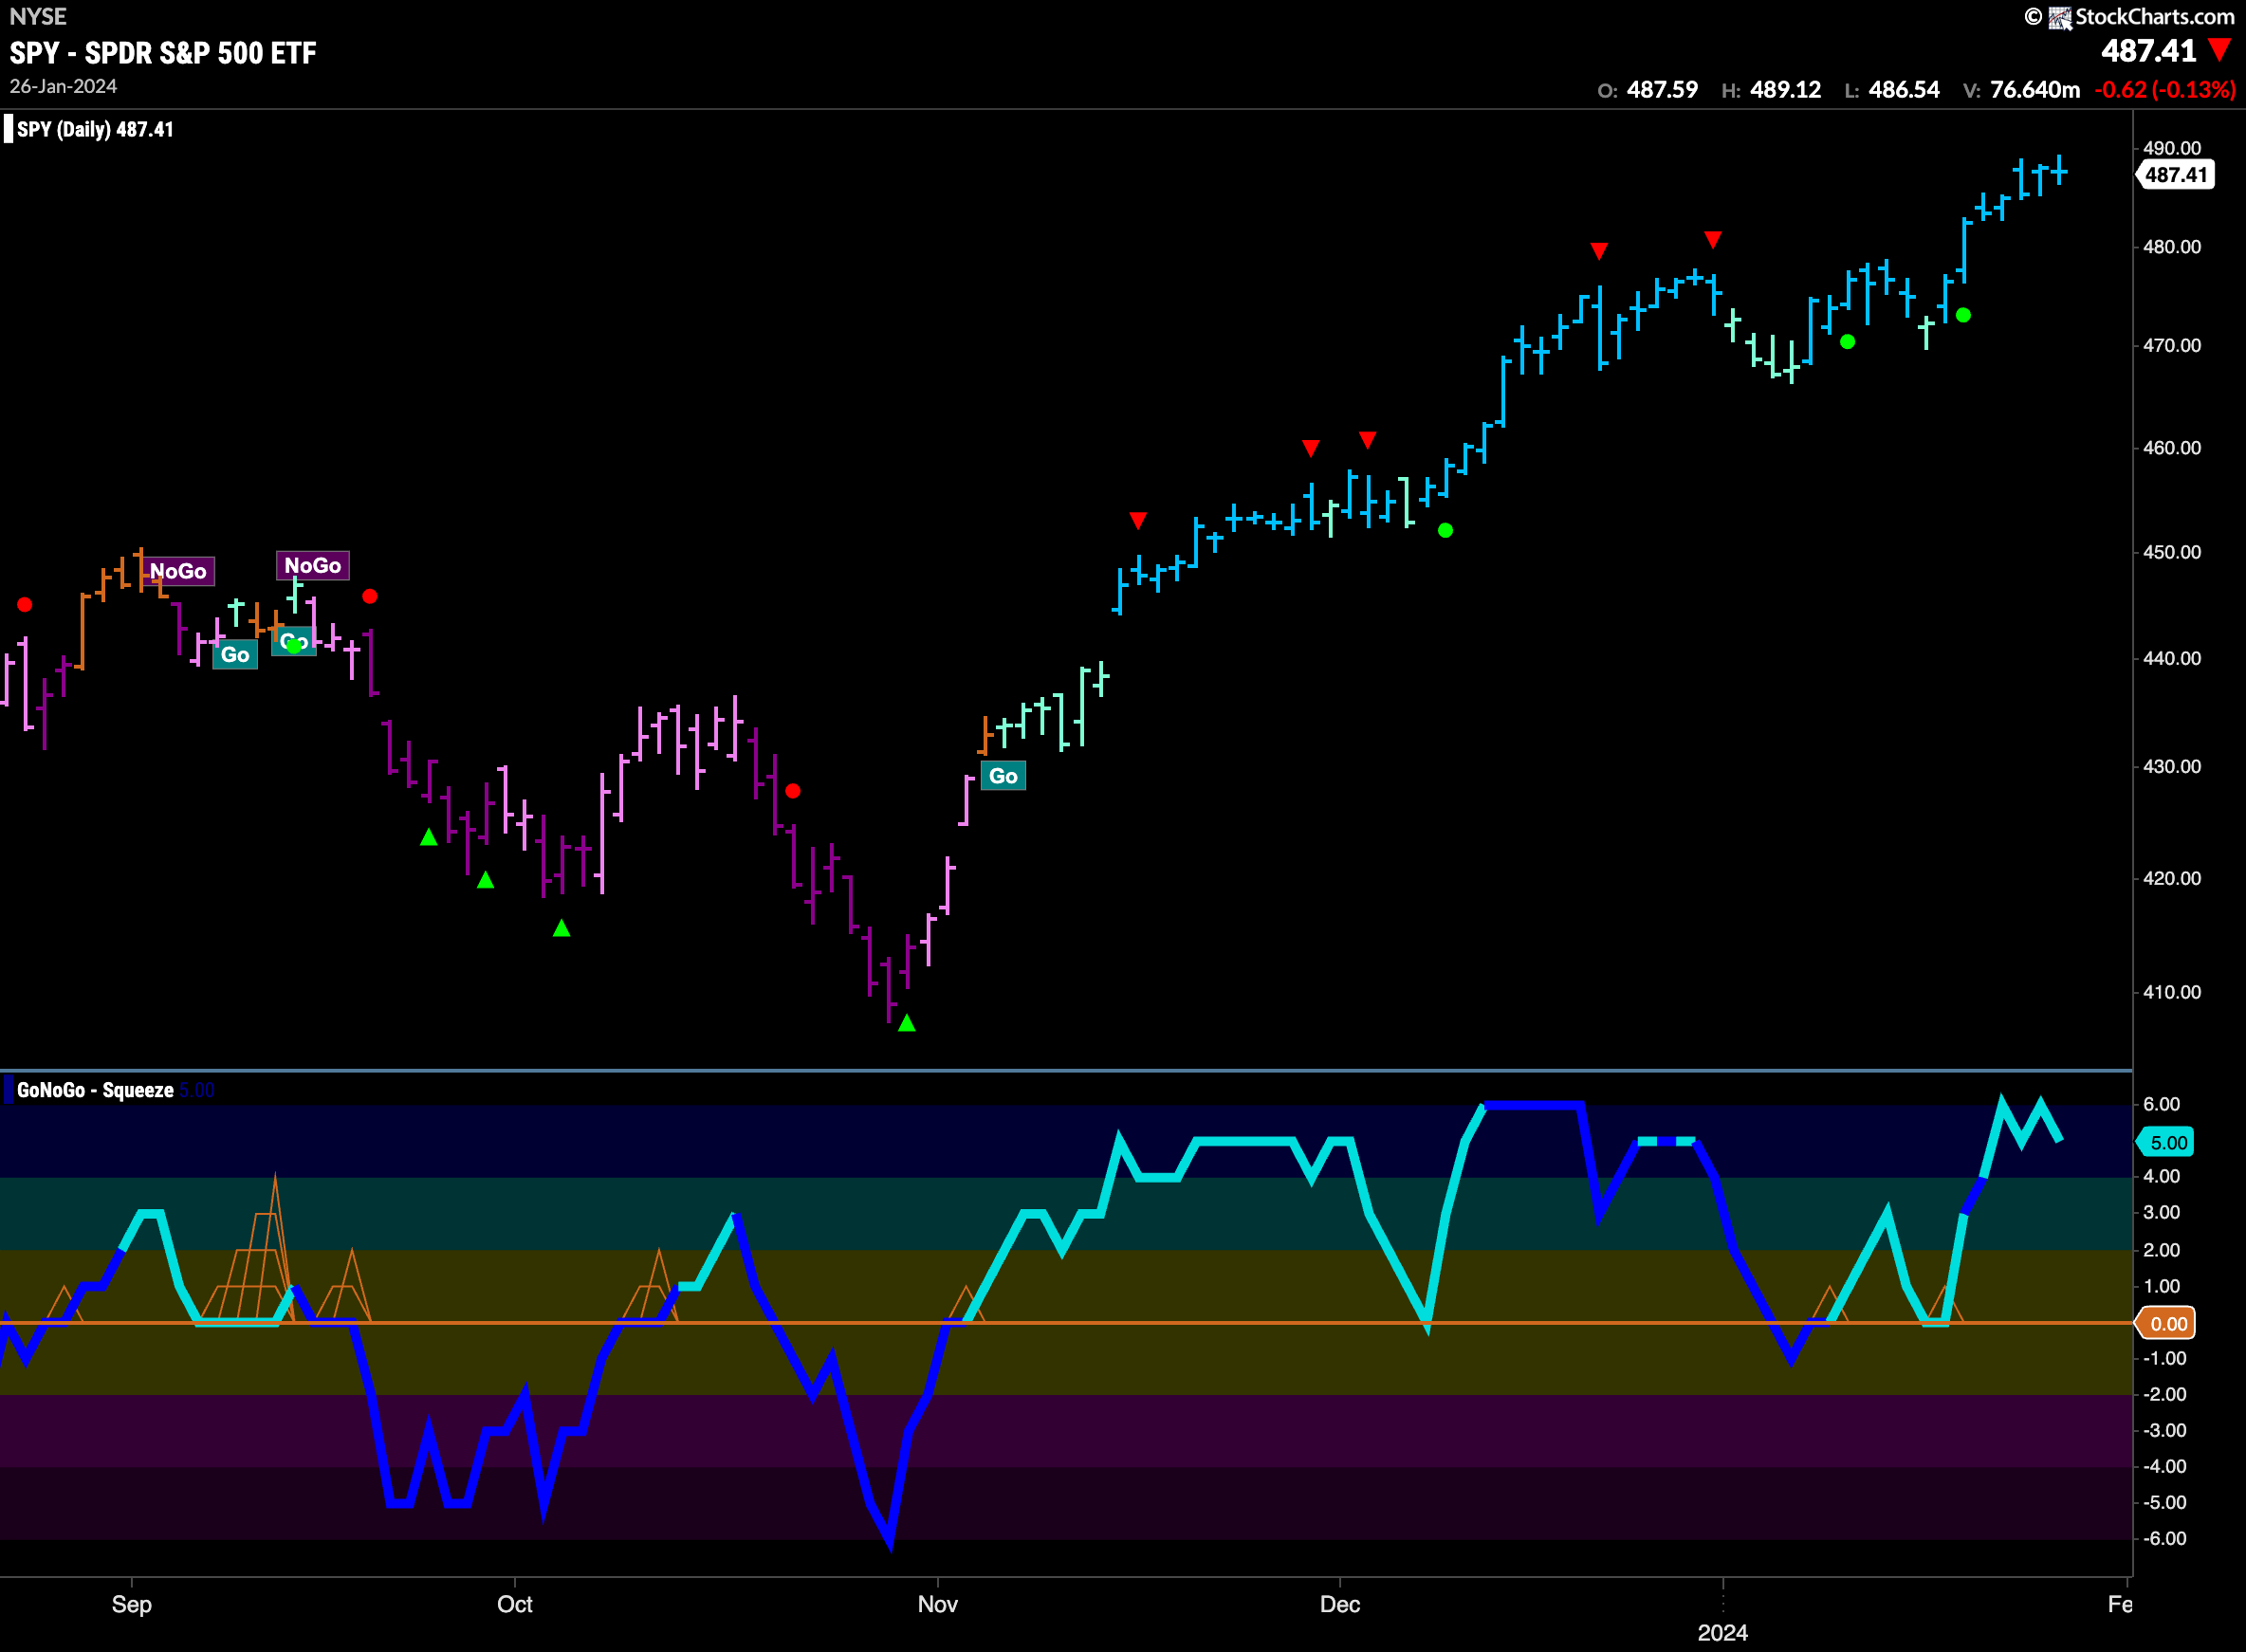
U.S. Equities Consolidate at Highs
A strong week for U.S. equities saw more higher highs as price climbed all week. GoNoGo Trend painted a string of strong blue “Go” bars and GoNoGo Oscillator rose into overbought territory and stayed there. While volume is light, this is a very positive looking chart for $SPY. We will watch to see if prices cool as the oscillator falls away from these overbought levels.
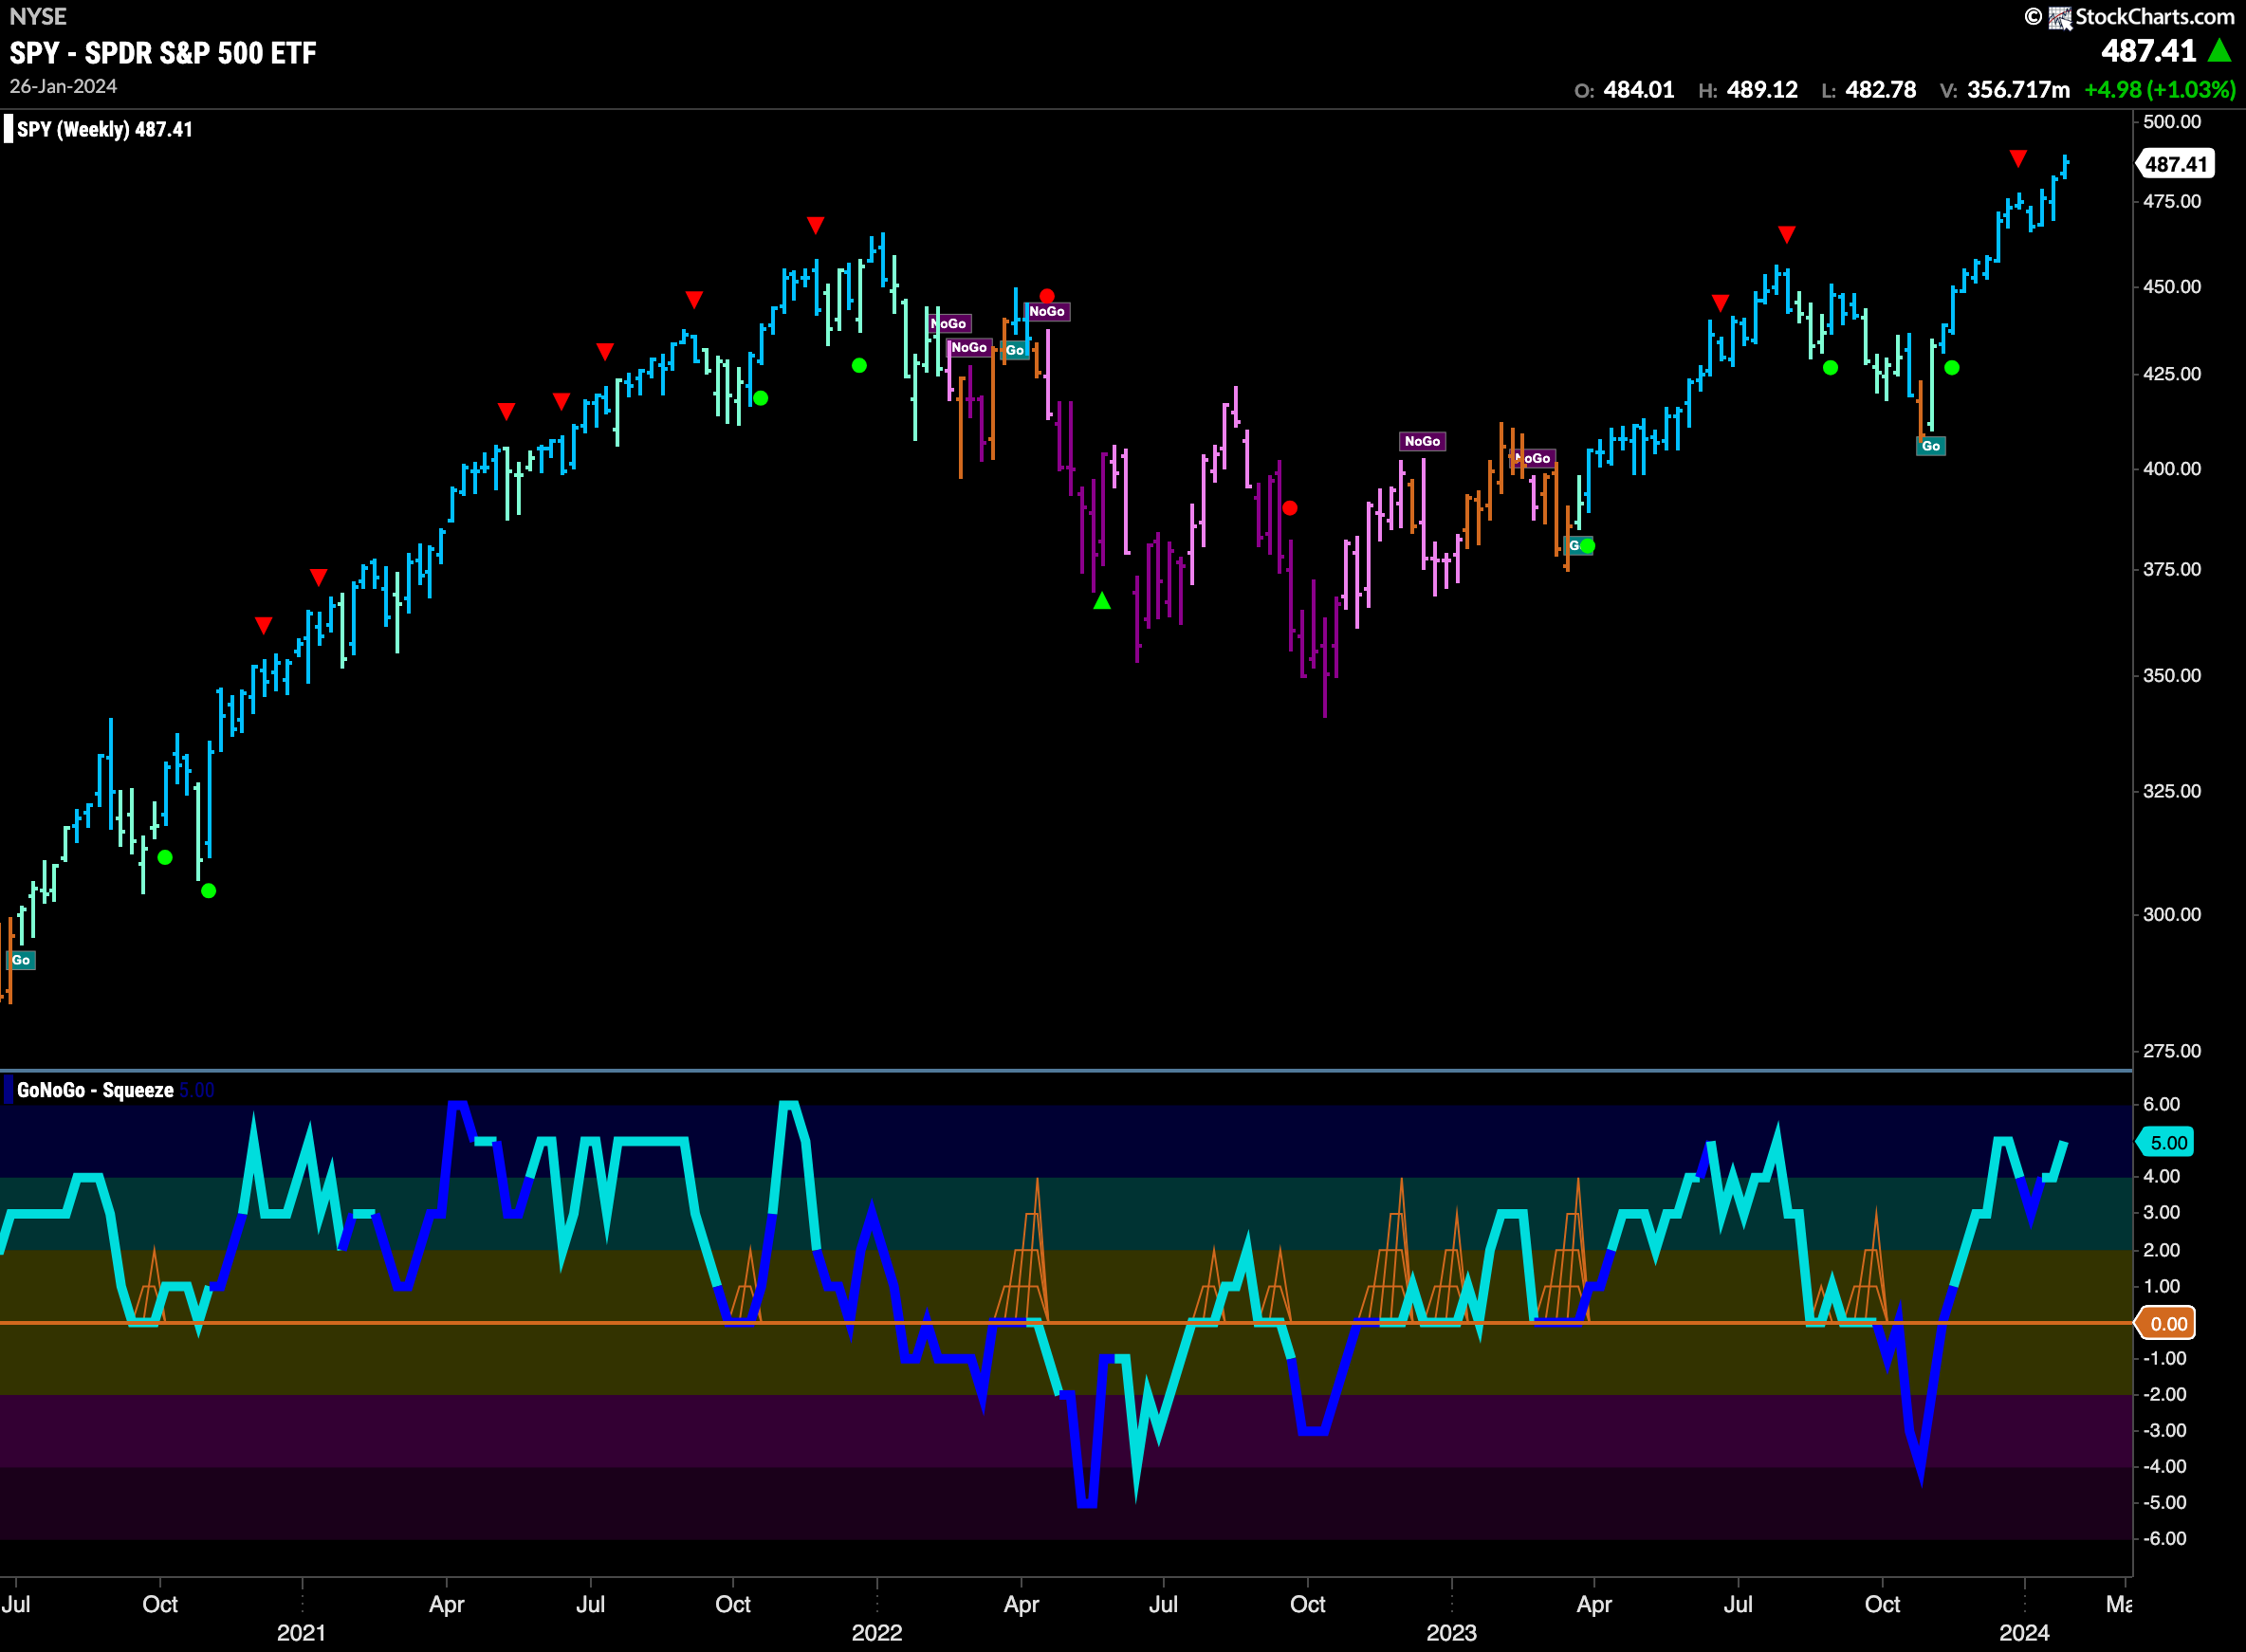
The weekly chart shows how far we have come since the lows in late 2022. With a series of higher highs and higher lows that have taken us to new all time highs, the “Go” trend in equities continues to climb. We are now looking at strong blue “Go” bars for 12 straight weeks! GoNoGo Oscillator is returning to overbought conditions at a value of 5. We will have to see if there is any kind of pull back on the horizon.
New “Go” Trend for Rates
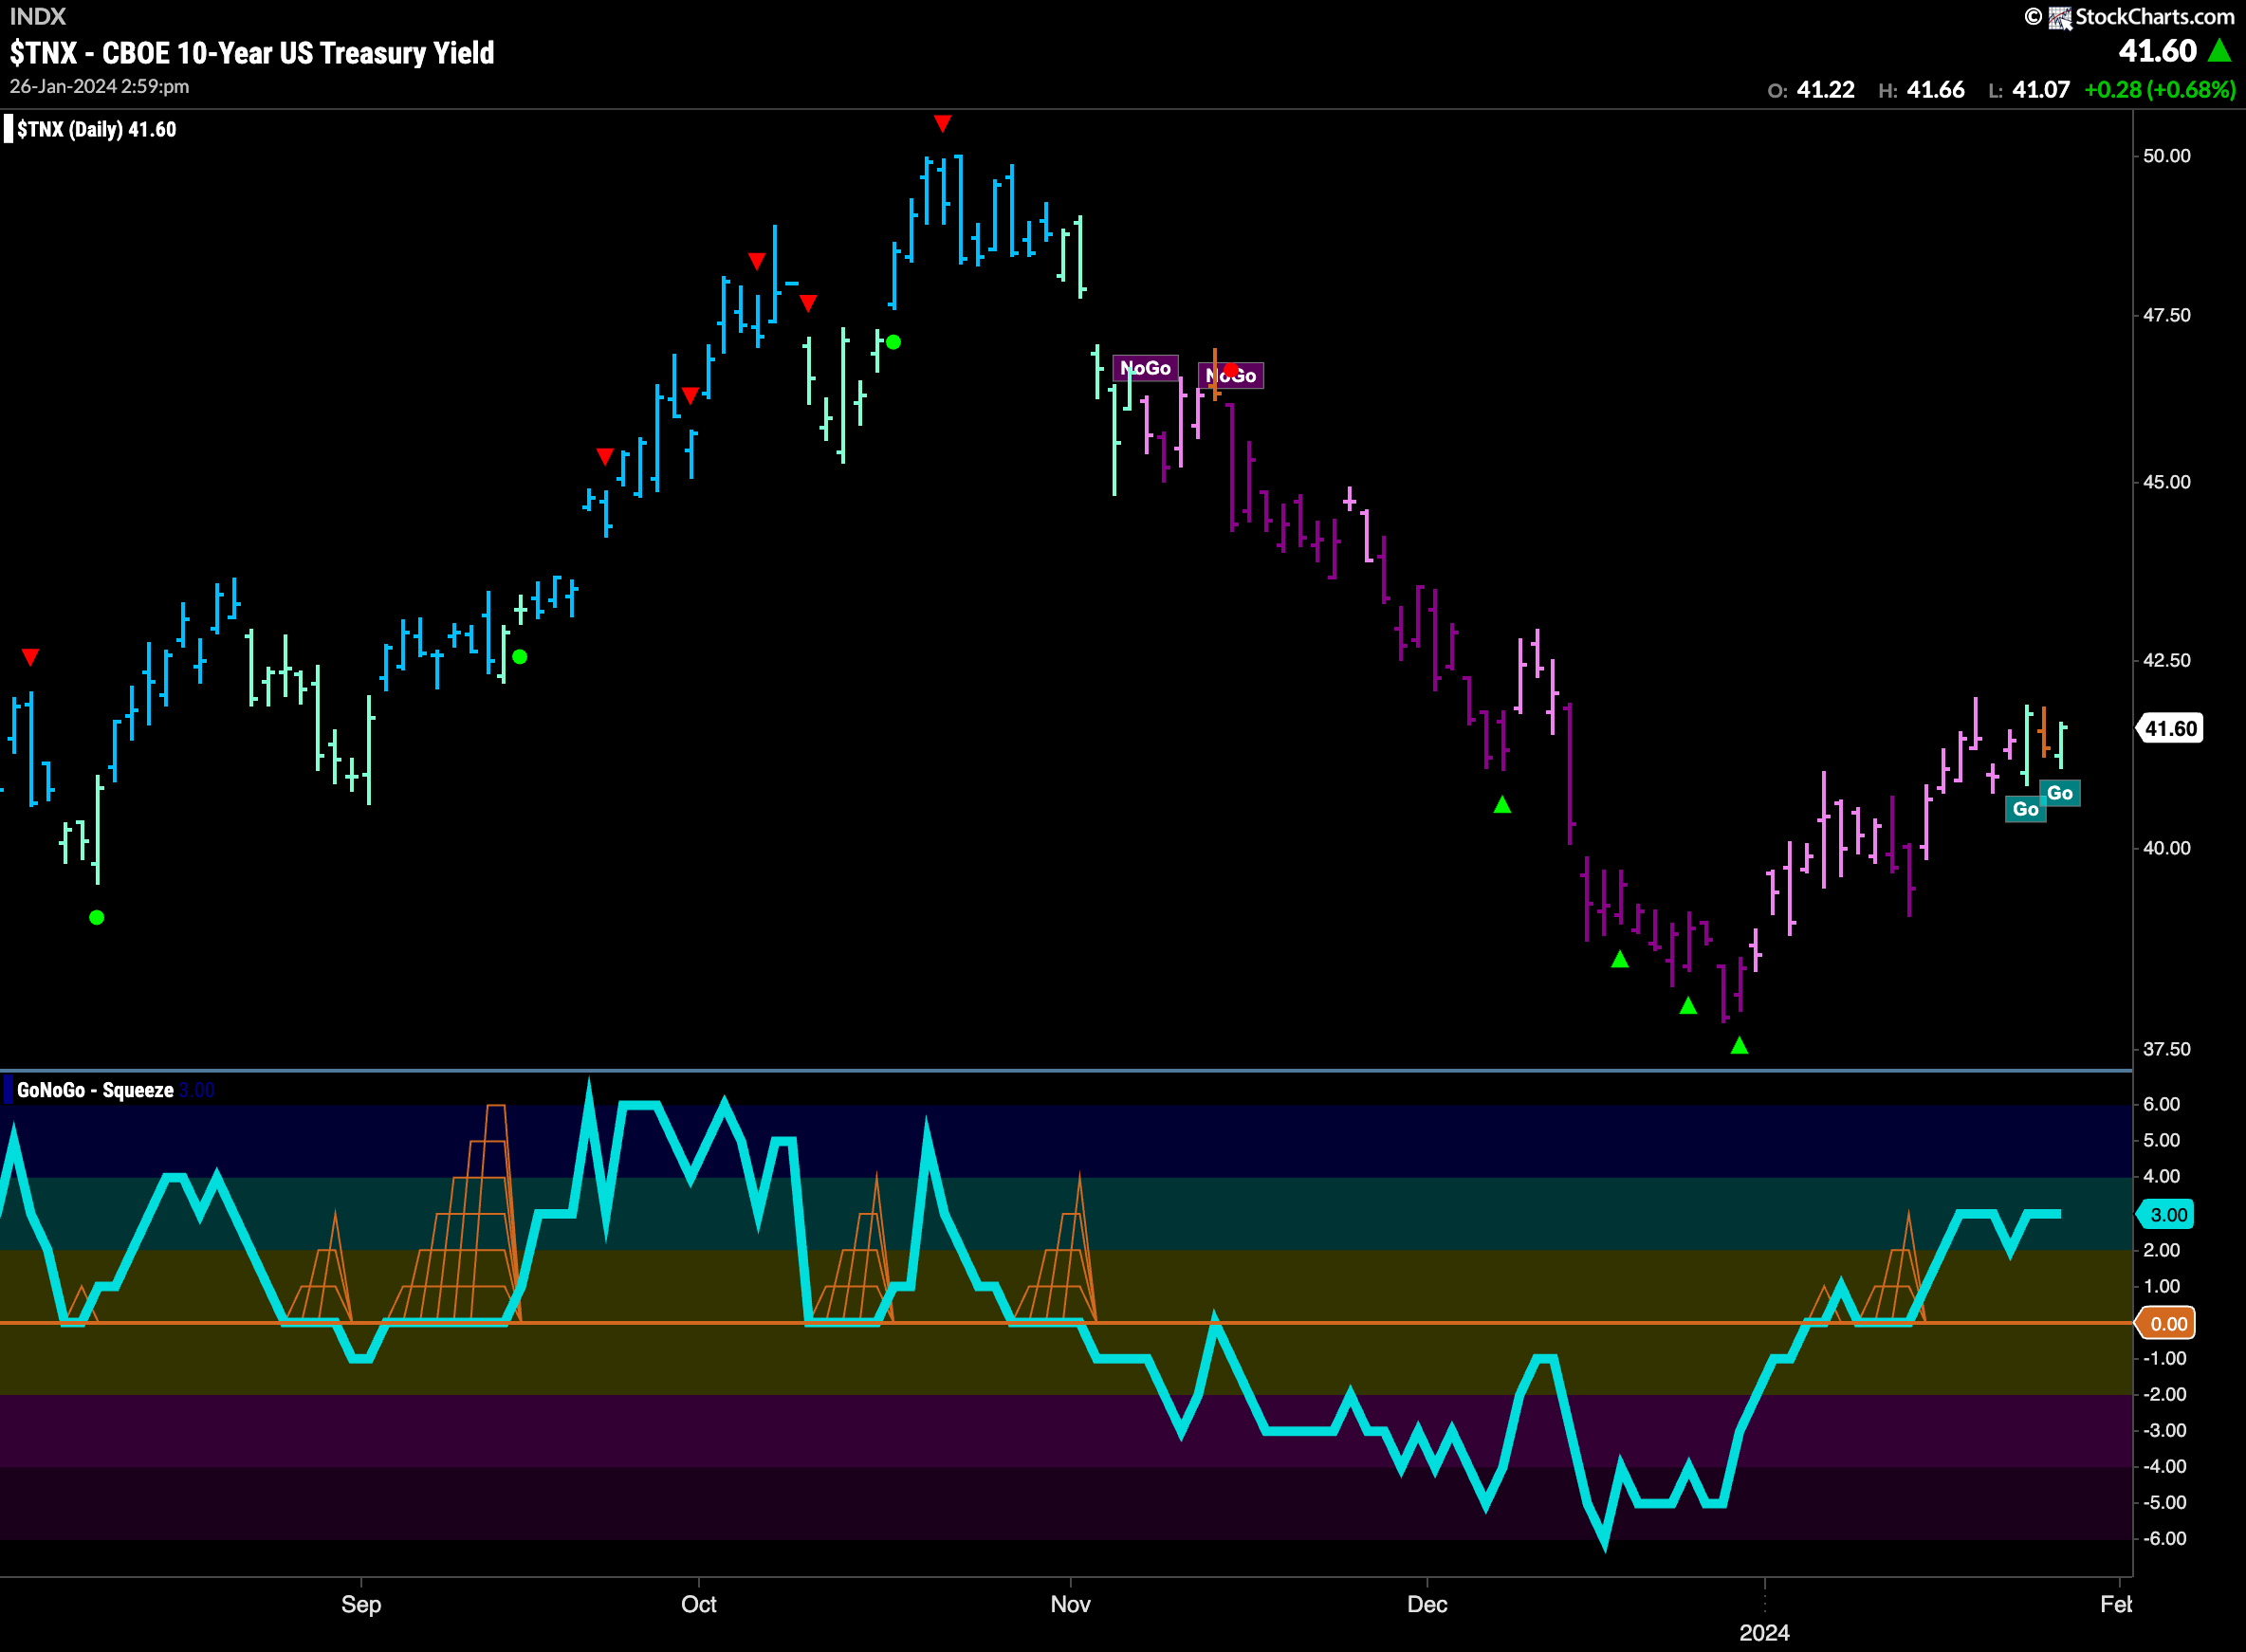
Last week we suggested that the positive momentum we were seeing in the lower panel would make it hard for GoNoGo Trend to continue painting “NoGo” bars. This week we saw a new “Go” trend as the indicator painted an aqua bar on Wednesday. After one “Go Fish” bar the week ended with another “Go” bar. With this new trend in place and momentum positive and therefore in the direction of the underlying “Go” trend, we will look for prices to consolidate and move higher.
The Dollar in a “Go” Trend
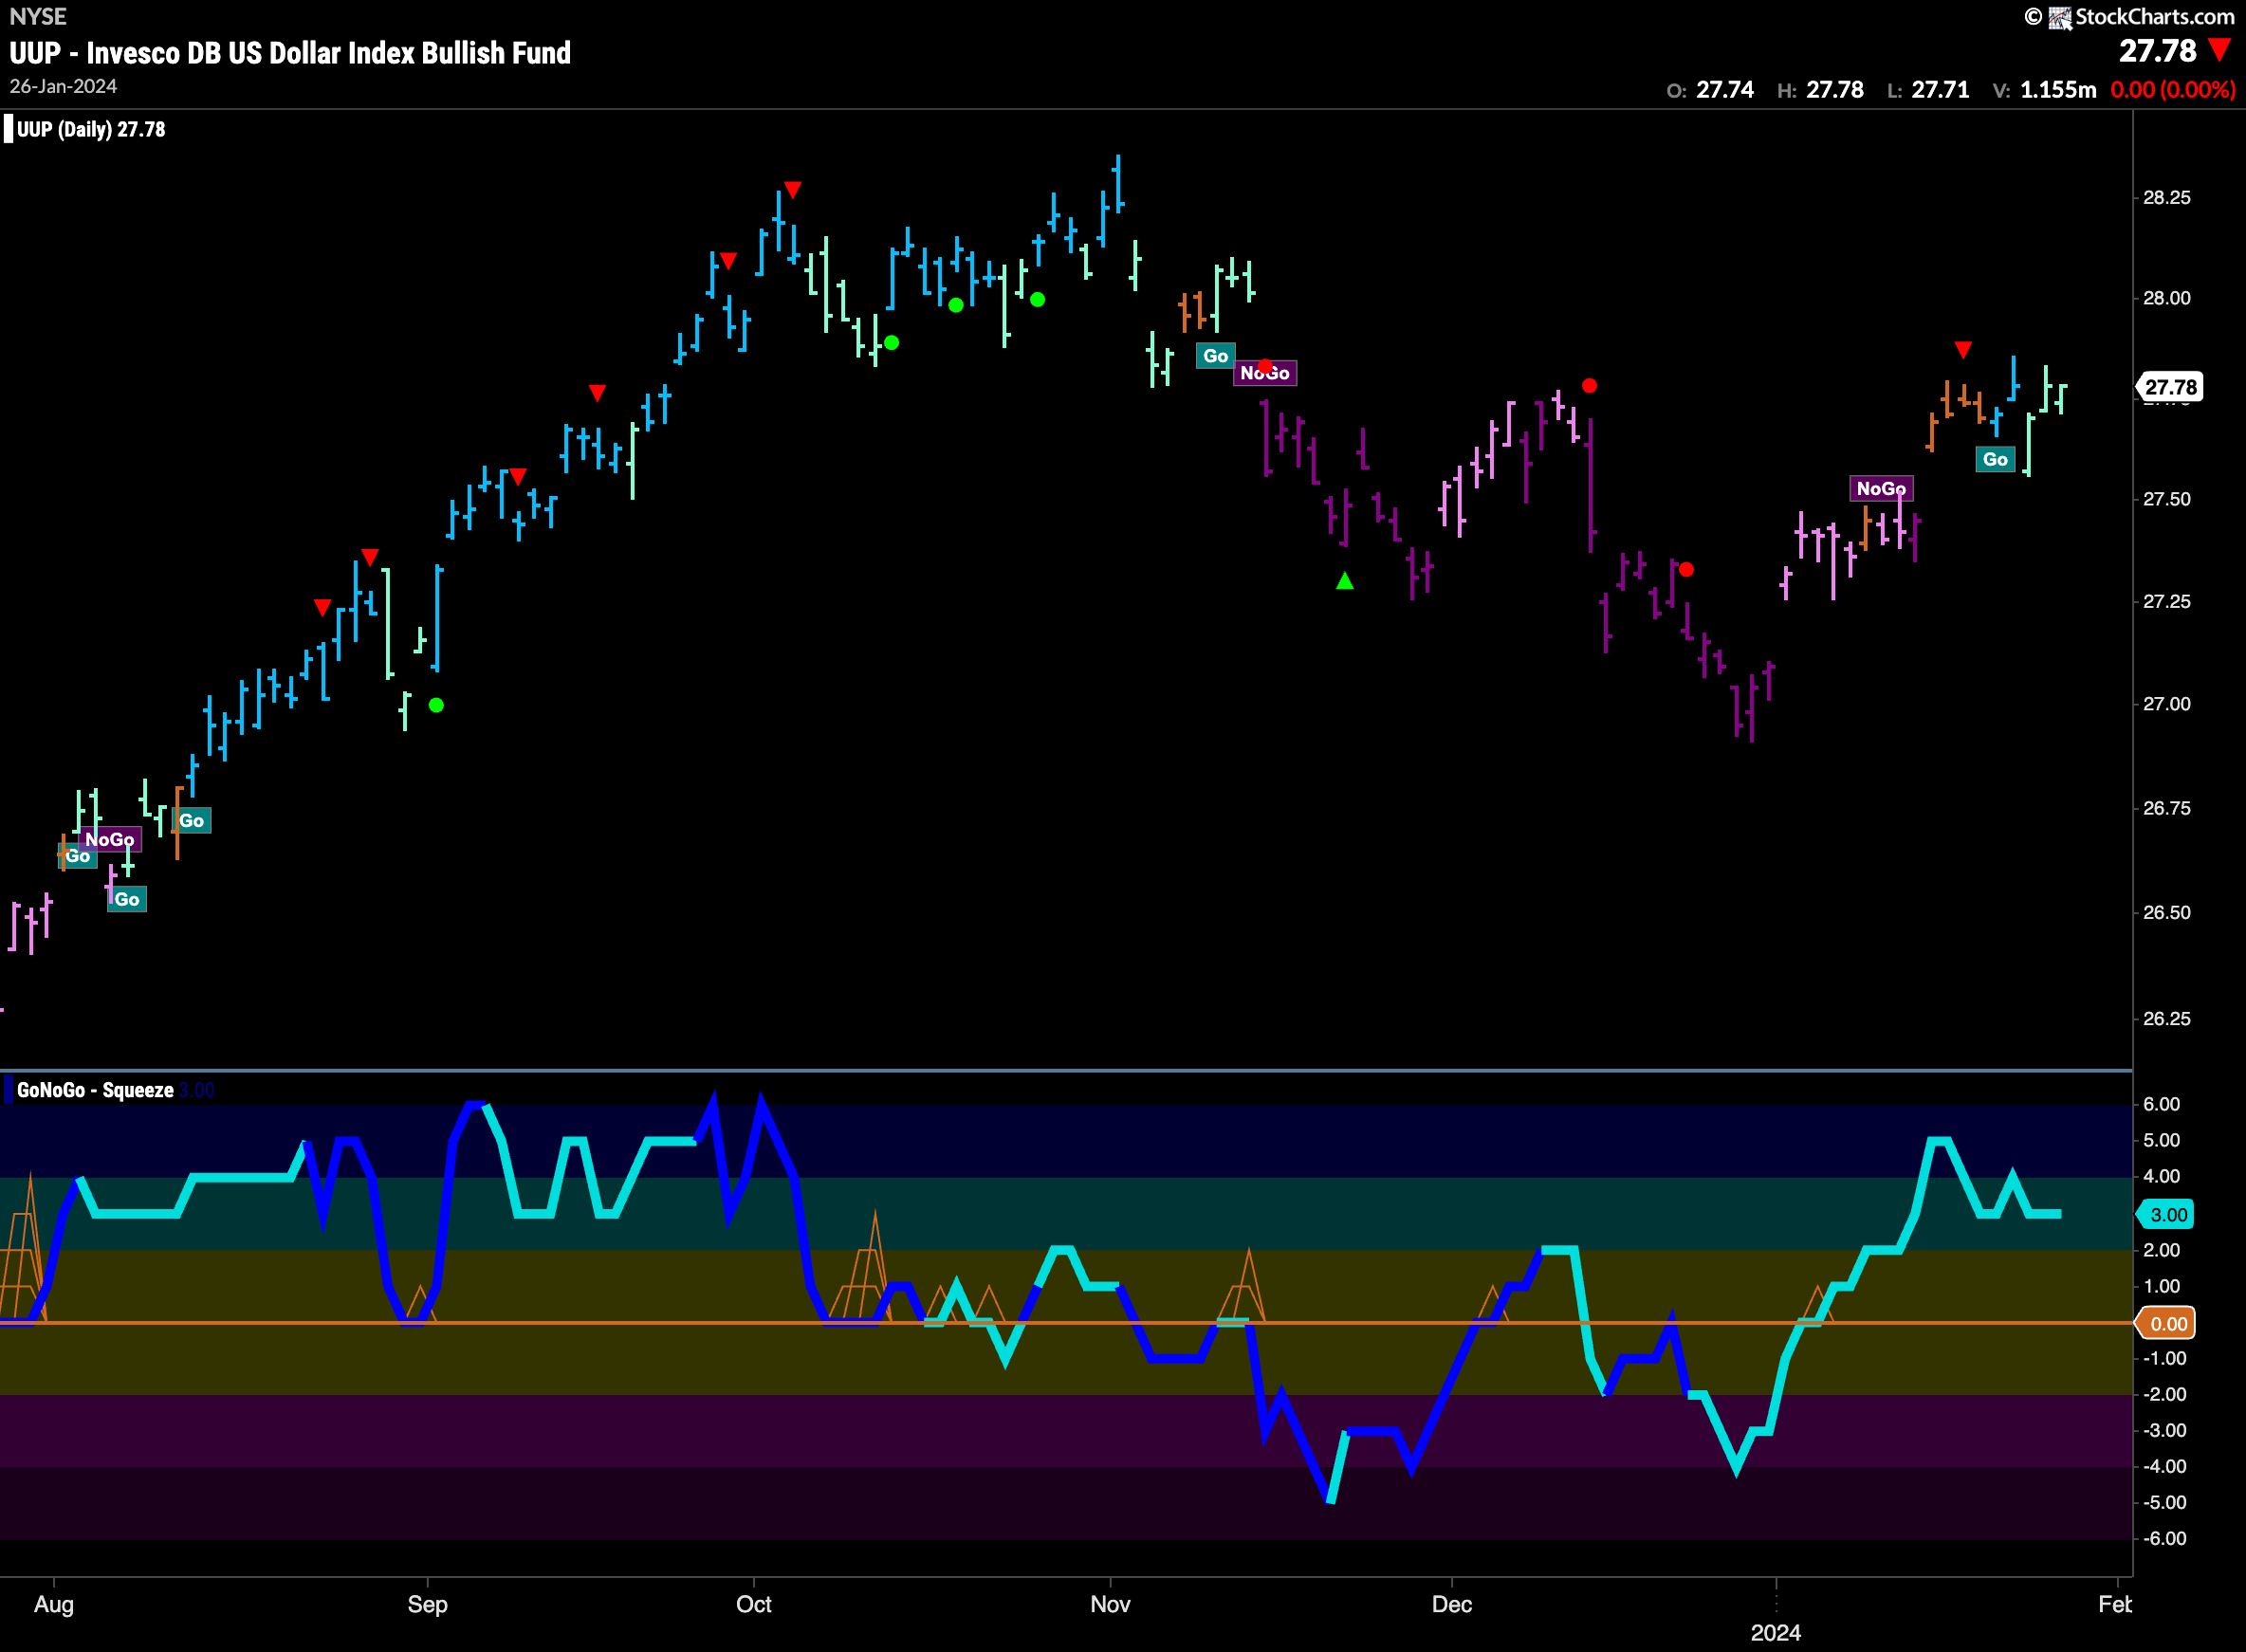
The daily chart below shows that a “Go” trend took shape at the beginning of last week. We now have seen 5 bars of “Go” colors although the back half of the week was dominated by weaker aqua bars. GoNoGo Oscillator is in positive territory at a value of 3 and so no longer overbought. We will watch to see if prices can consolidate at these levels and potentially break to new highs.
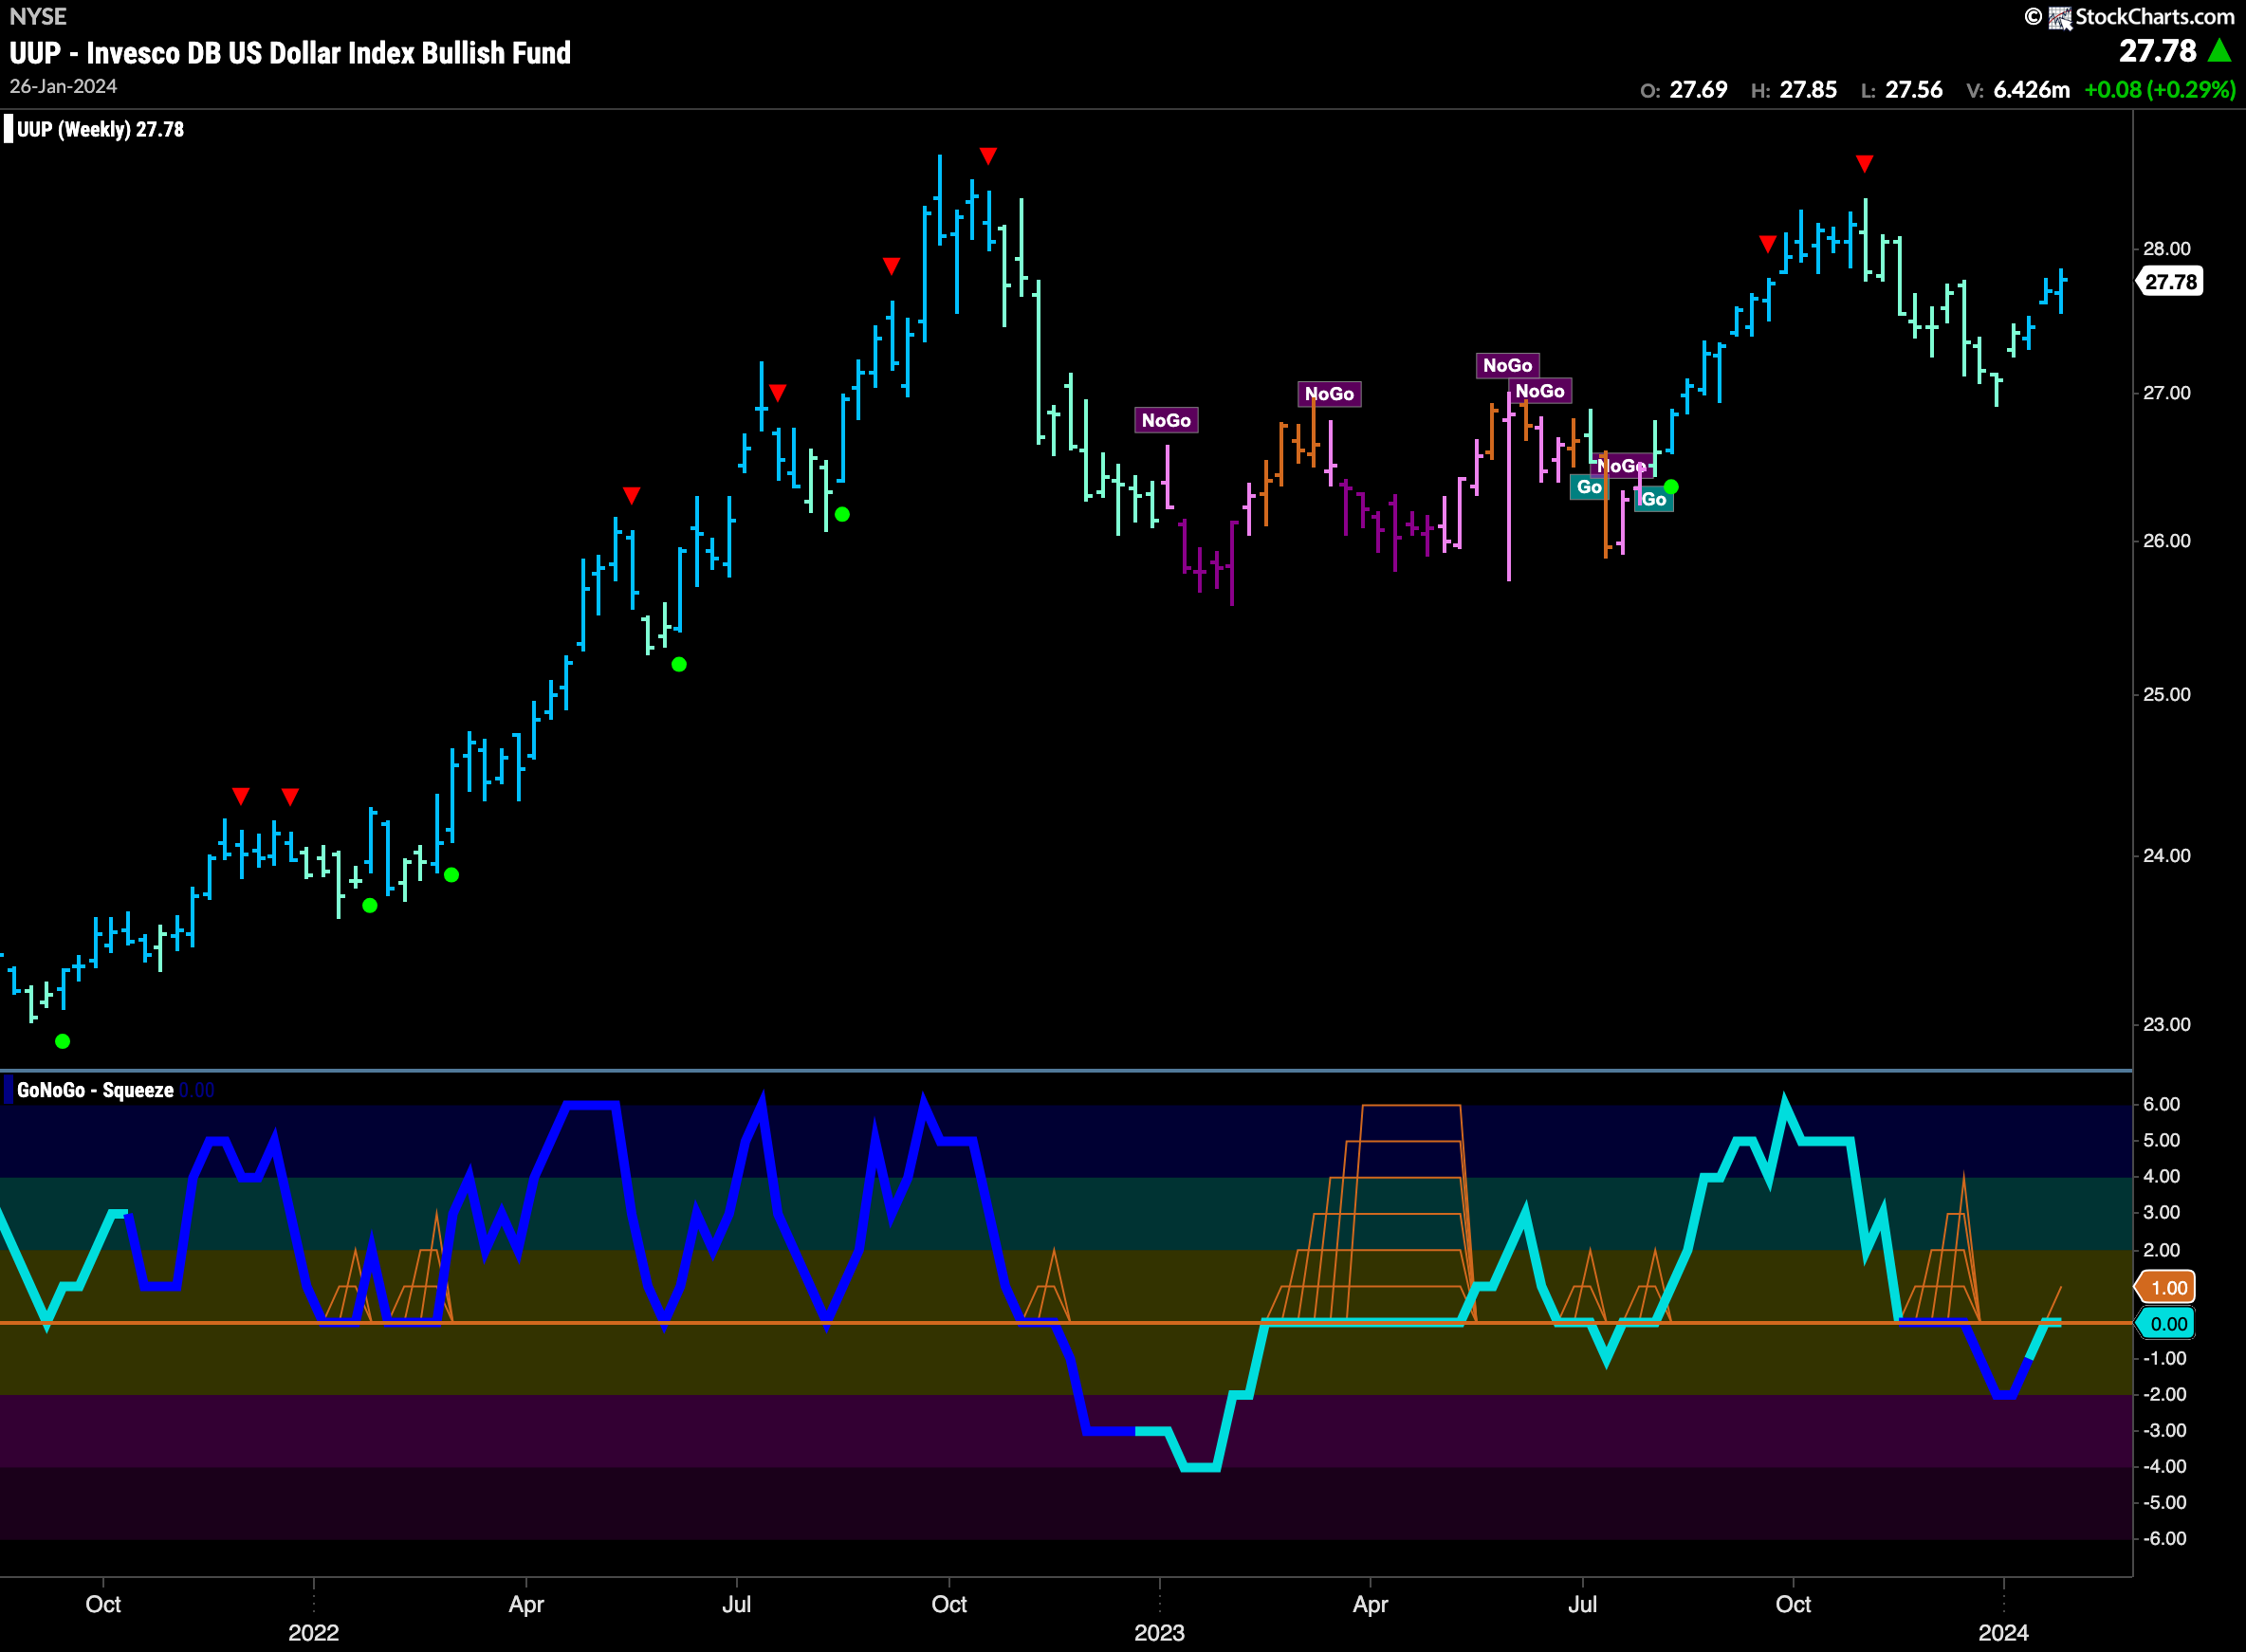
The weekly chart below shows that the “Go” trend has so far held and in fact the GoNoGo Trend indicator is painting bright blue bars. This tells us that using the weight of the evidence approach, the trend has strengthened this week. GoNoGo Oscillator has risen to test the zero line from below and it remained there this week. This will be very important to see if the oscillator can regain positive territory and lend its support to the “Go” trend. If the oscillator is able to move into positive territory we would look for a new higher high in price.
Oil Sees Strength this Week
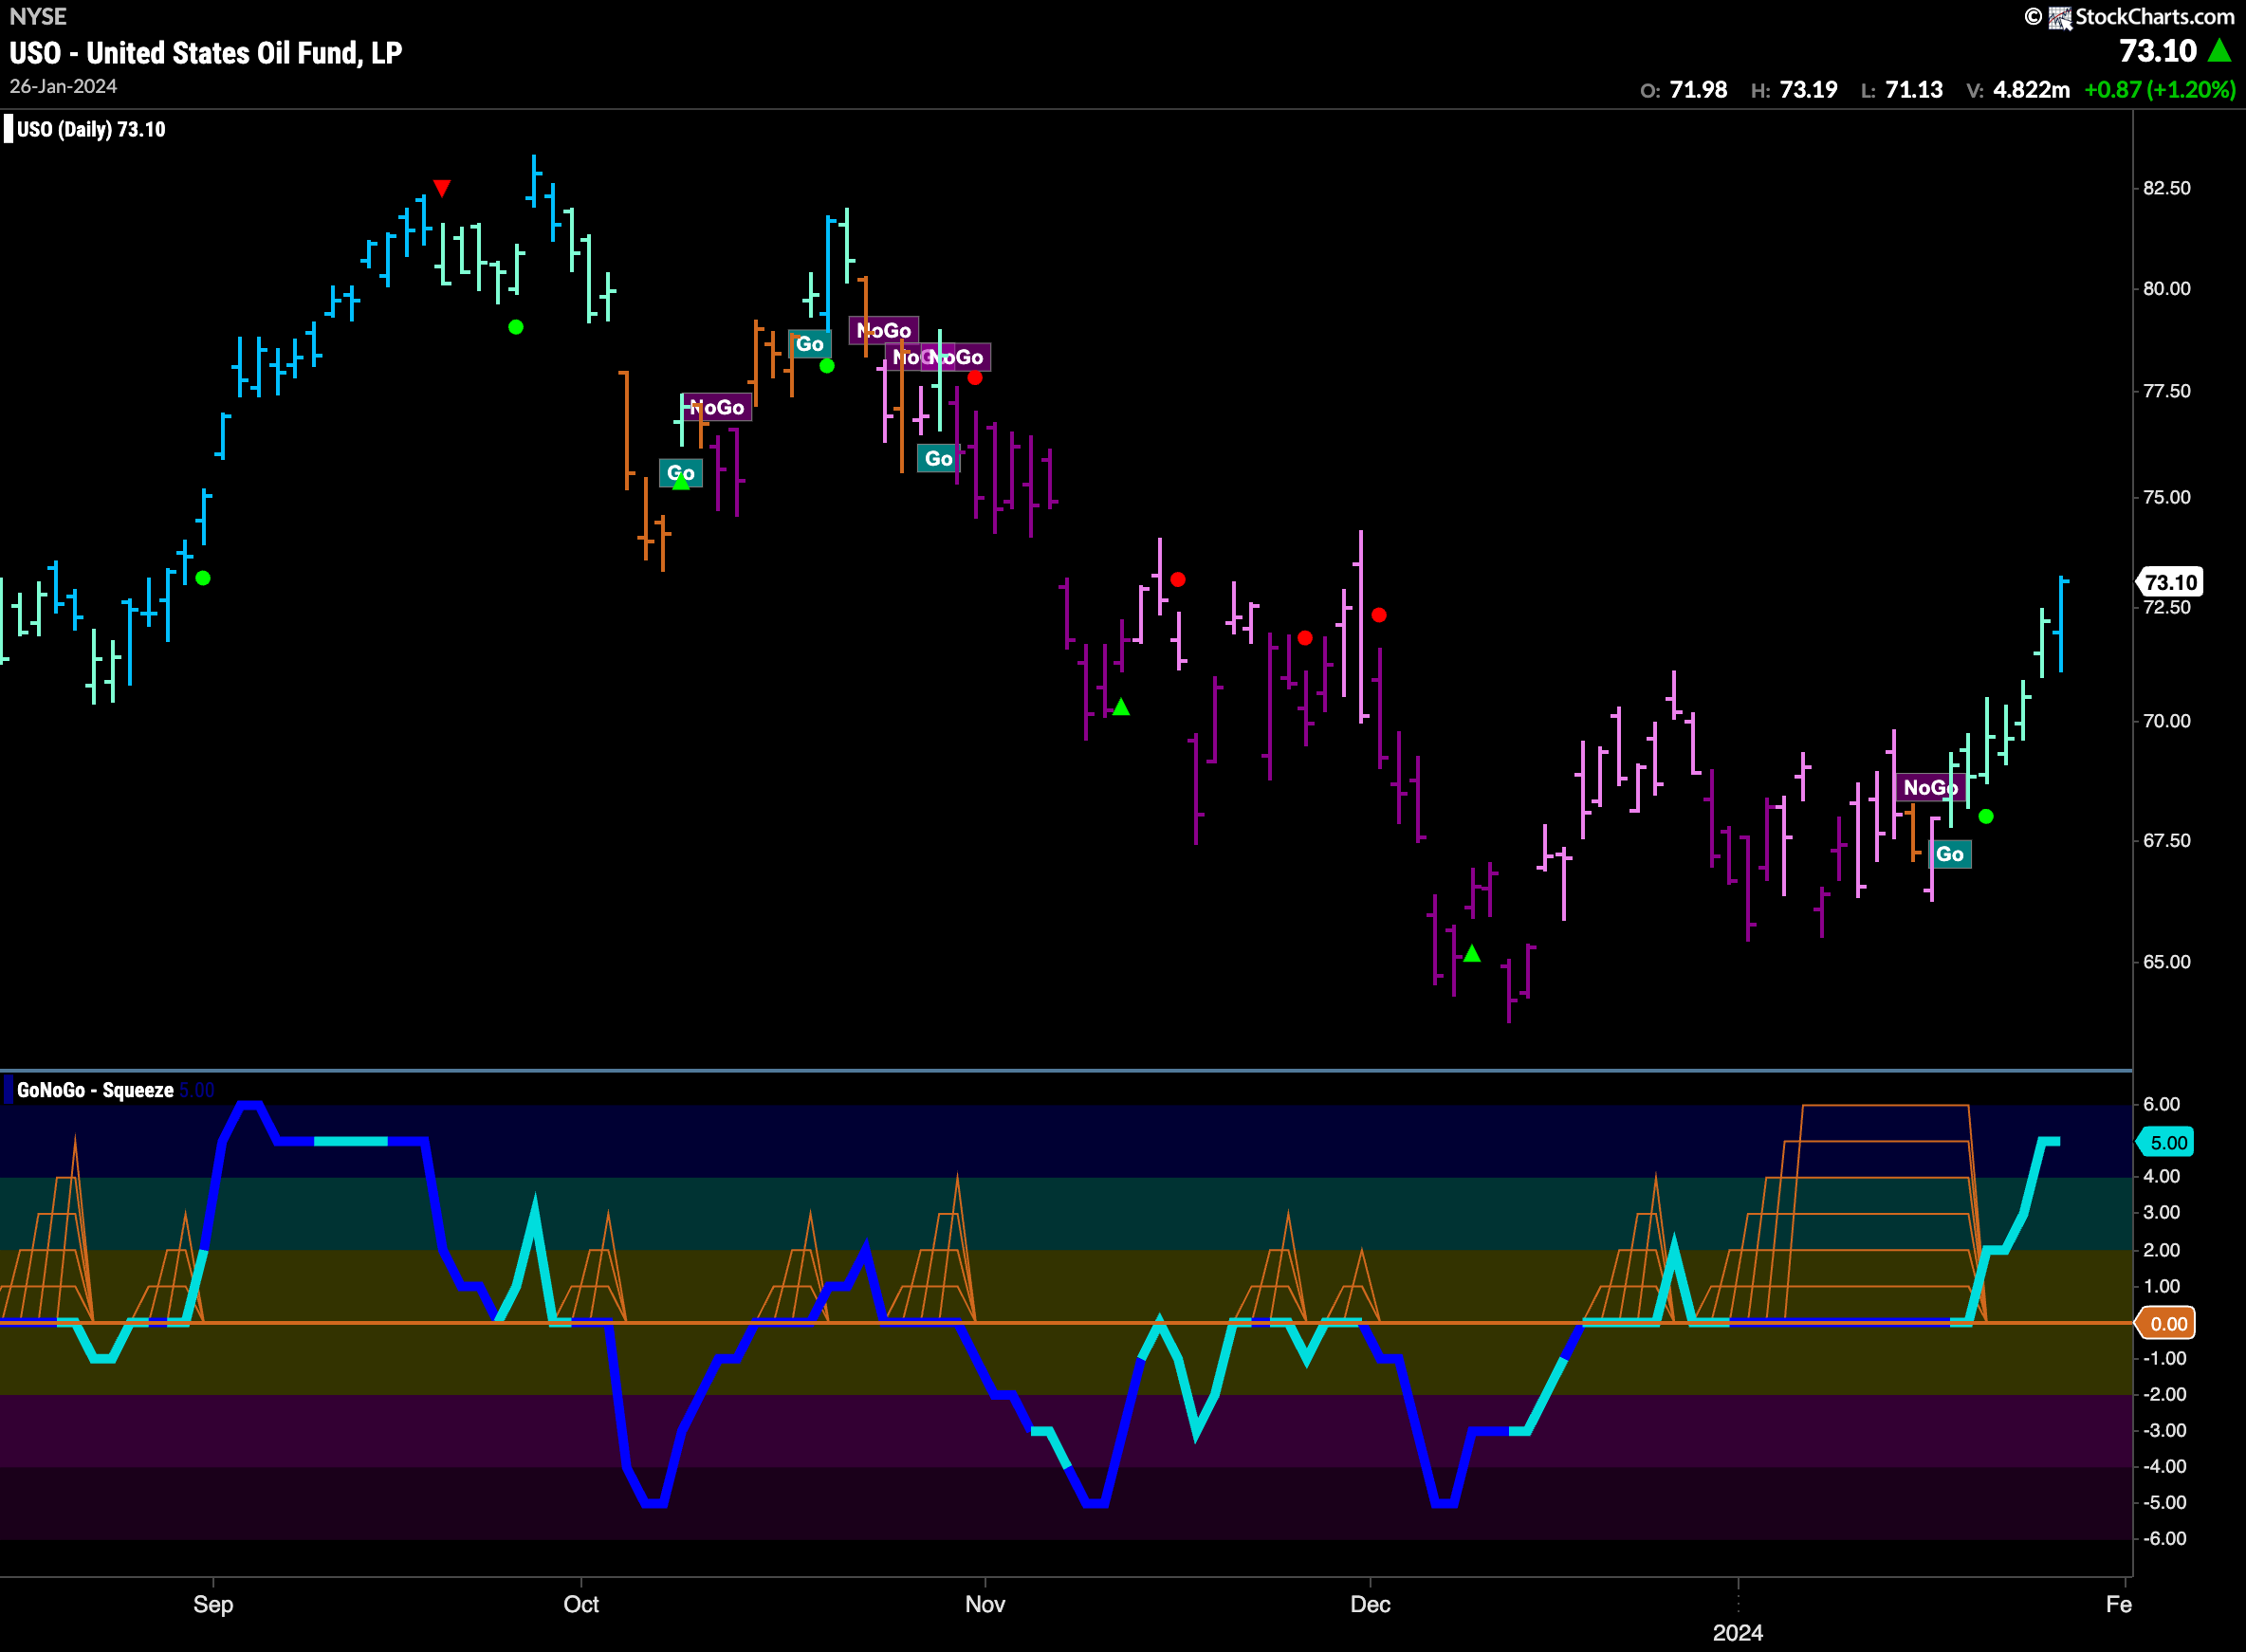
GoNoGo Trend shows that the new “Go” trend that we spotted last week has persisted this week and in fact has strengthened as the week ends with a strong blue “Go” bar. This has followed an oscillator break out of a Max GoNoGo Squeeze into positive territory which informs us that there is a surge of momentum in the direction of the “Go” trend. After periods of reduced volatility can come periods of higher volatility and that is indeed what we saw last week as price raced higher.
Gold Fails as “NoGo” Appears
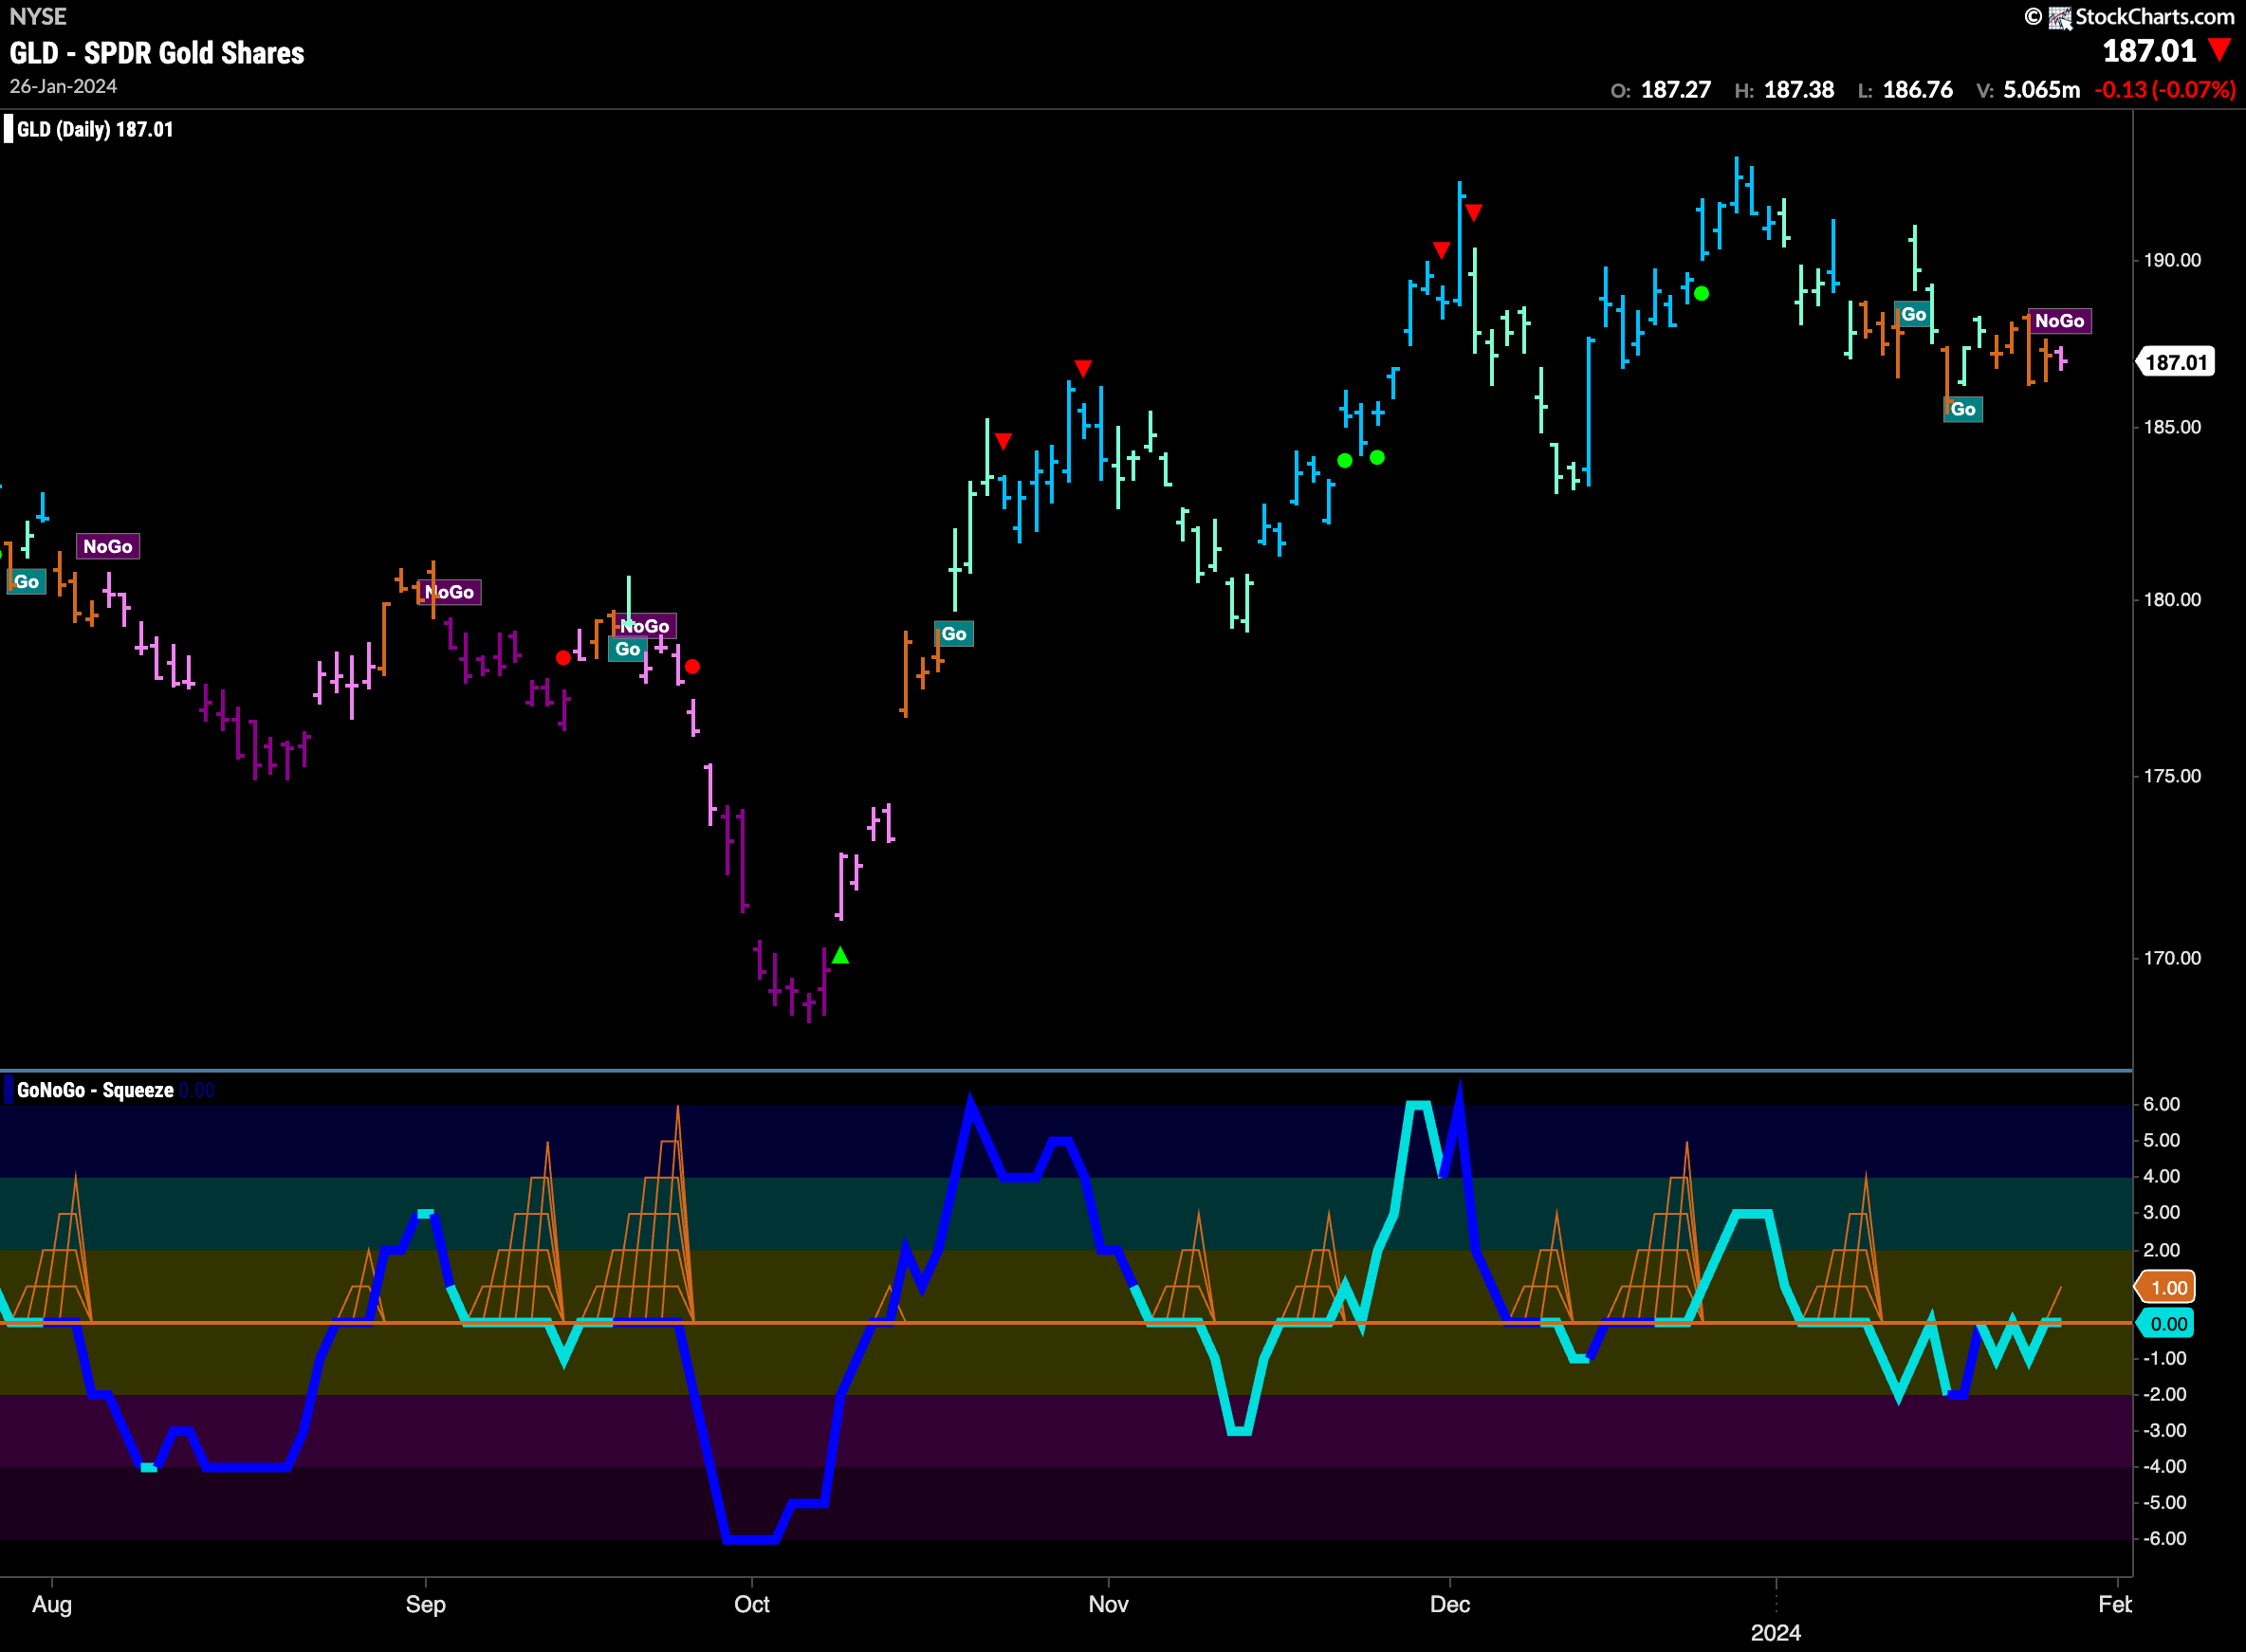
GoNoGo Trend saw amber “Go Fish” bars of uncertainty give way to a pink “NoGo” bars at the end of the week. After falling from the most recent high GoNoGo Oscillator fell into negative territory and GoNoGo Trend painted a lot of amber “Go Fish” bars before finally succumbing to a change in trend. Now, GoNoGo Oscillator is testing the zero line again from below. If it is rejected here, we will likely see the “NoGo” trend strengthen and price make an attempt at new lows.
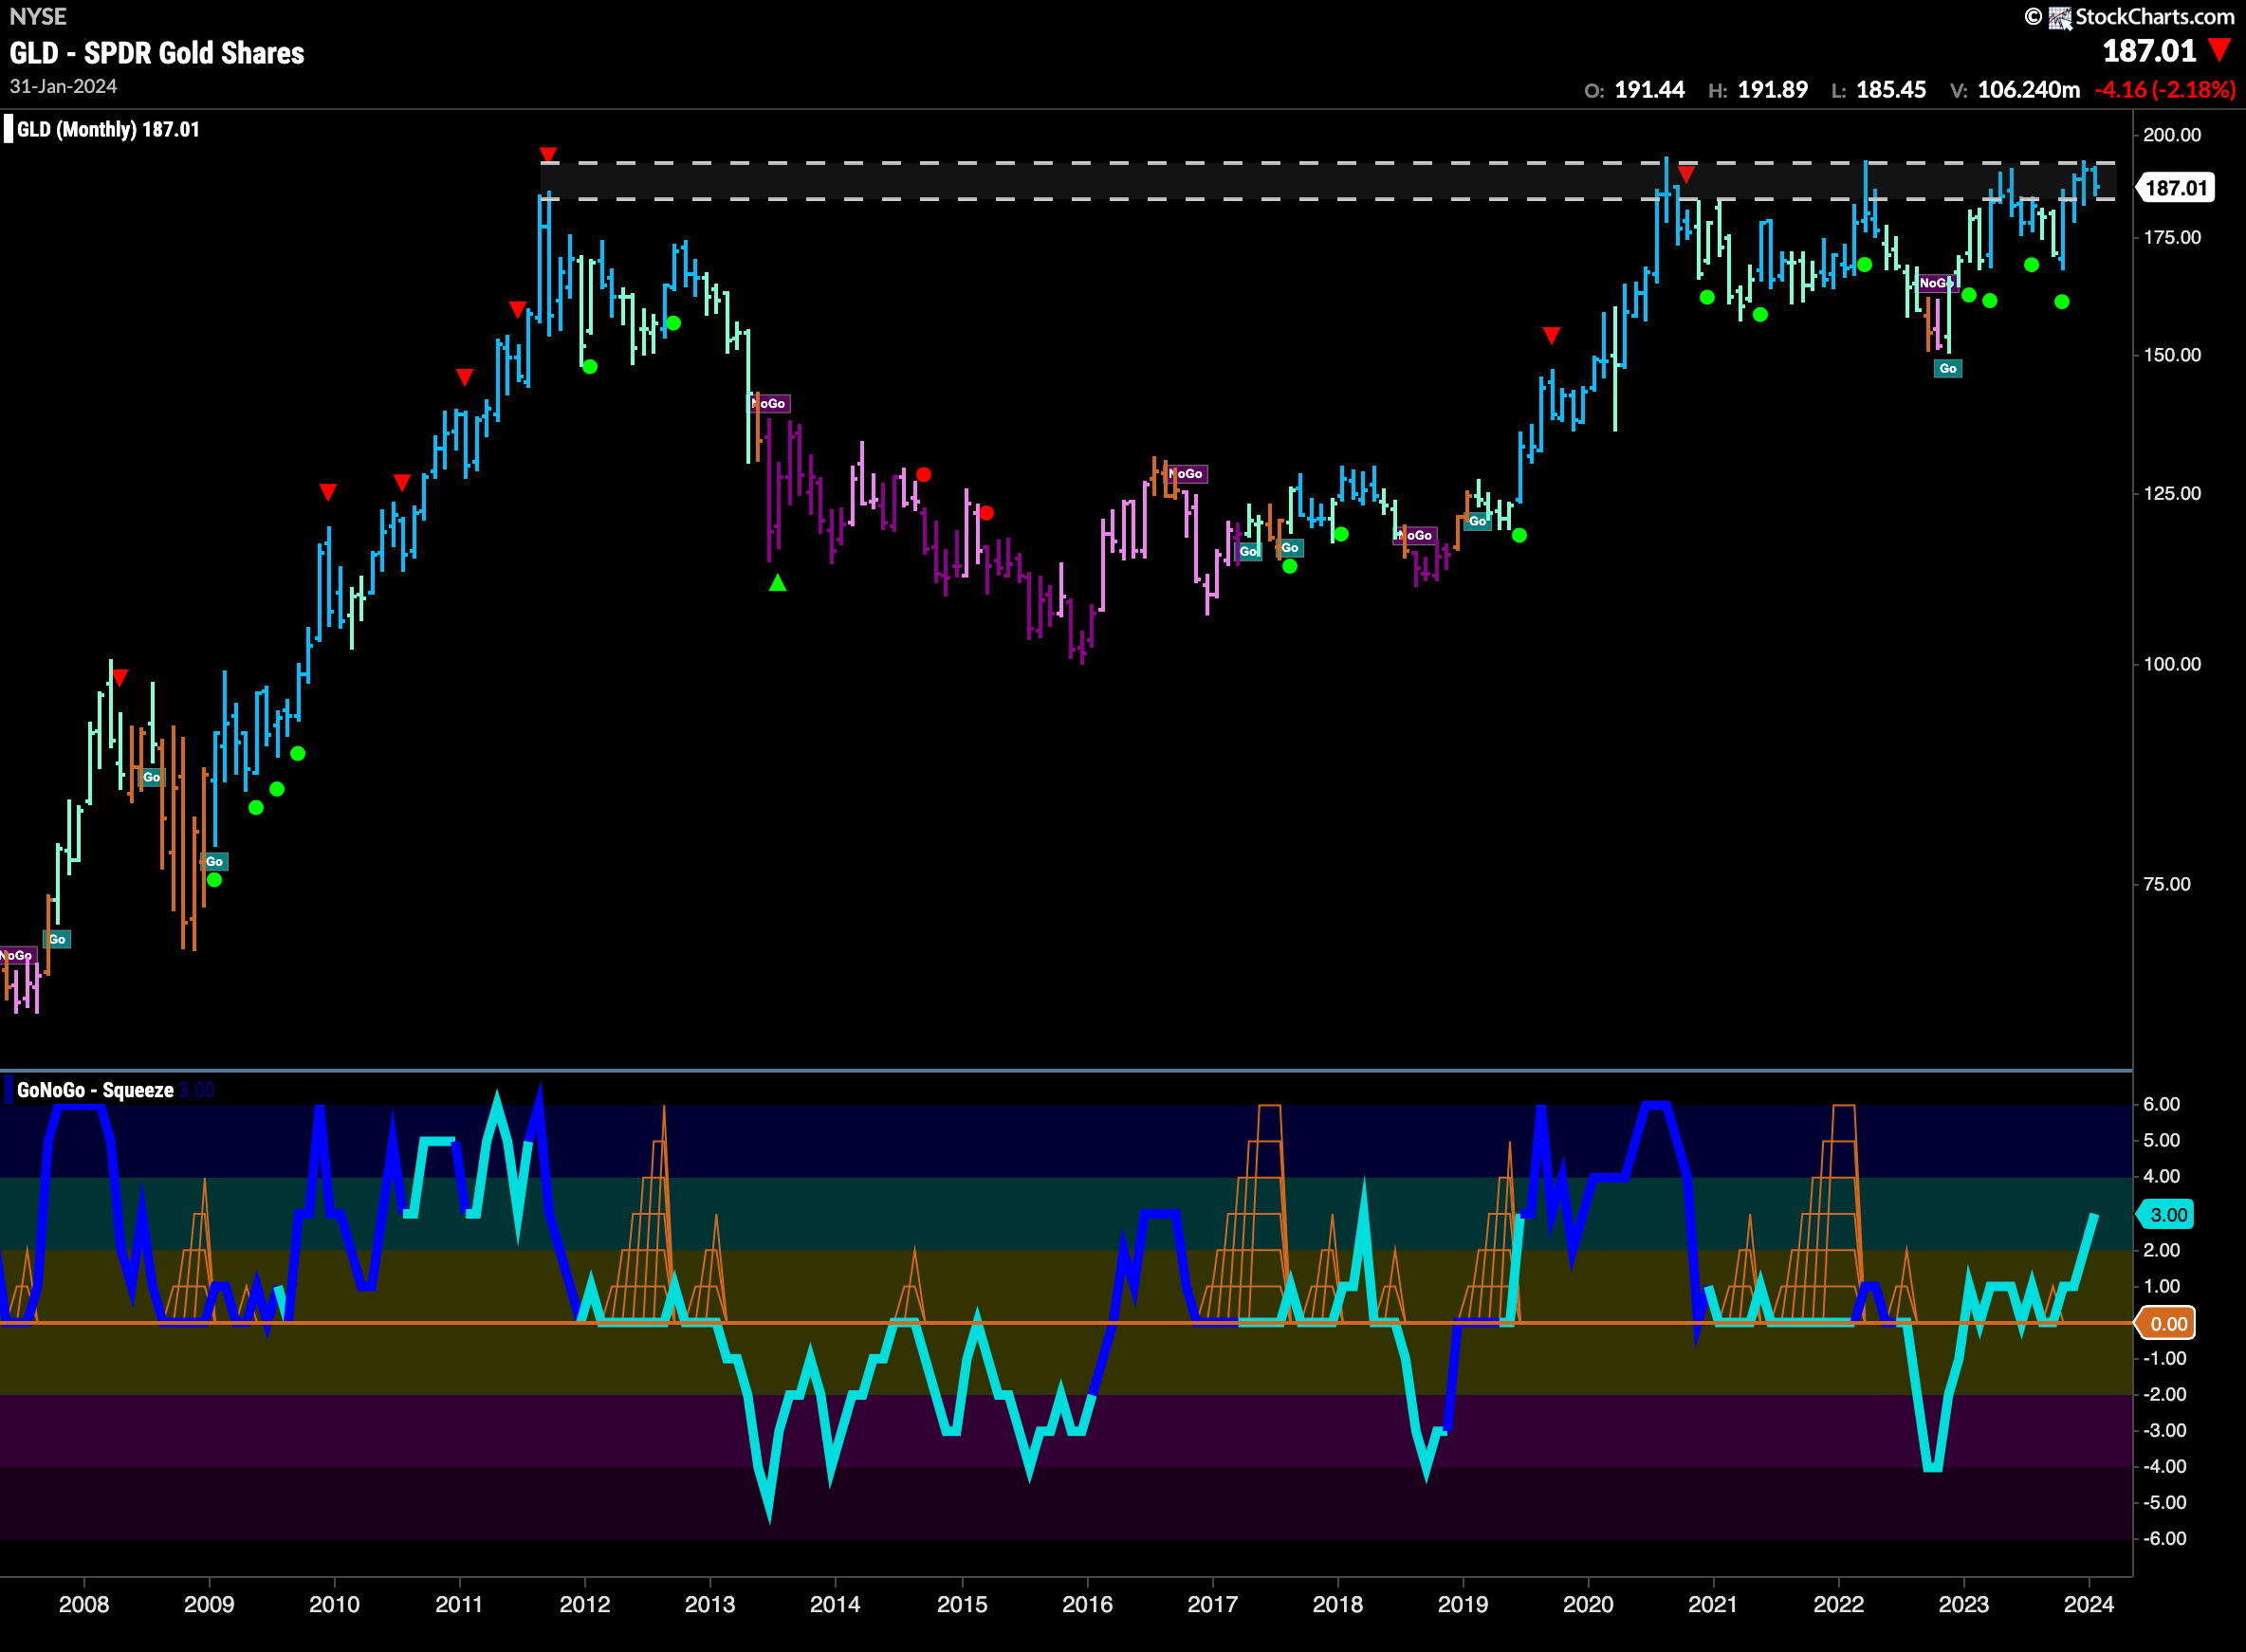
At the risk of sounding like a broken record, we can see just how strong the resistance is at these levels that Gold is having to deal with. Overhead supply is from levels that have proven to be resistance for over a decade. The bulls know that once this level is actually left behind we can expect big gains, but until that happens we still see this level as strong resistance.
Sector RelMap
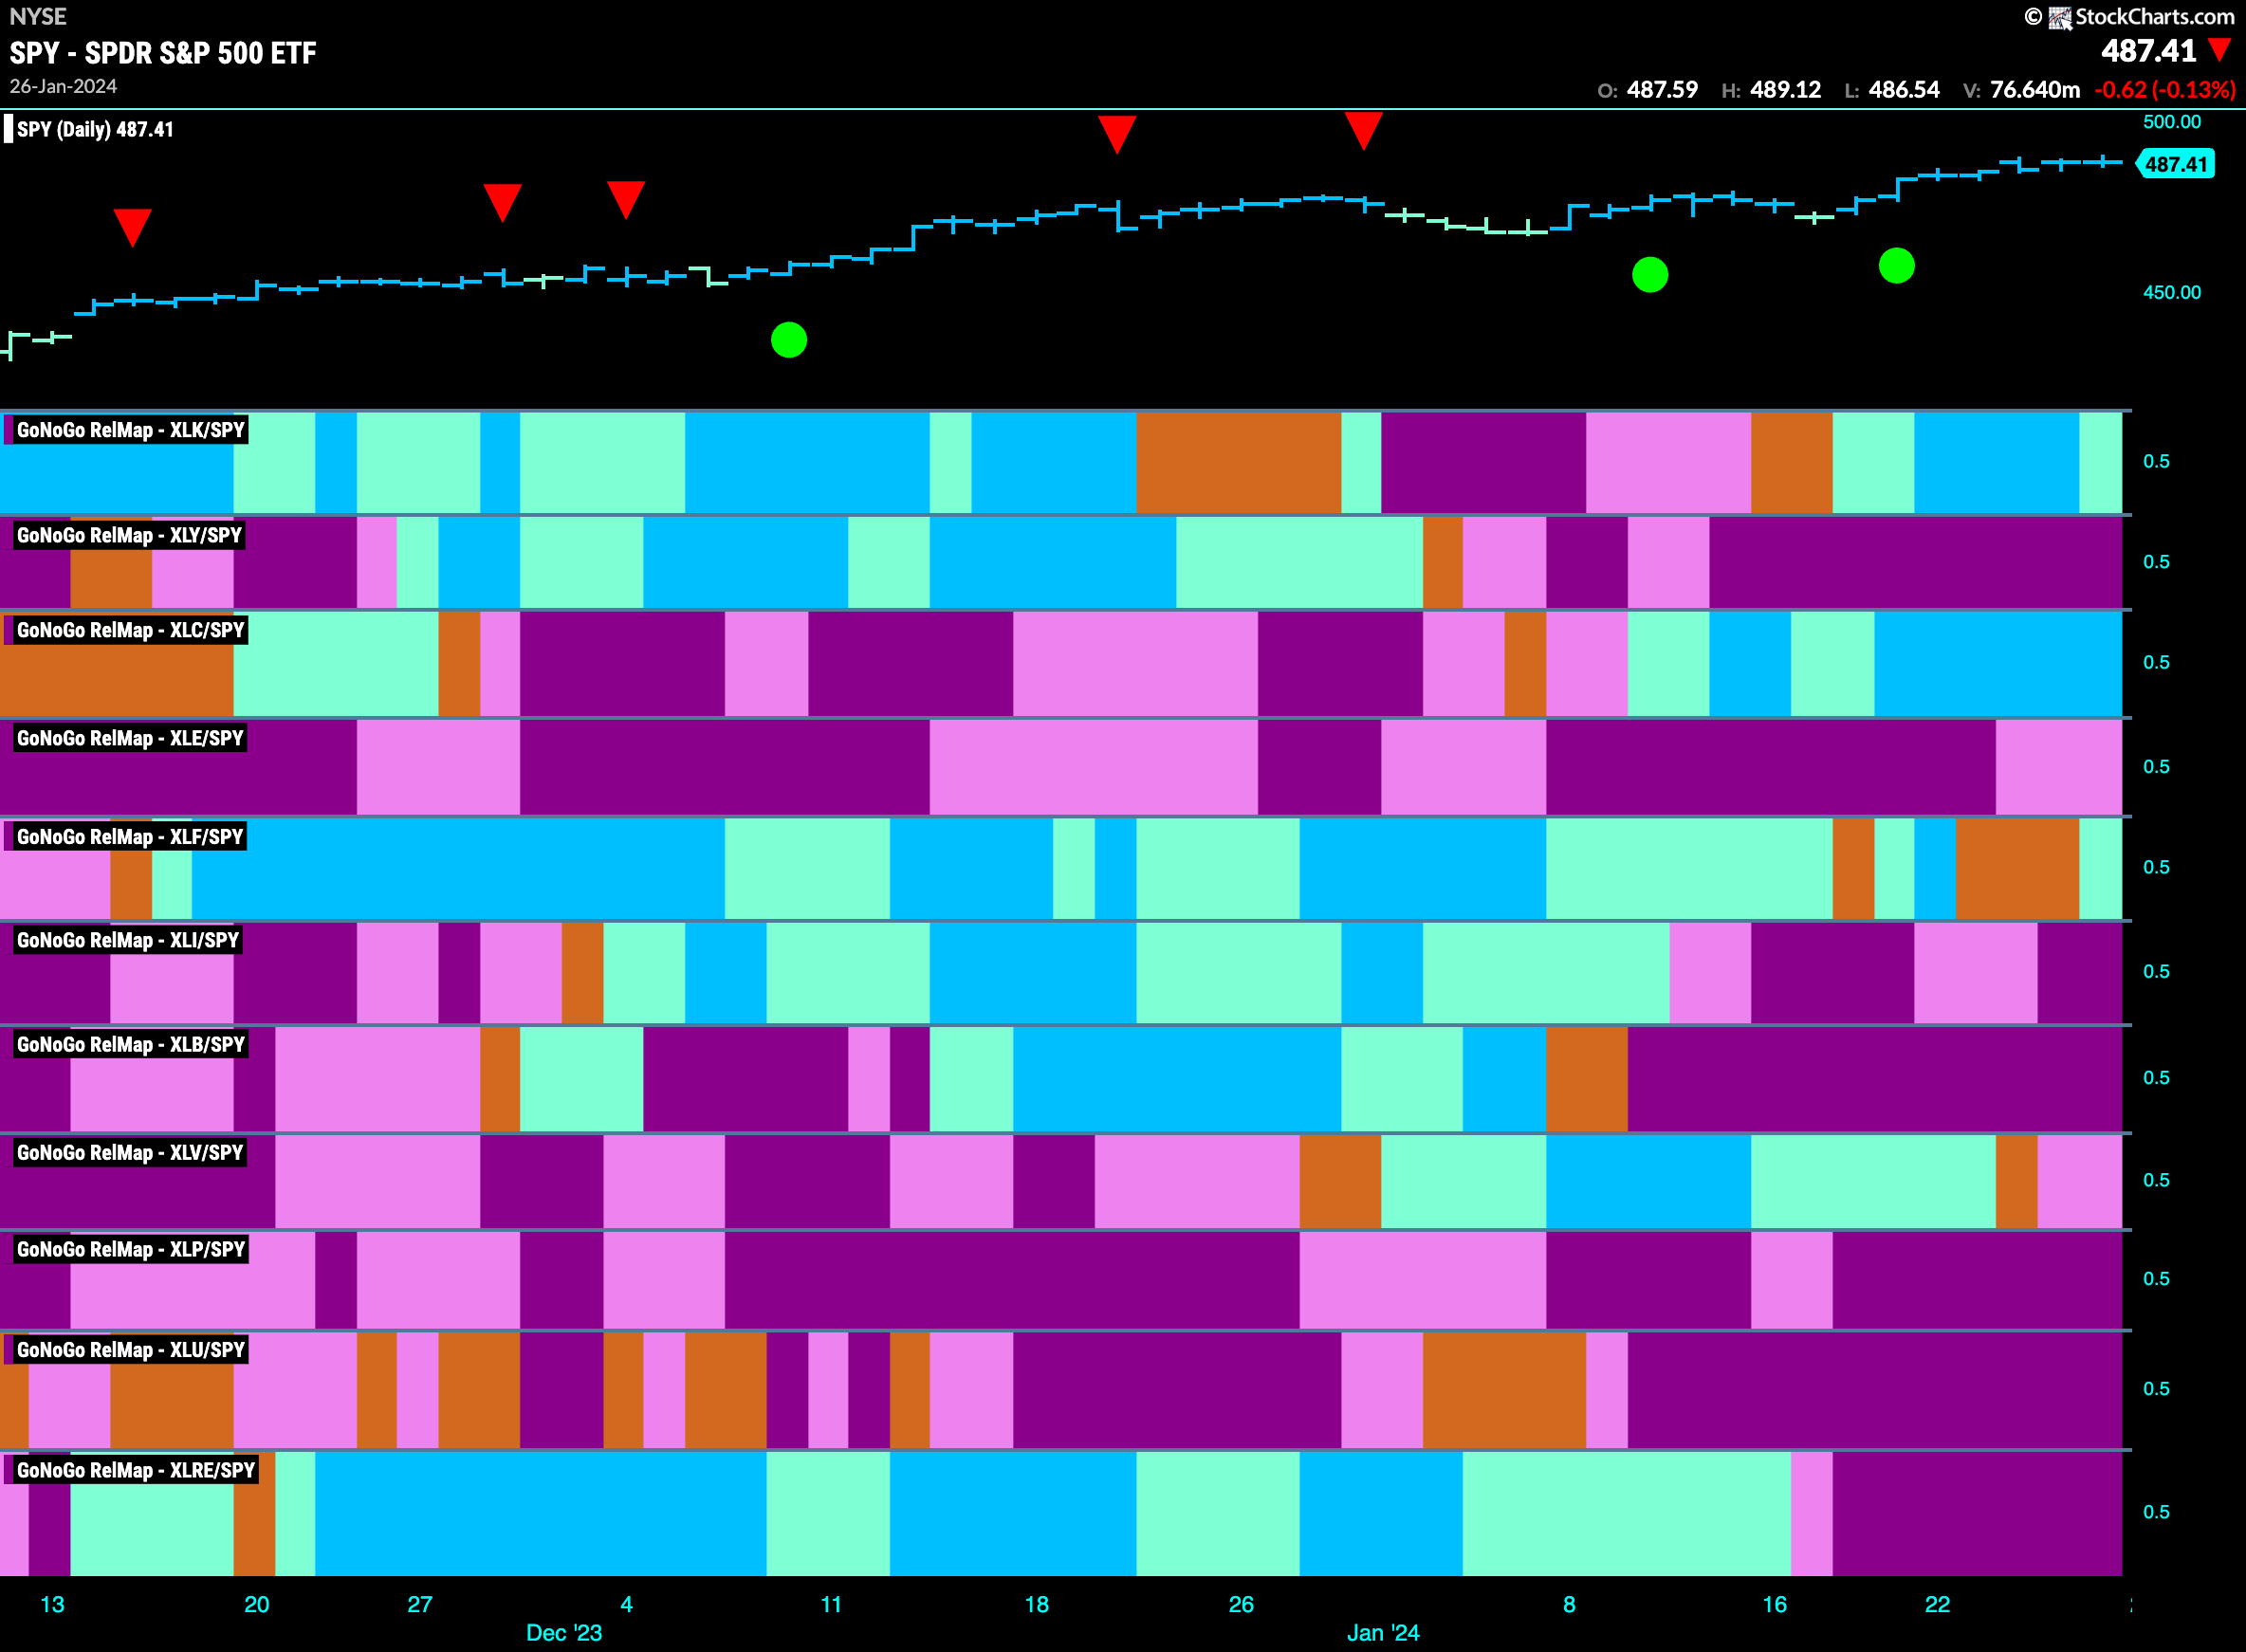
Below is the GoNoGo Sector RelMap. This GoNoGo RelMap applies the GoNoGo Trend to the relative strength ratios of the sectors to the base index. Looking at this map, we can quickly see where the relative outperformance is coming from as well as which sectors are lagging on a relative basis. 3 sectors are outperforming the base index this week. $XLK, $XLC, and $XLF, are painting “Go” bars.
Communications Sub-Group RelMap
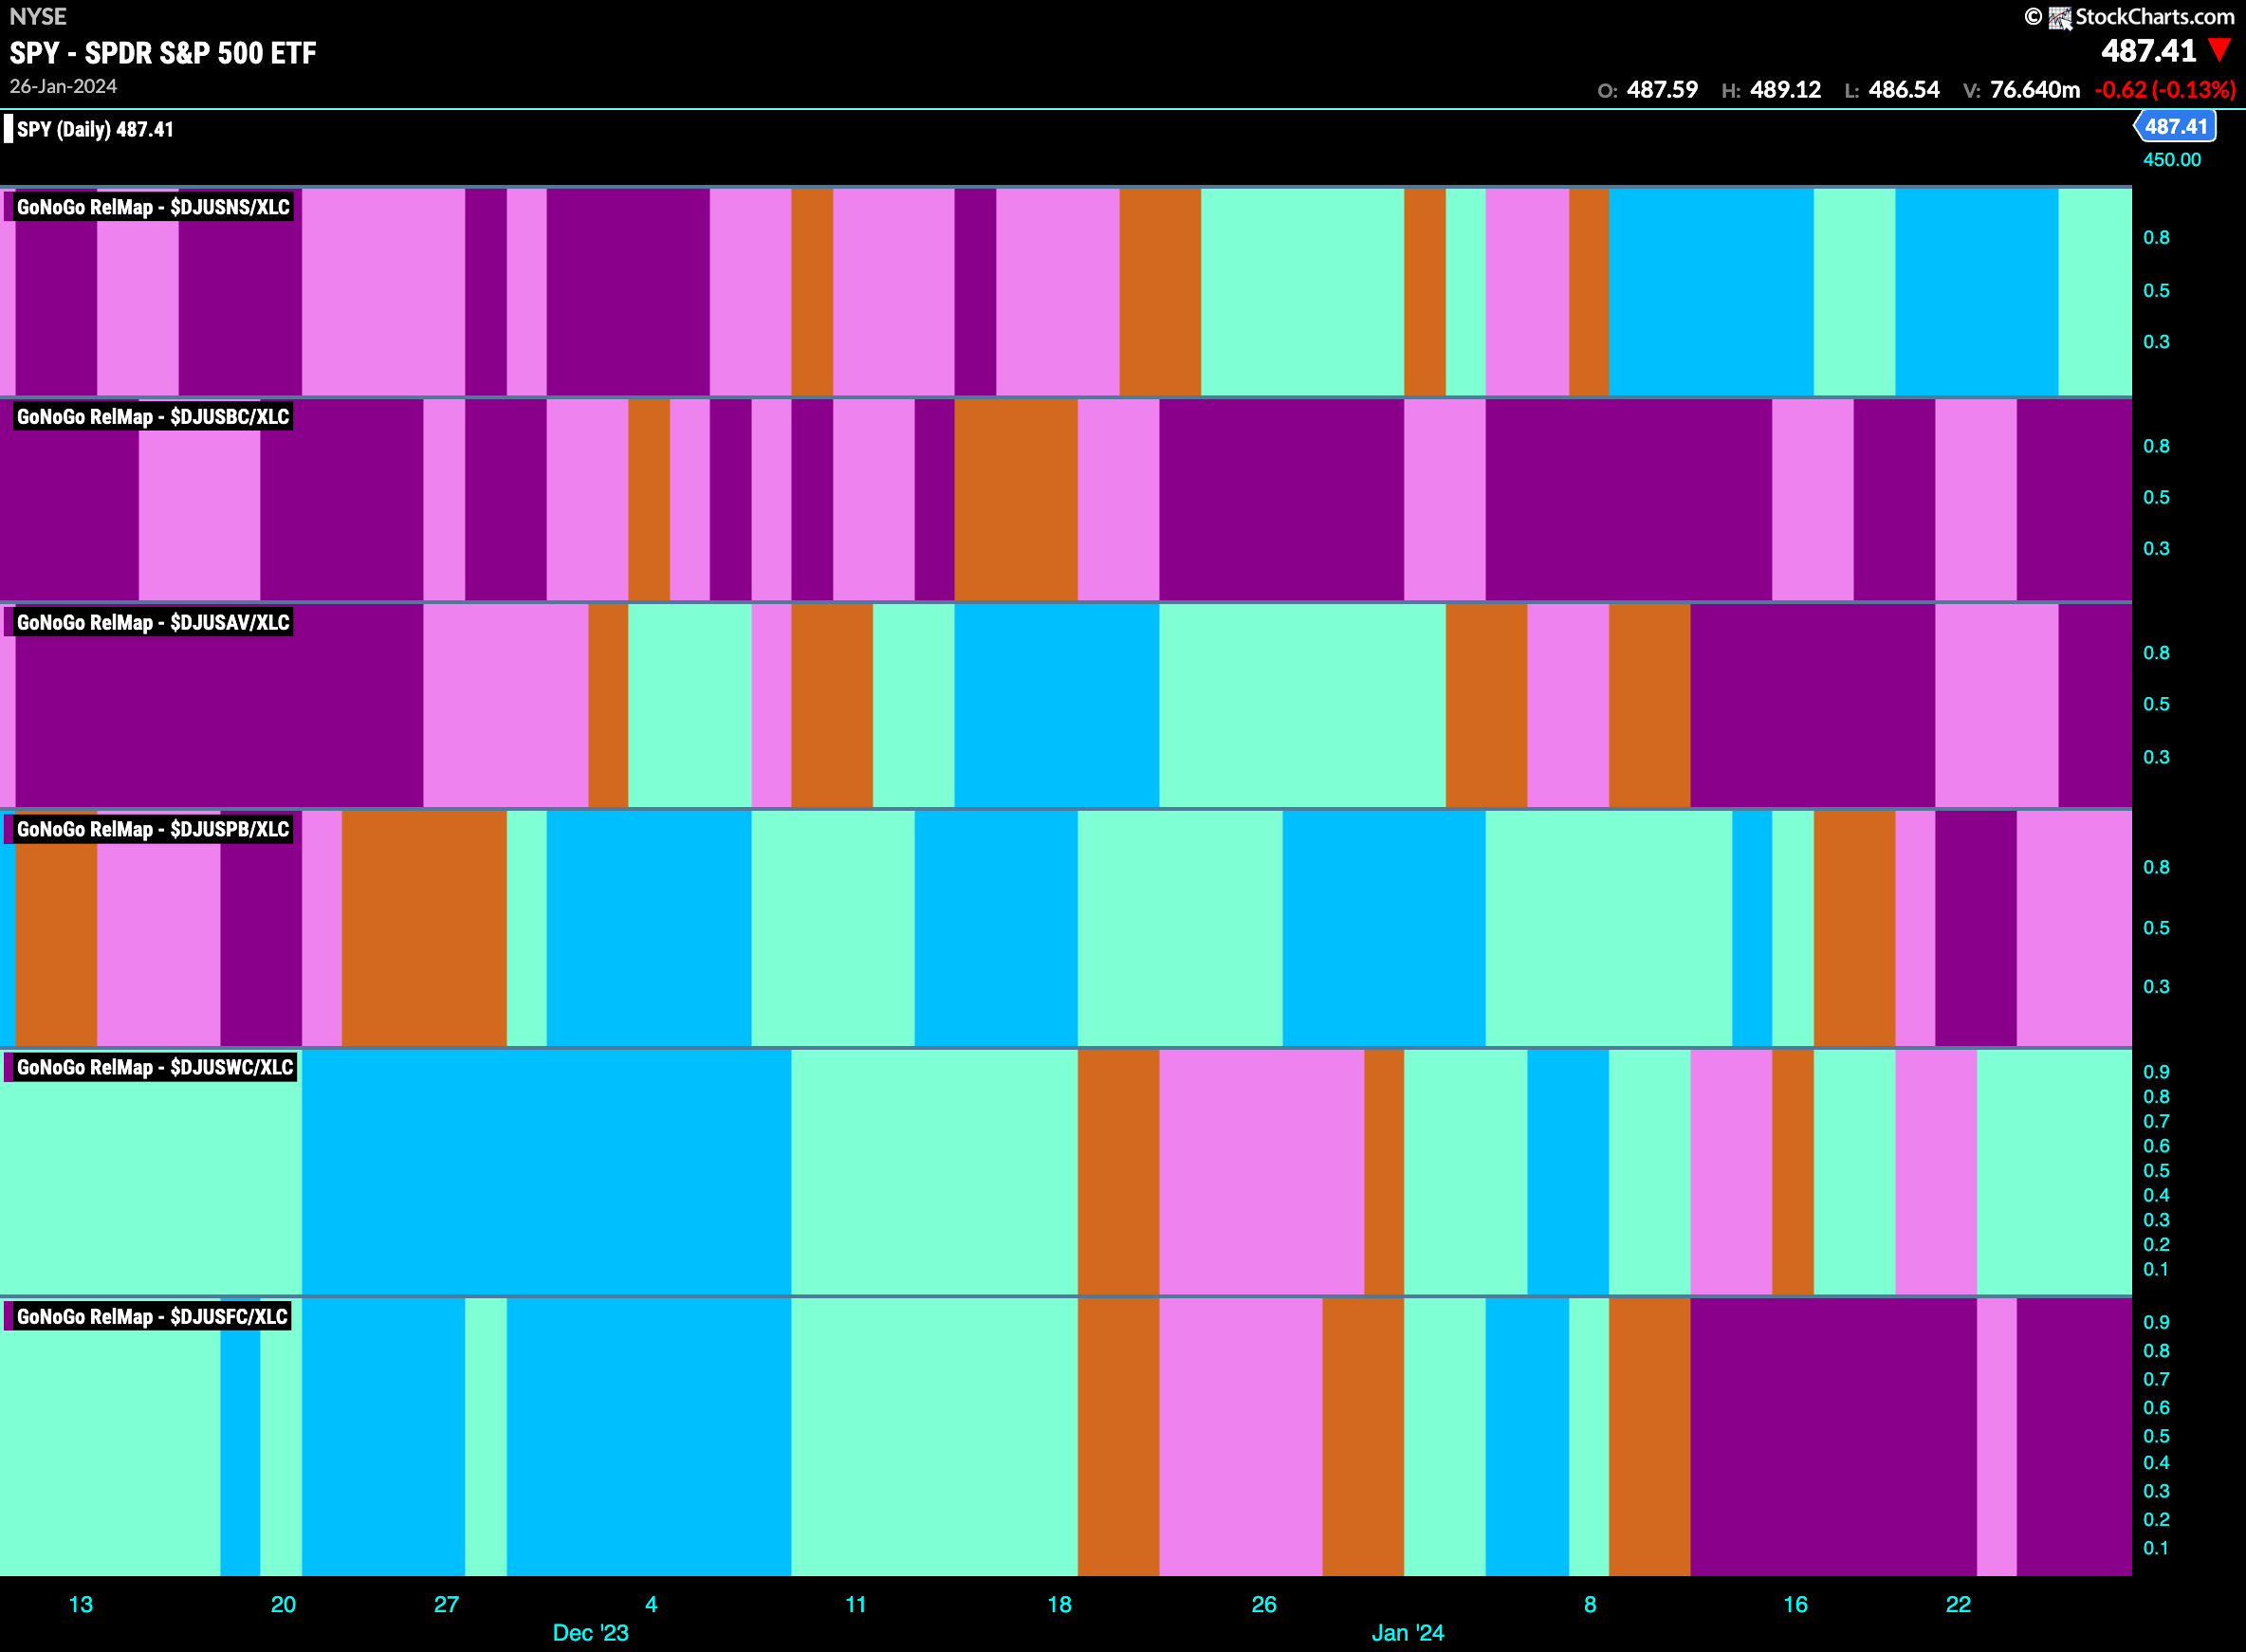
The GoNoGo Sector RelMap above shows that the communications sector continues to outperform on a relative basis for another week. Below, we see the individual groups of the sector relative to the sector itself. We apply the GoNoGo Trend to those ratios and see that the internet index is the strongest sub group on a relative basis.
Take it to the $MAX!
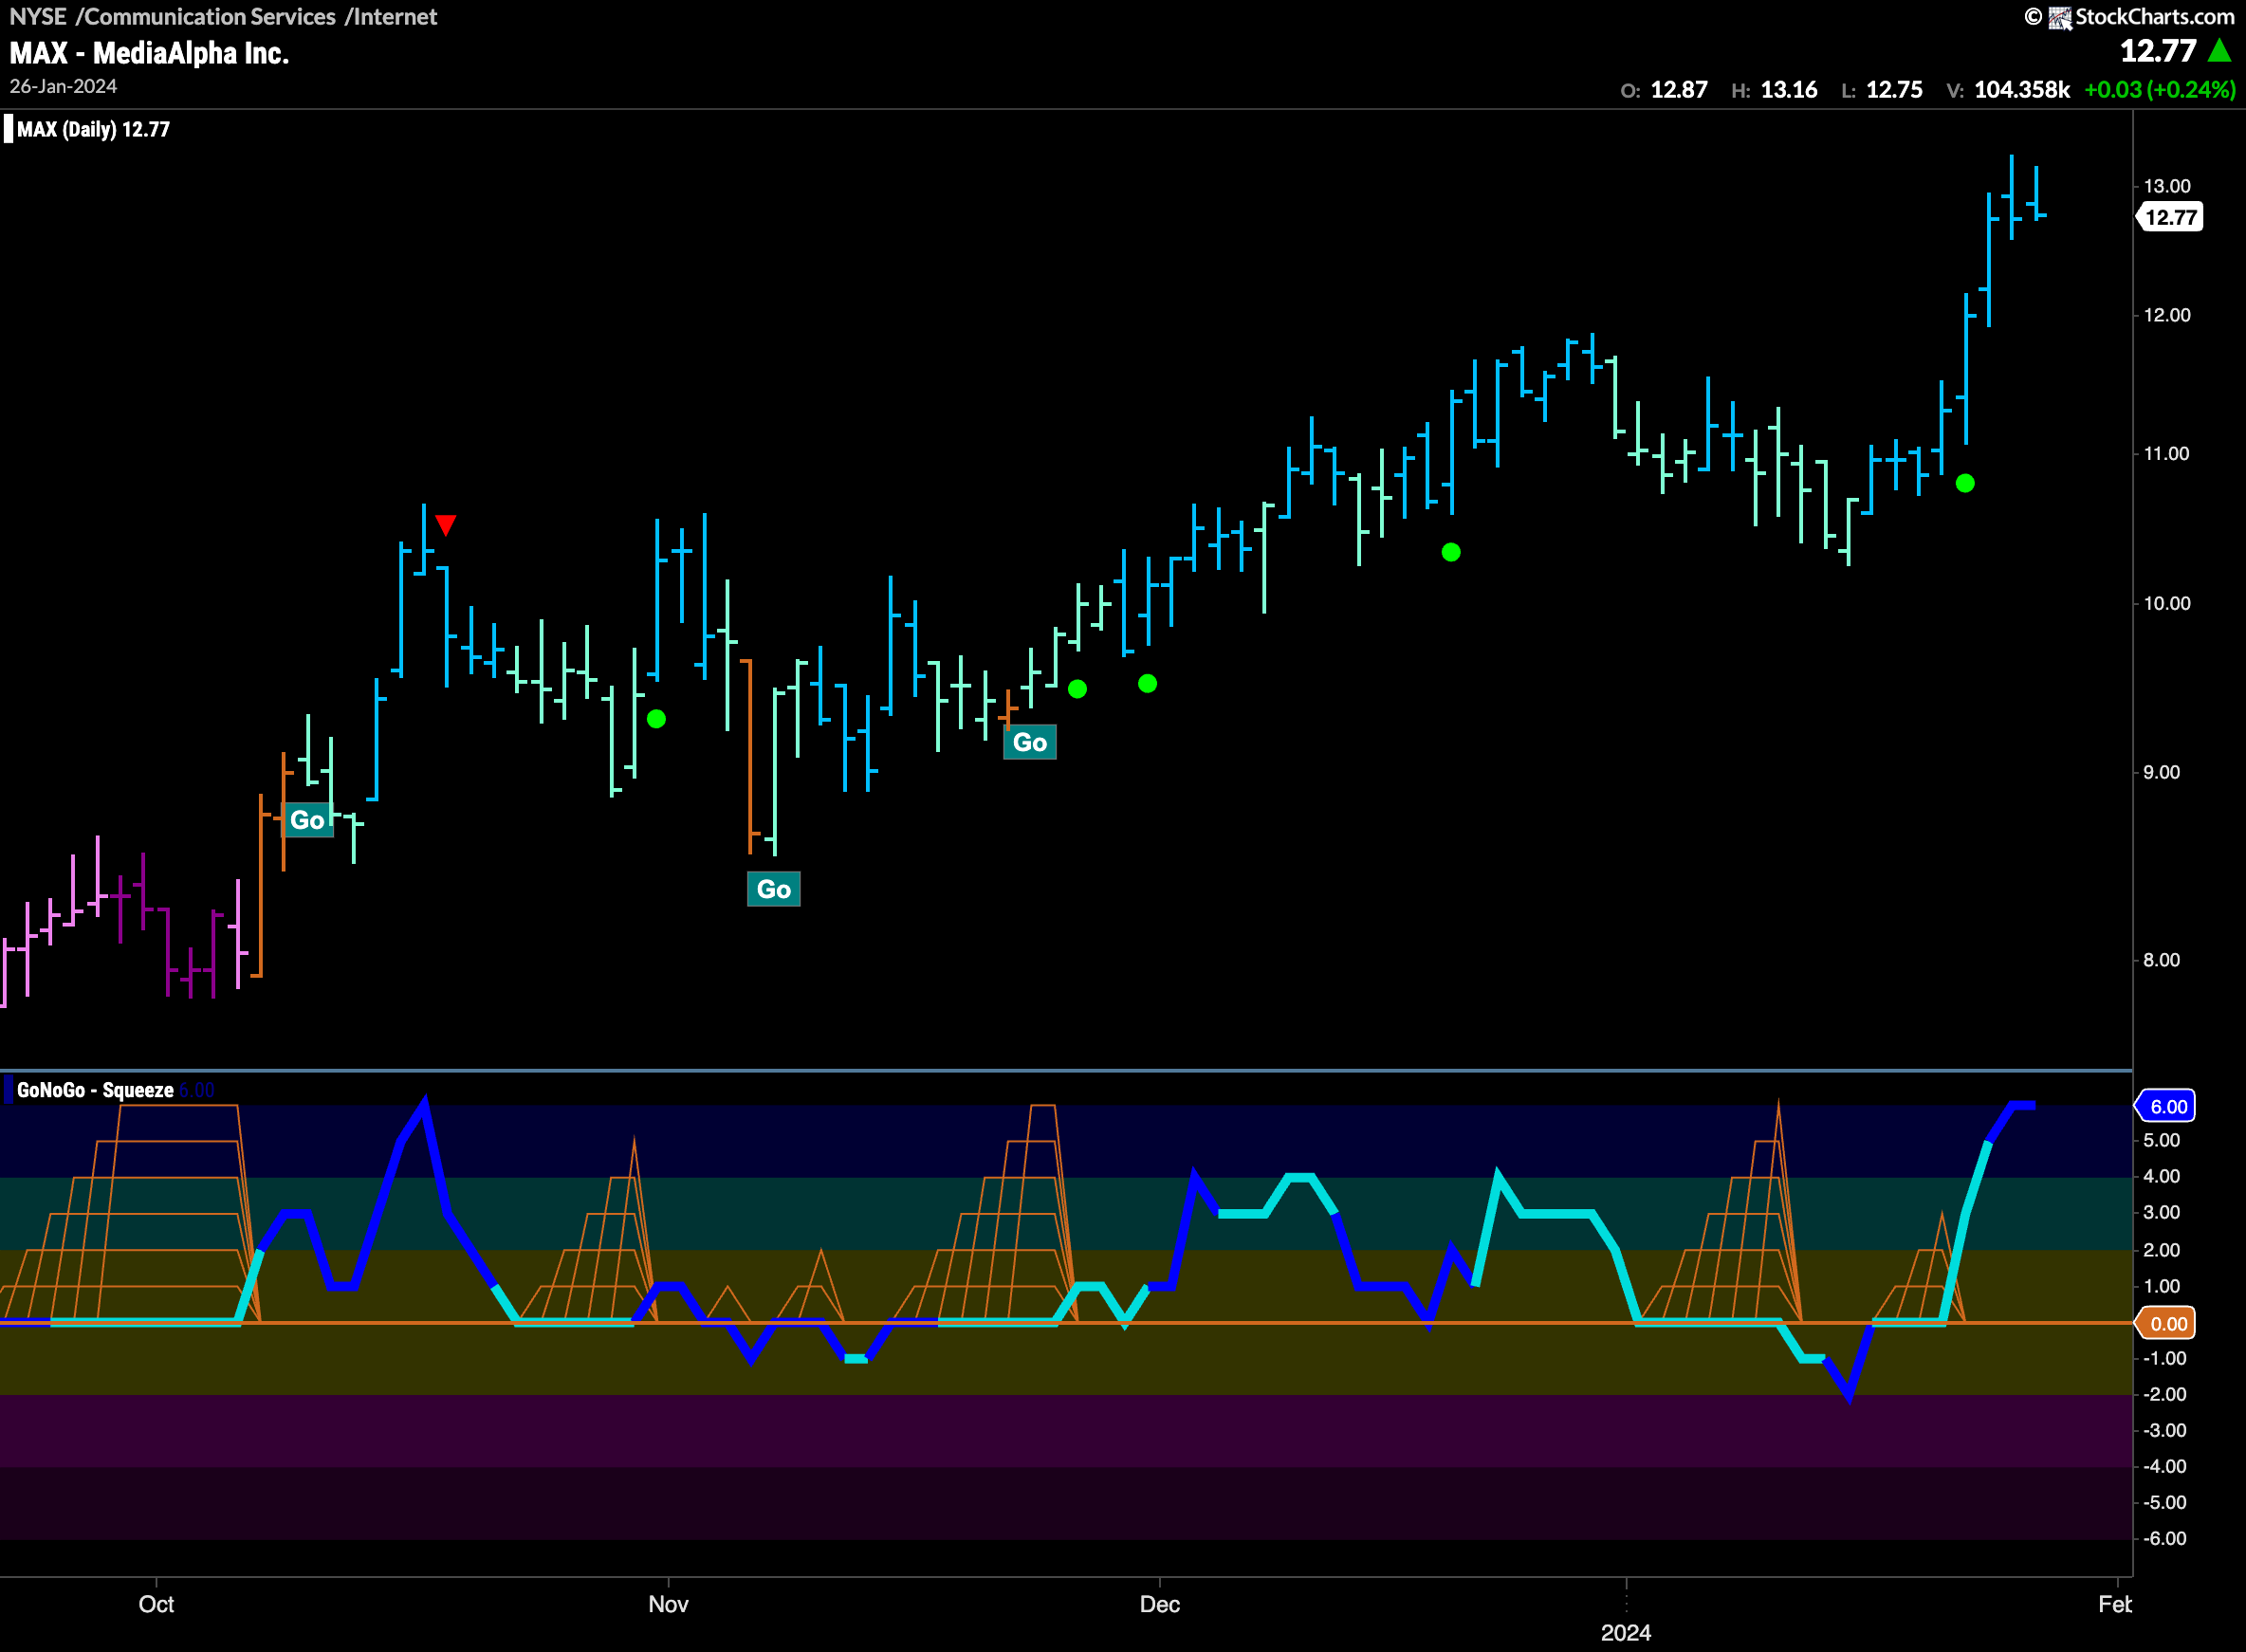
What a move this week for $MAX. In a “Go” trend now for several months, we saw GoNoGO Oscillator burst out of a small GoNoGo Squeeze into positive territory early last week and price jumped higher after the Go Trend Continuation Icon (green circle). Now, GoNoGo Oscillator is at an extreme overbought level of 6 and so we will wait to see if this level of enthusiasm can be sustained.
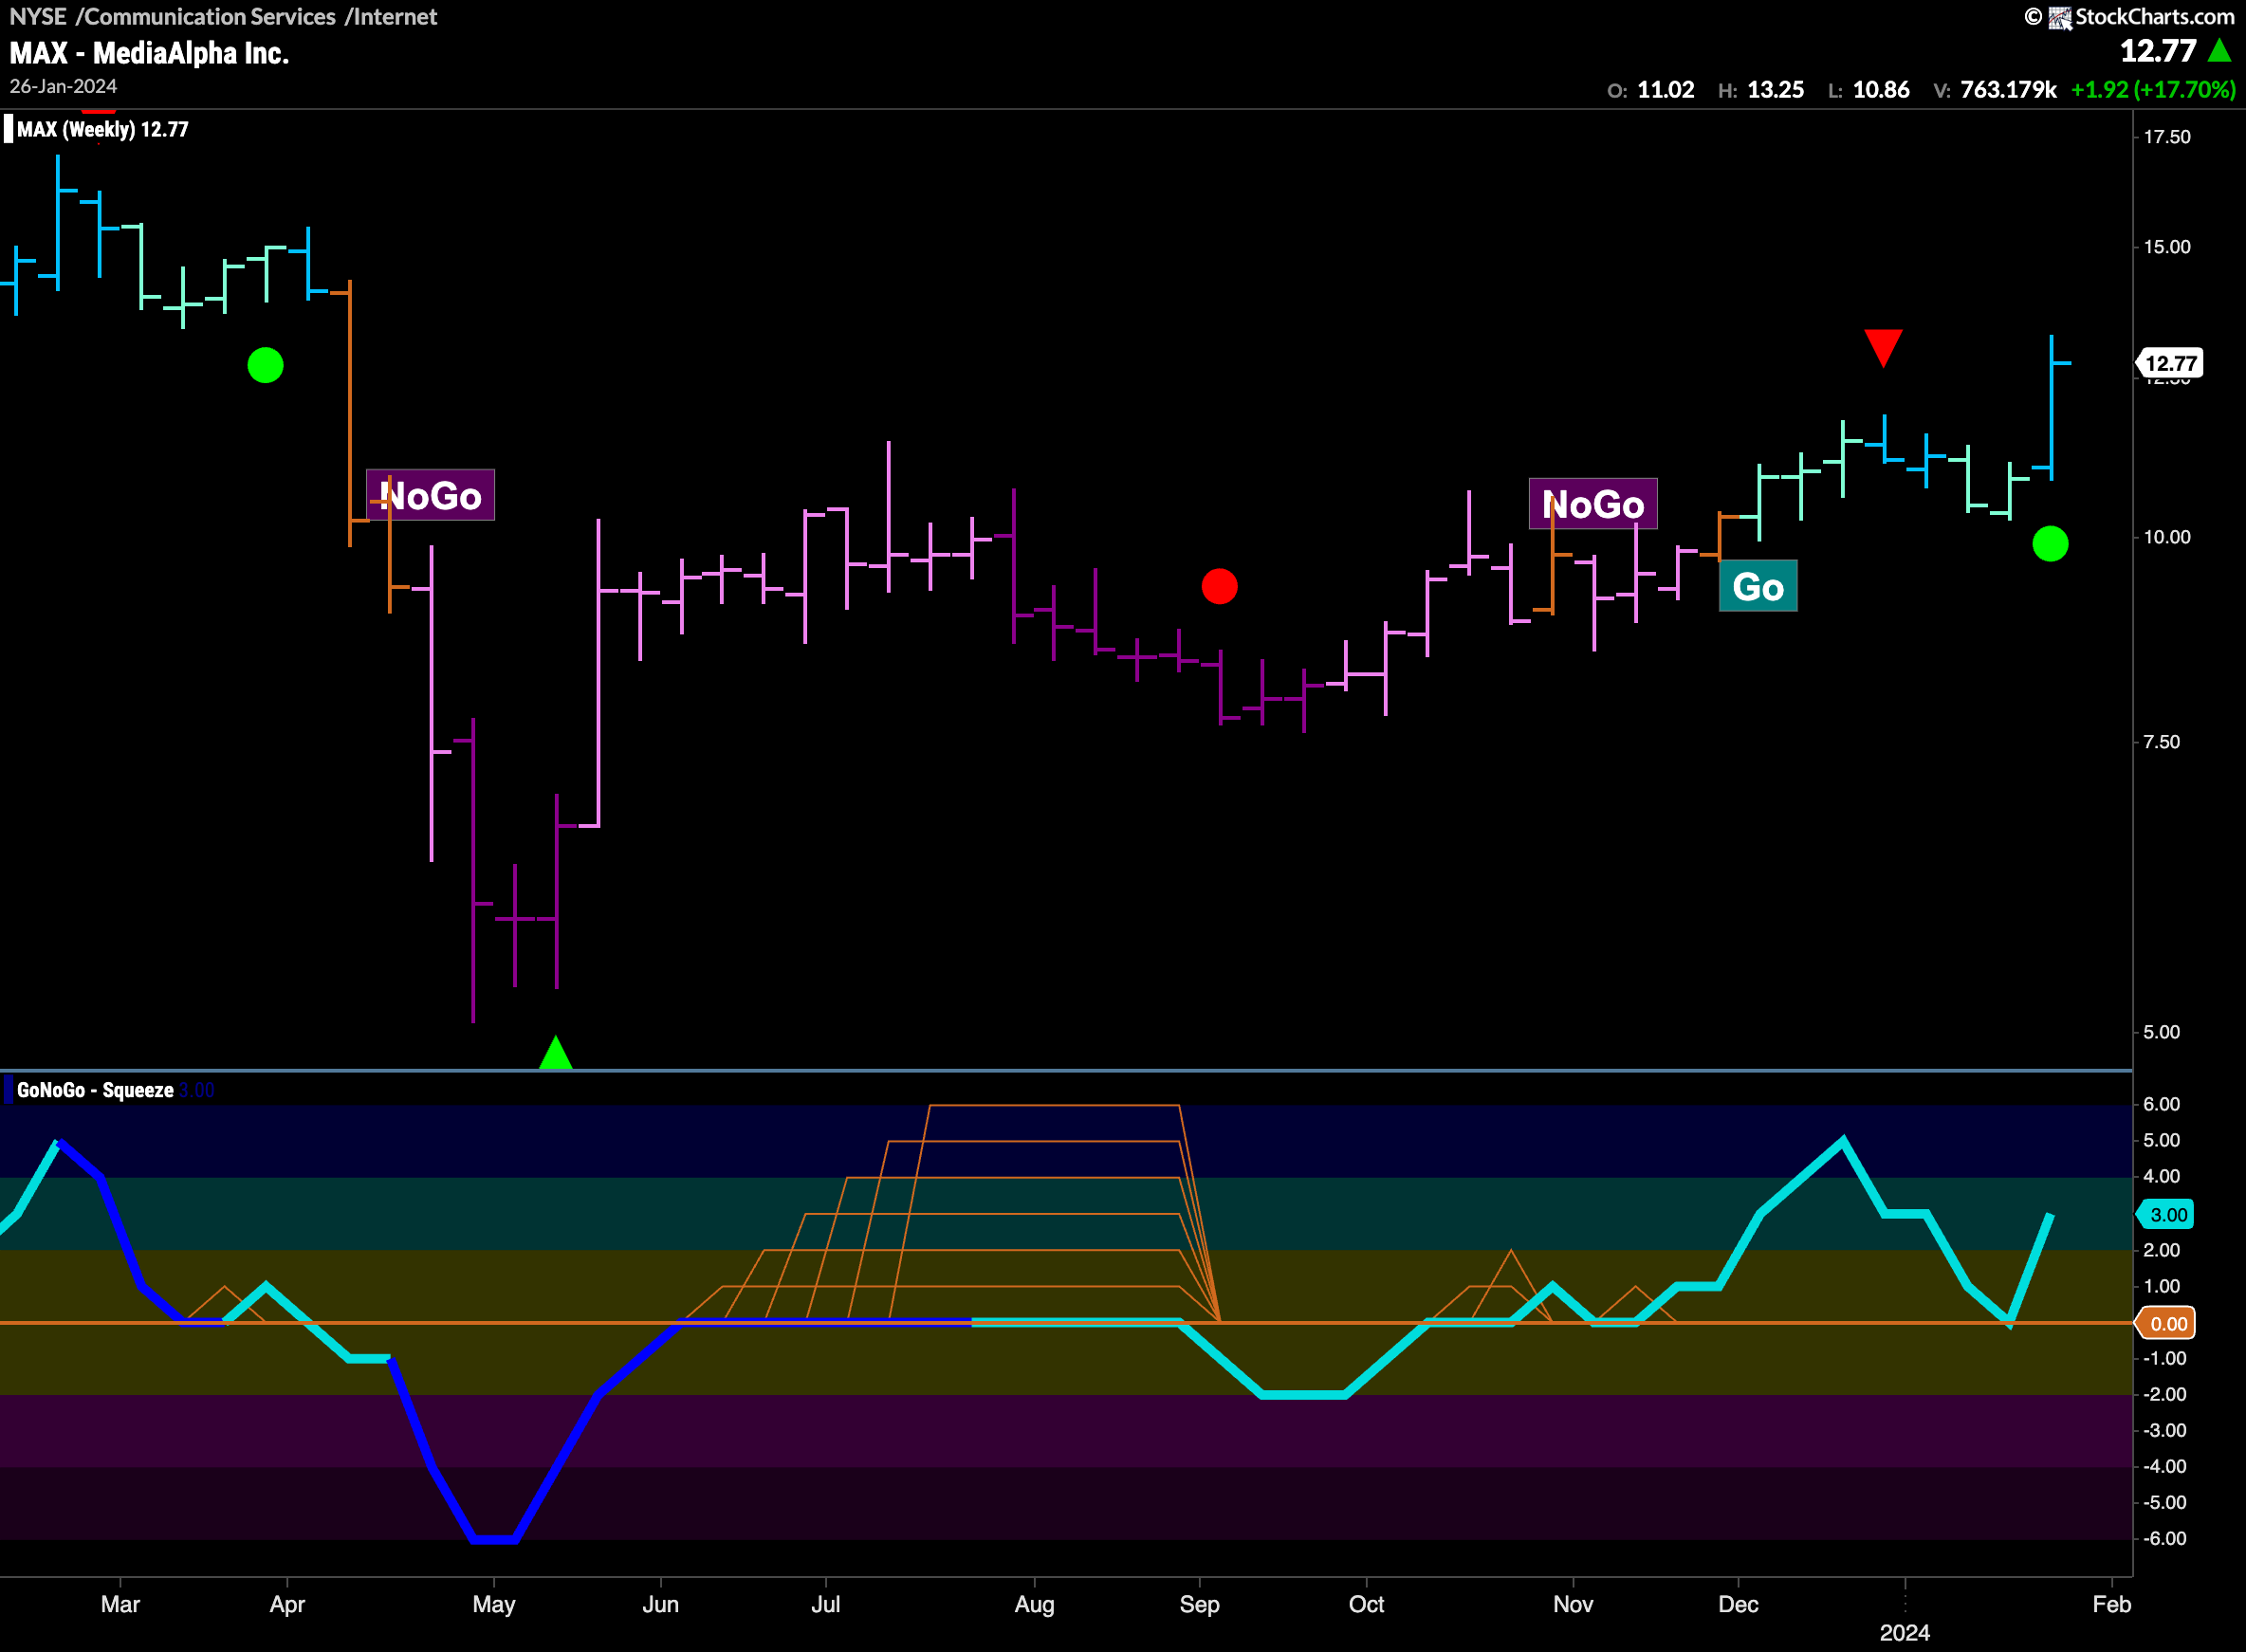
The weekly chart shows that we could just be getting started. Price has rallied from the lows from early last summer and as it made higher lows we saw GoNoGo Oscillator break above the zero line and start to find support at that level. Last week we saw GoNoGo Oscillator find support once again at the zero line and rally back into positive territory. This triggered a Go Trend Continuation Icon (green circle) which tells us that on this longer time frame momentum is resurgent in the direction of the underlying “Go” trend.
Going on a $TRIP
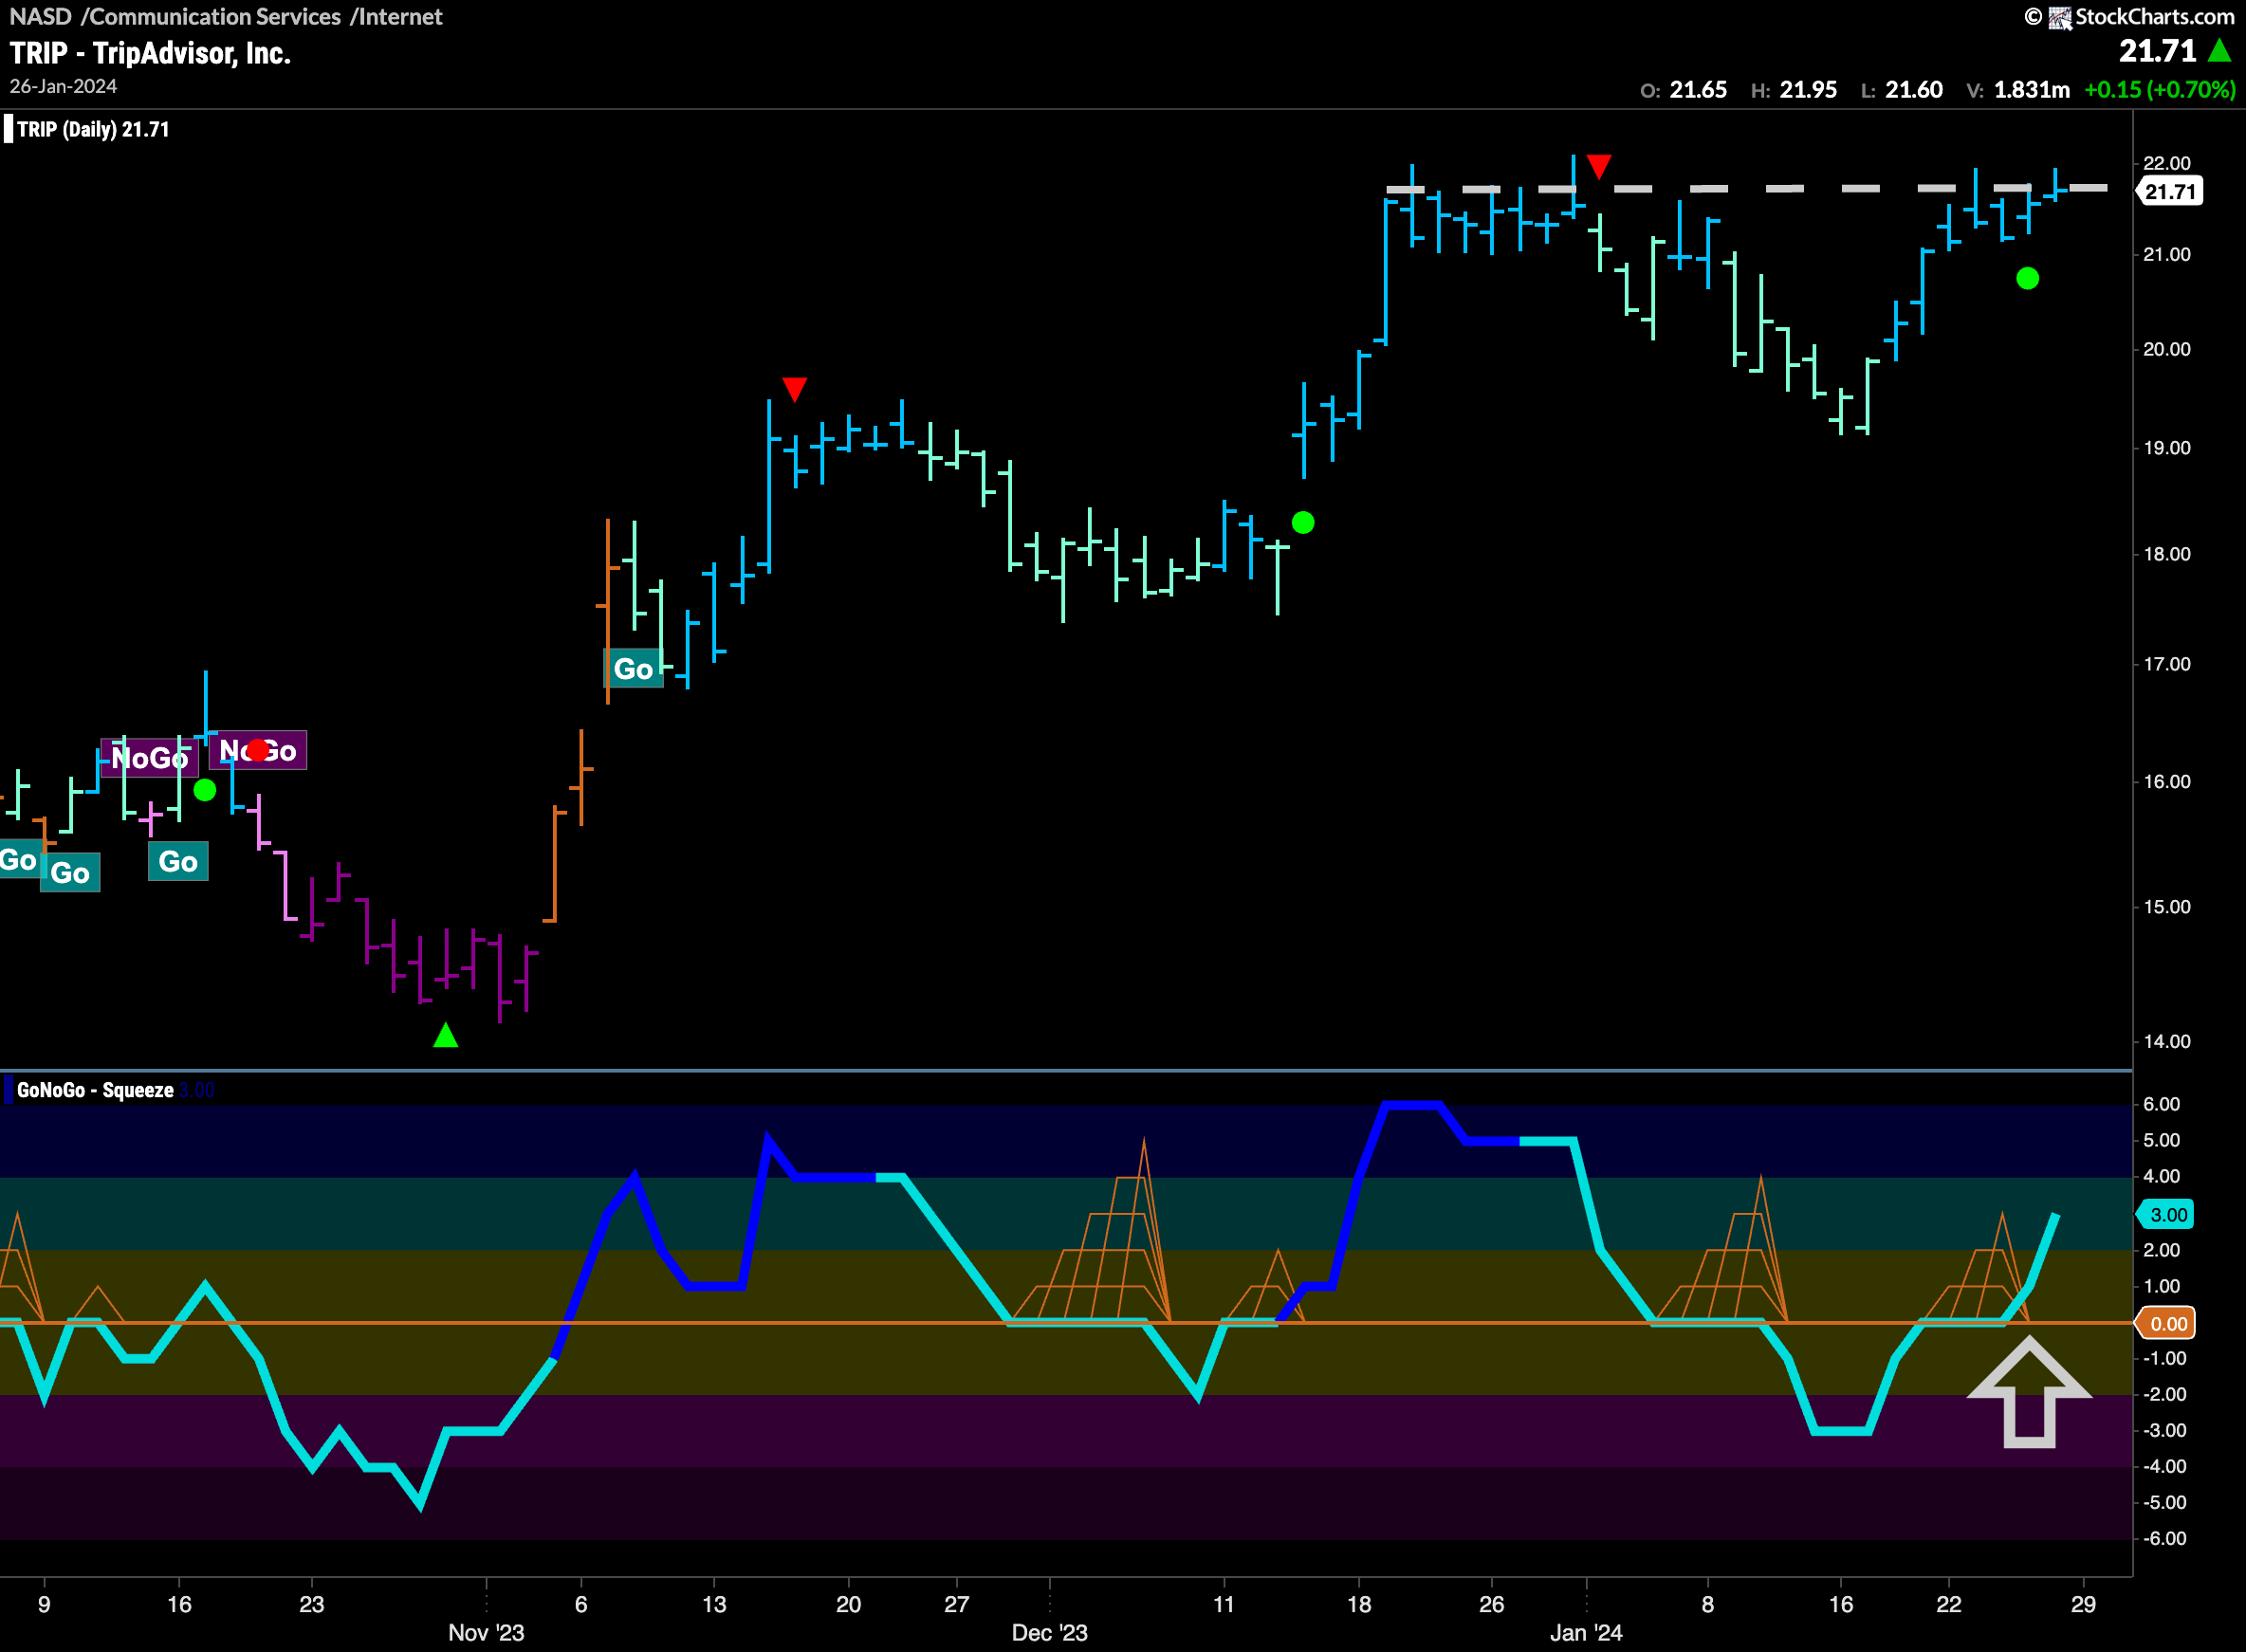
$TRIP had a good week as well as GoNoGo Trend painted a string of uninterrupted strong blue “Go” bars. We see that prices this week ran right up to levels that have been resistance on the chart. We will watch to see if price can break to new highs. Encouragingly, GoNoGo Oscillator reclaimed positive territory this week as it broke out of a small GoNoGo Squeeze. Perhaps this will give price the push it needs to set a new high.
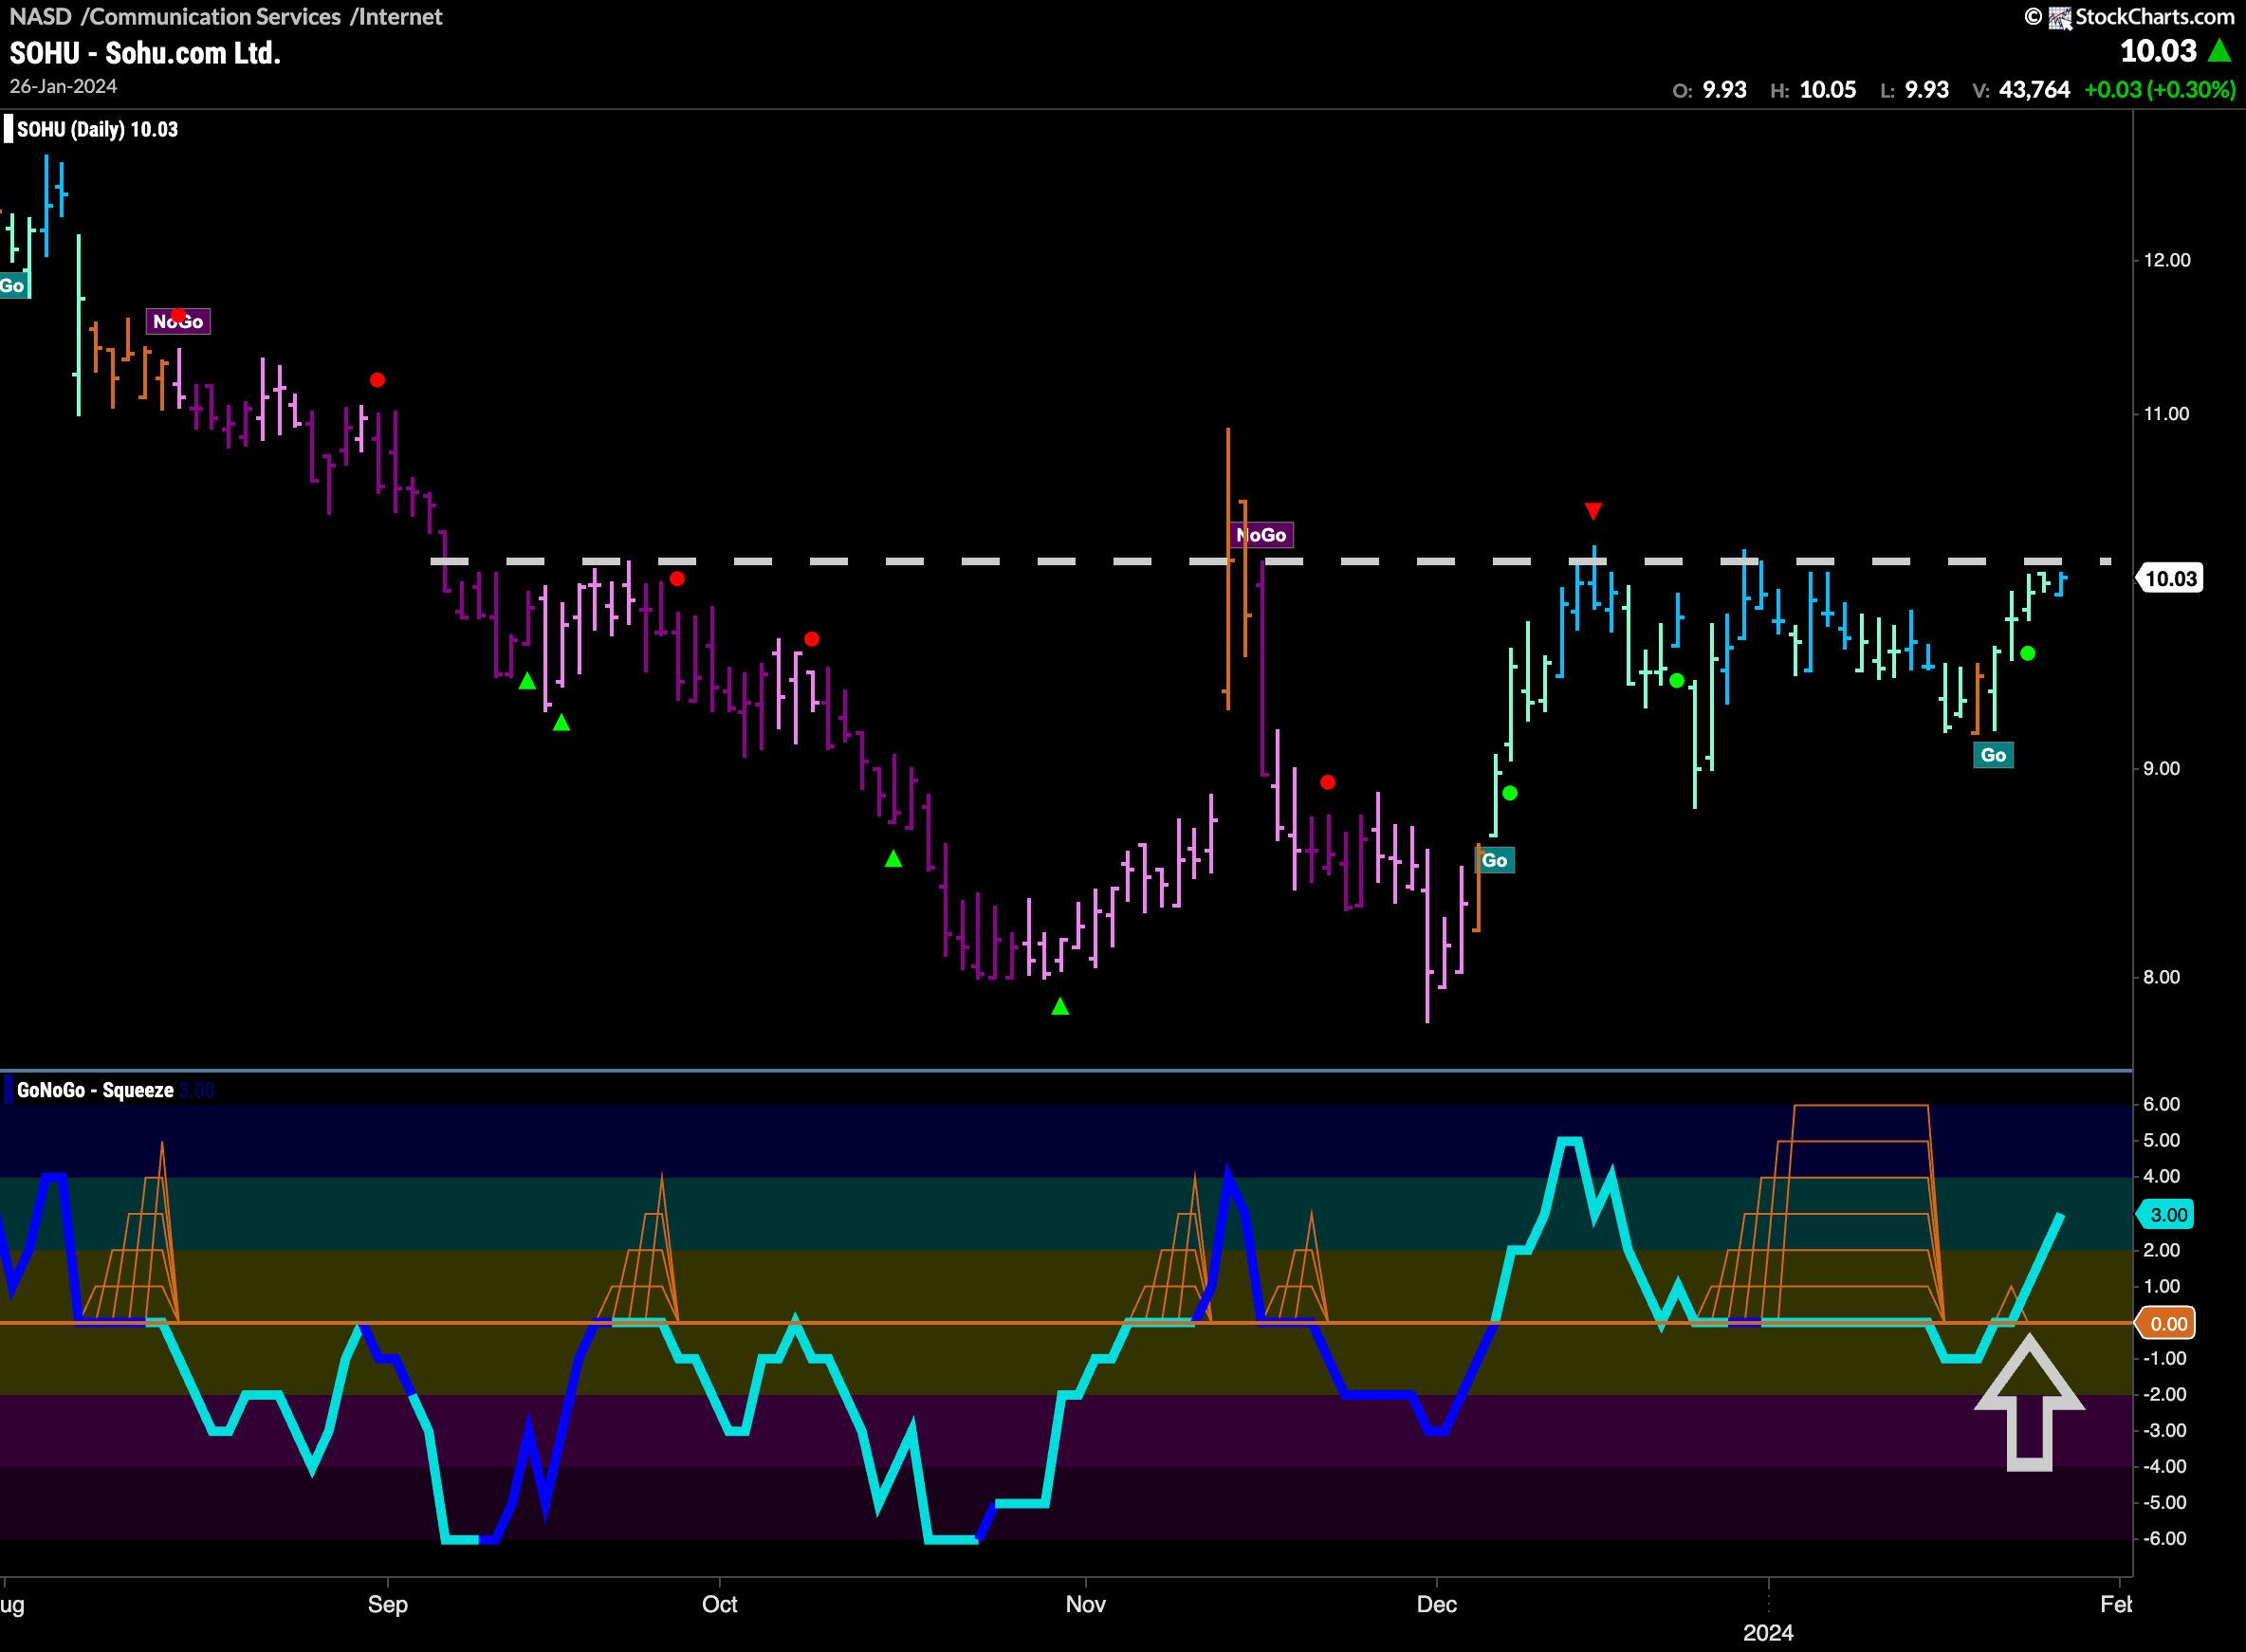
$SOHU Tests Resistance at Key Levels
$SOHU is interesting this week. Price is in a “Go” trend, and the last bar of the week saw GoNoGo Trend paint a stronger blue bar. However, the resistance is clear on the chart. Several times during this relatively young trend price has tried and failed to surpass this level. However, after a Max GoNoGo Squeeze, we can see that GoNoGo Oscillator is now in positive territory and rising. Perhaps this will give price the push it needs to reach new higher highs.
