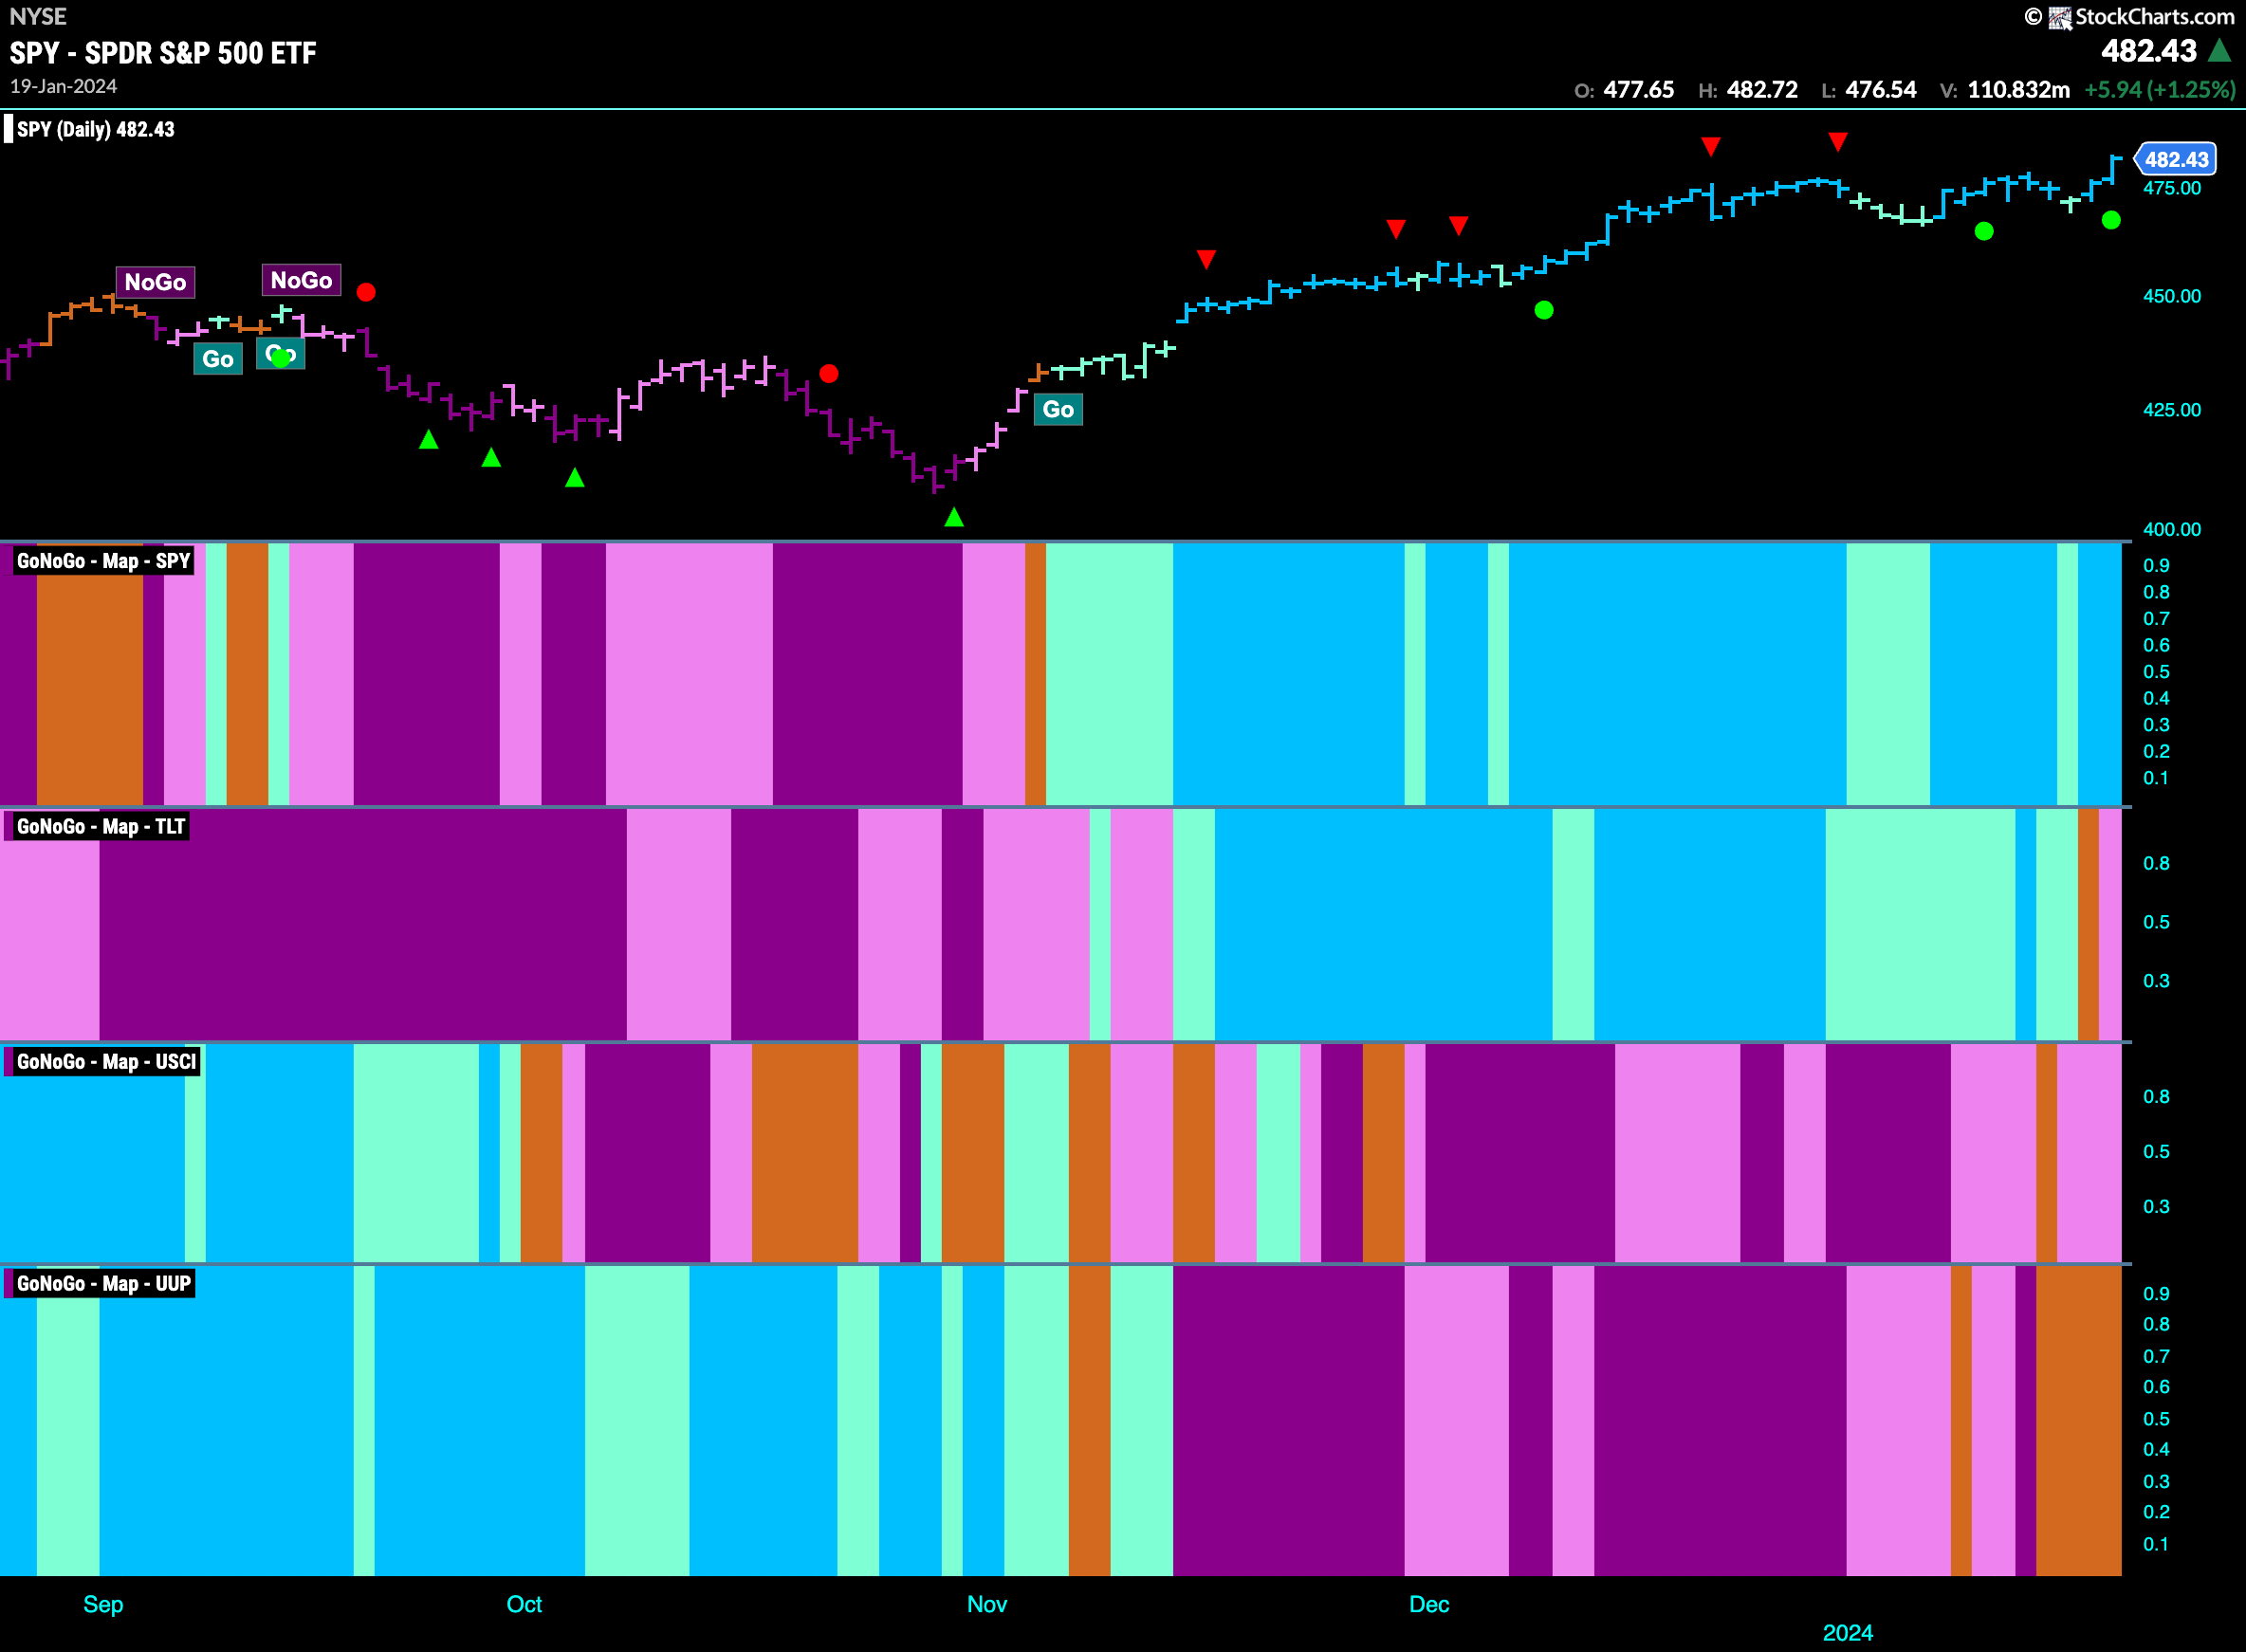
Good morning and welcome to this week’s Flight Path. Equities made new highs this week as we saw strong blue bars and Go Trend Continuation (green circle). Treasury bond prices were not able to hold on to their “Go” trend however and we saw a pink “NoGo” bars as the week came to a close. Commodities painted pink “NoGo” bars this week as the trend continued but showed weakness. GoNoGo Trend shows that the dollar is experiencing market uncertainty as it painted several amber “Go Fish” bars.
US Equities Burst Through to New Highs
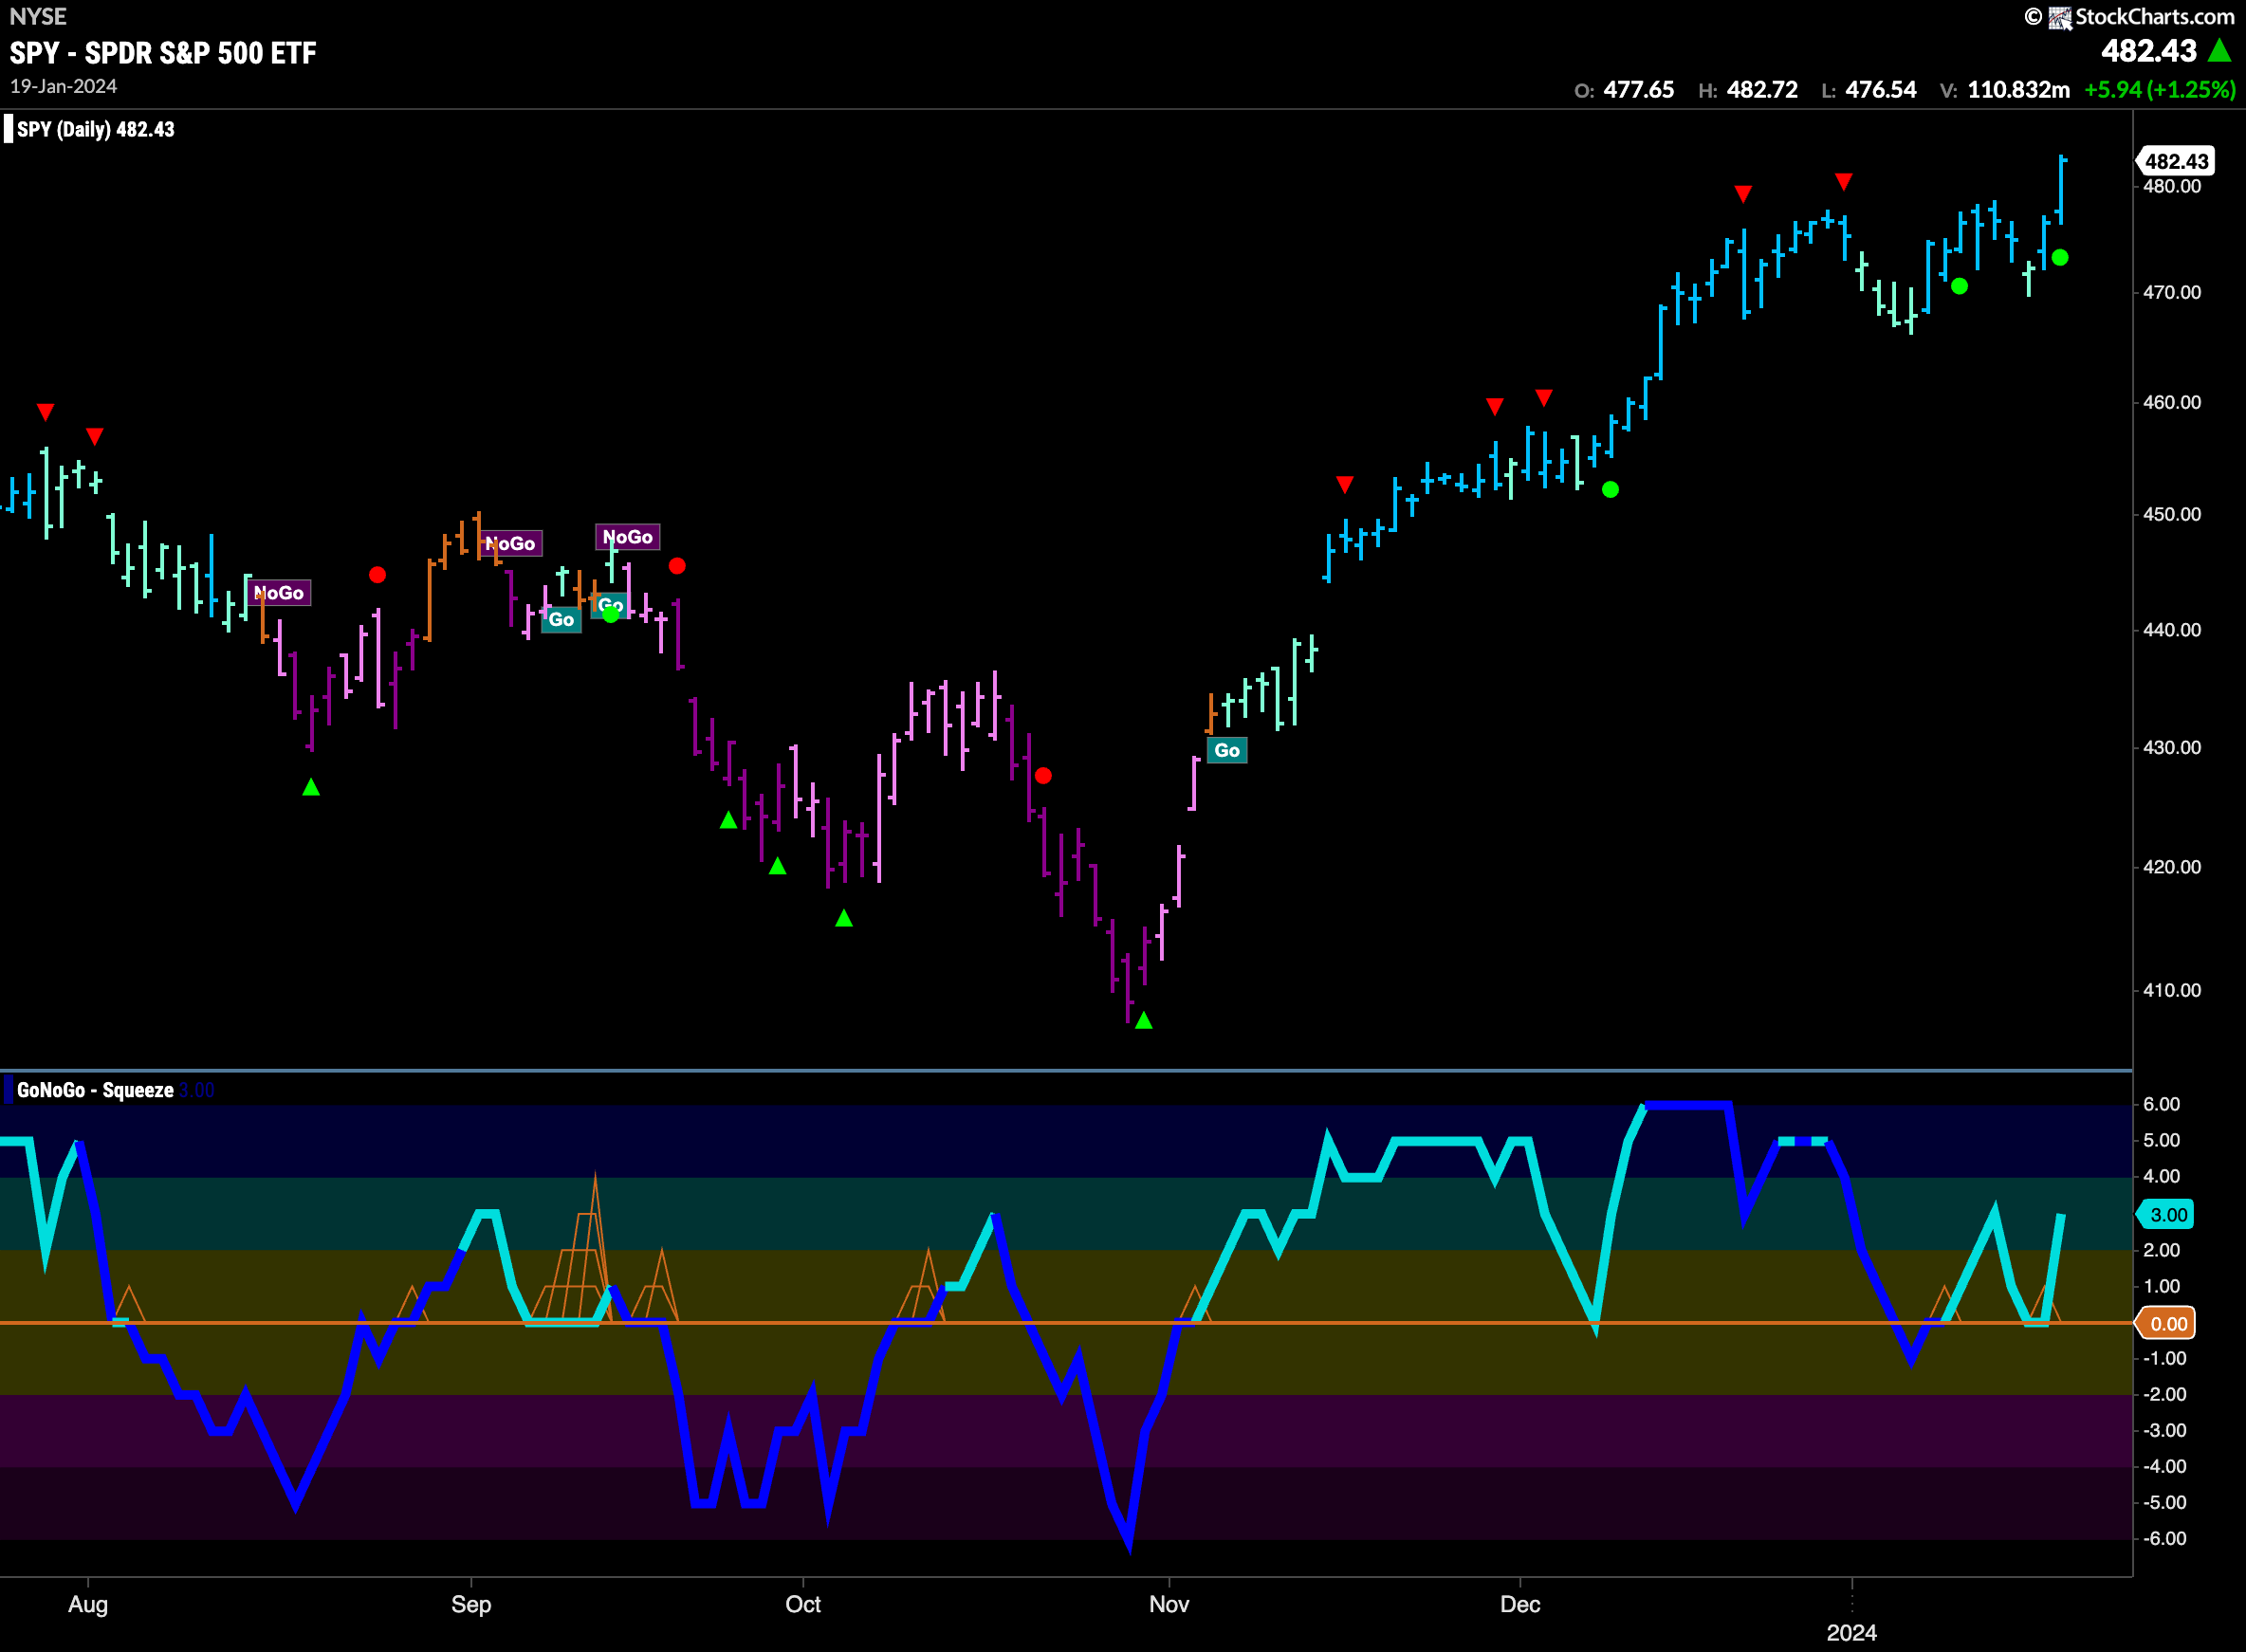
Positive price action this week as we saw $SPY hit another higher high on strong blue “Go” bars. GoNoGo Oscillator also was able to find support as it fell to test the zero line. Now we can say that momentum is resurgent in the direction of the underlying “Go” trend. With momentum in positive territory but not yet overbought there may be still some room to run for equity prices. Volume is light however, and so we can read that as lower market participation in this new high.
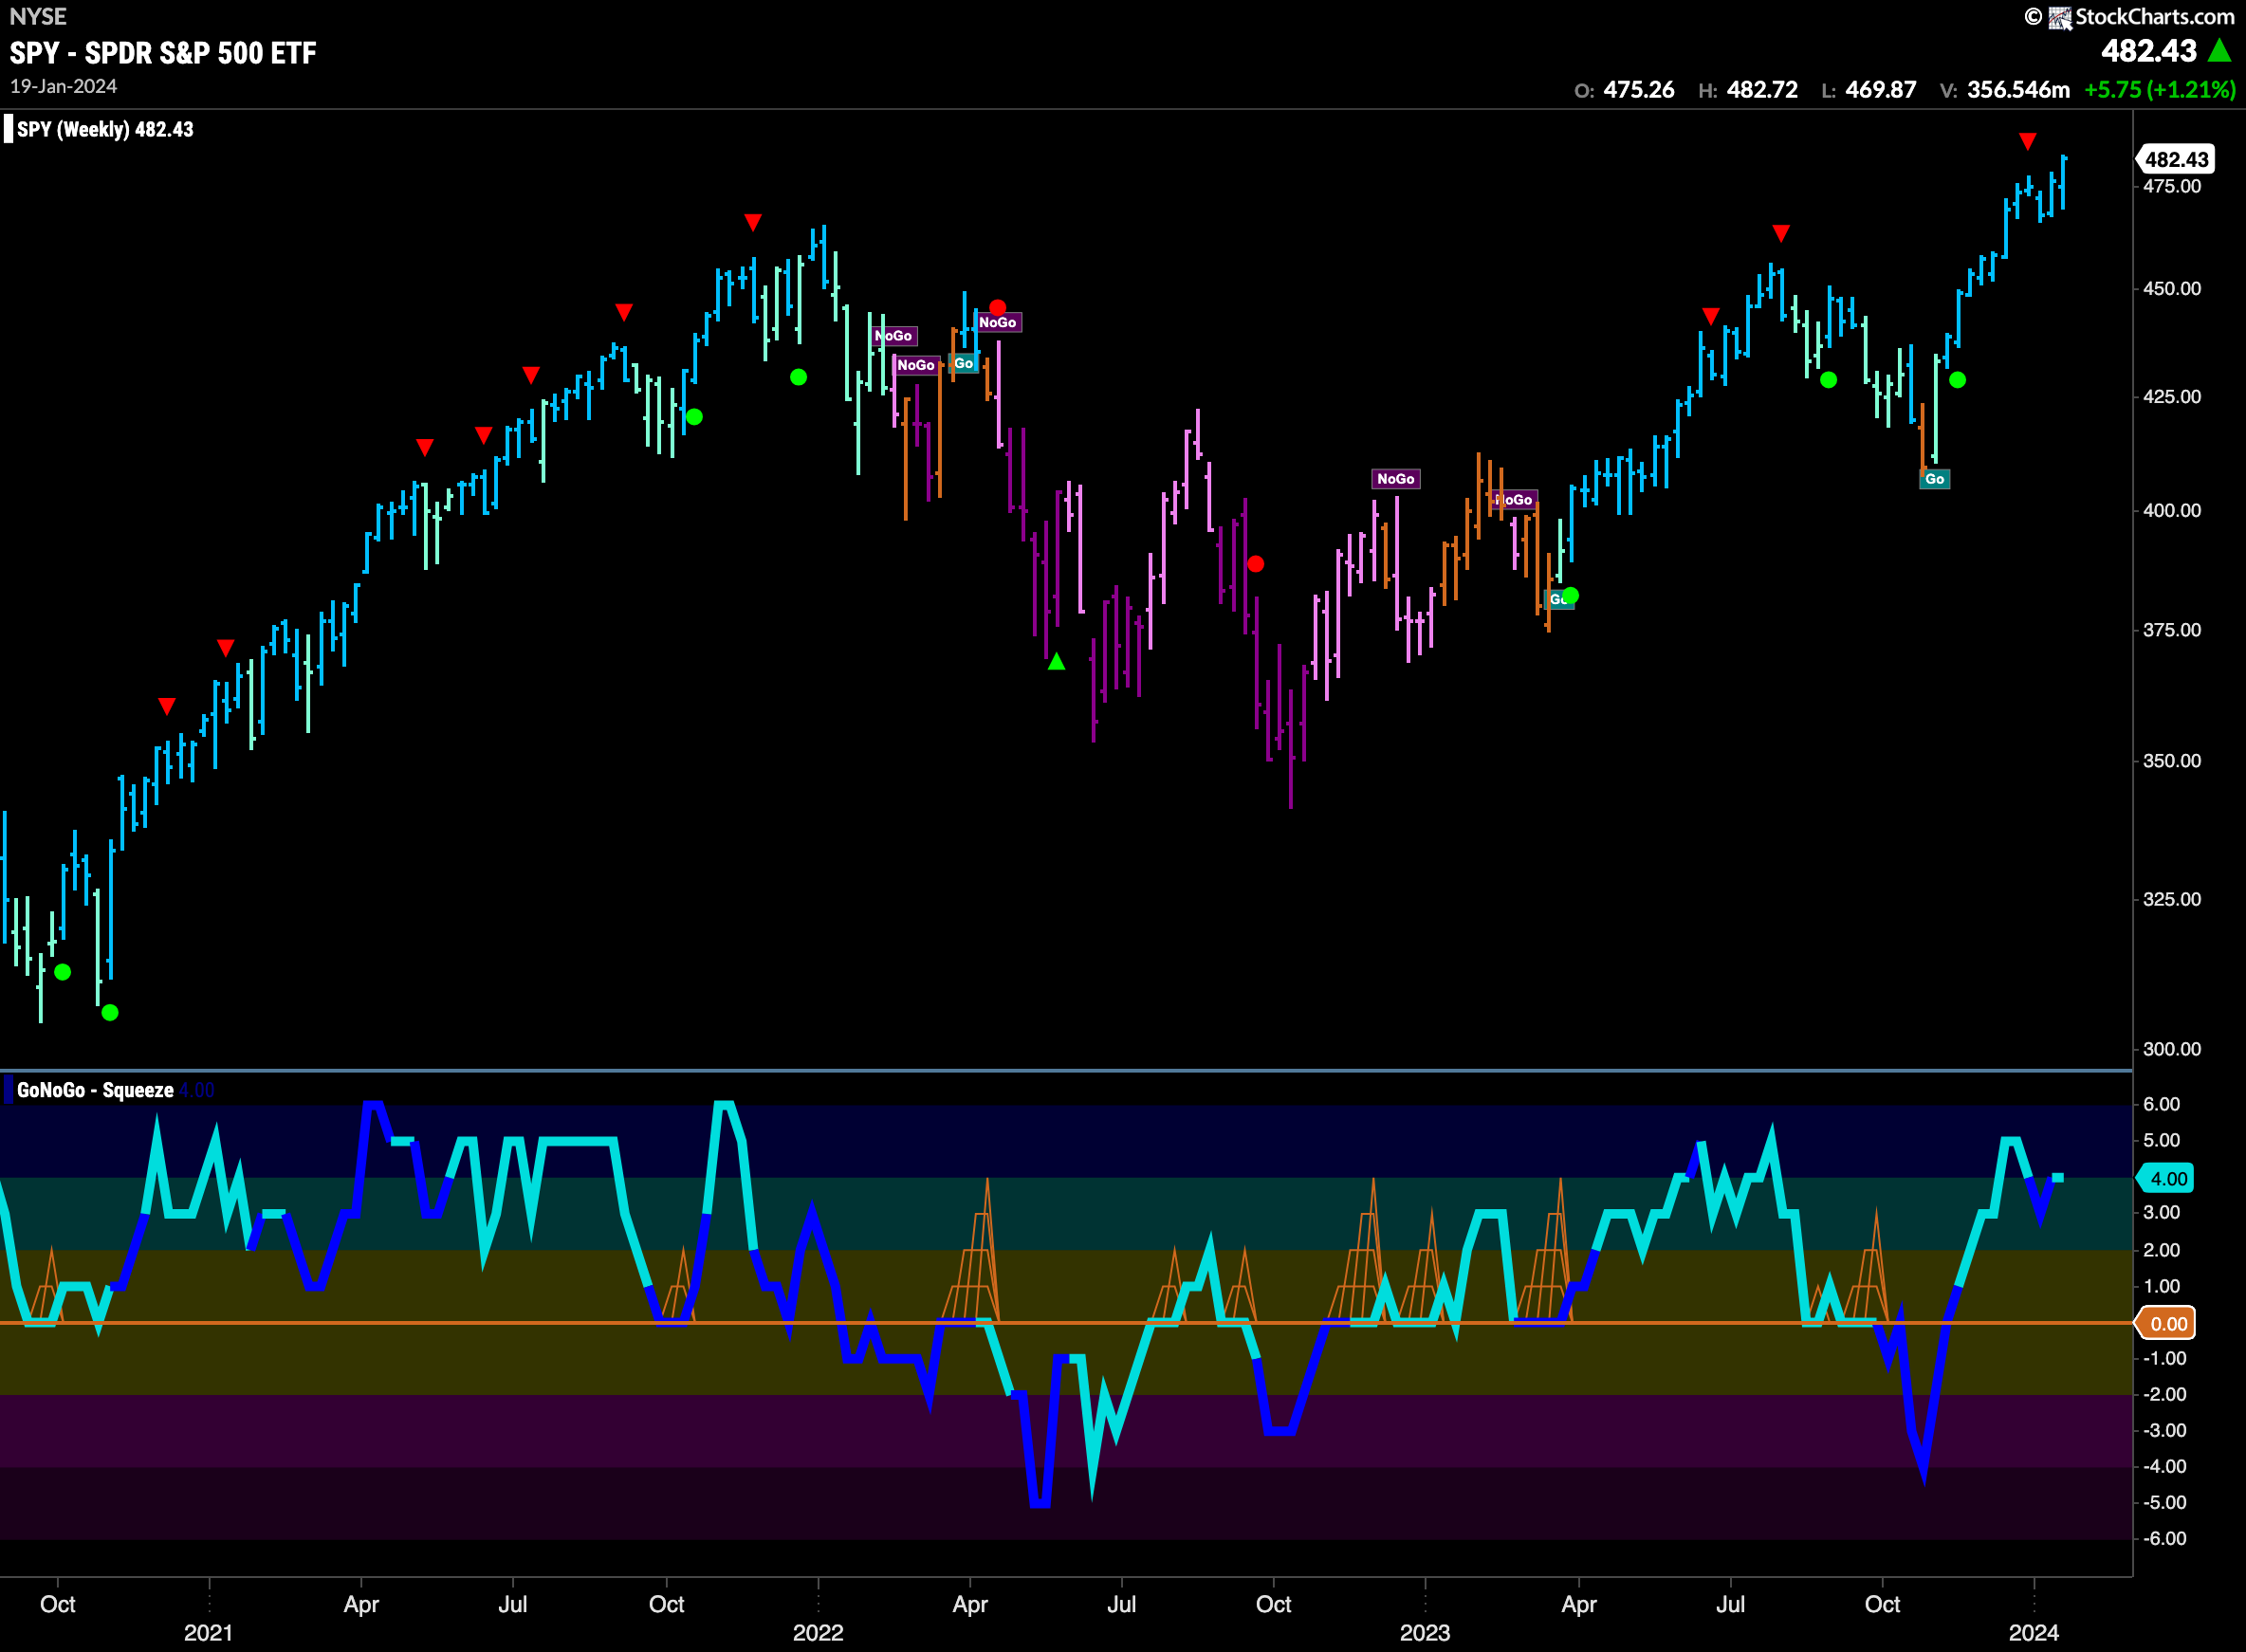
The weekly chart continues to show strength. A new weekly high has already made a mockery of the Go Countertrend Correction Icon that we see on the chart. GoNoGo Oscillator has come off overbought levels and is at a value of 4, well above the zero line. Strong “Go” trend and strong positive momentum suggest good things in the coming few weeks.
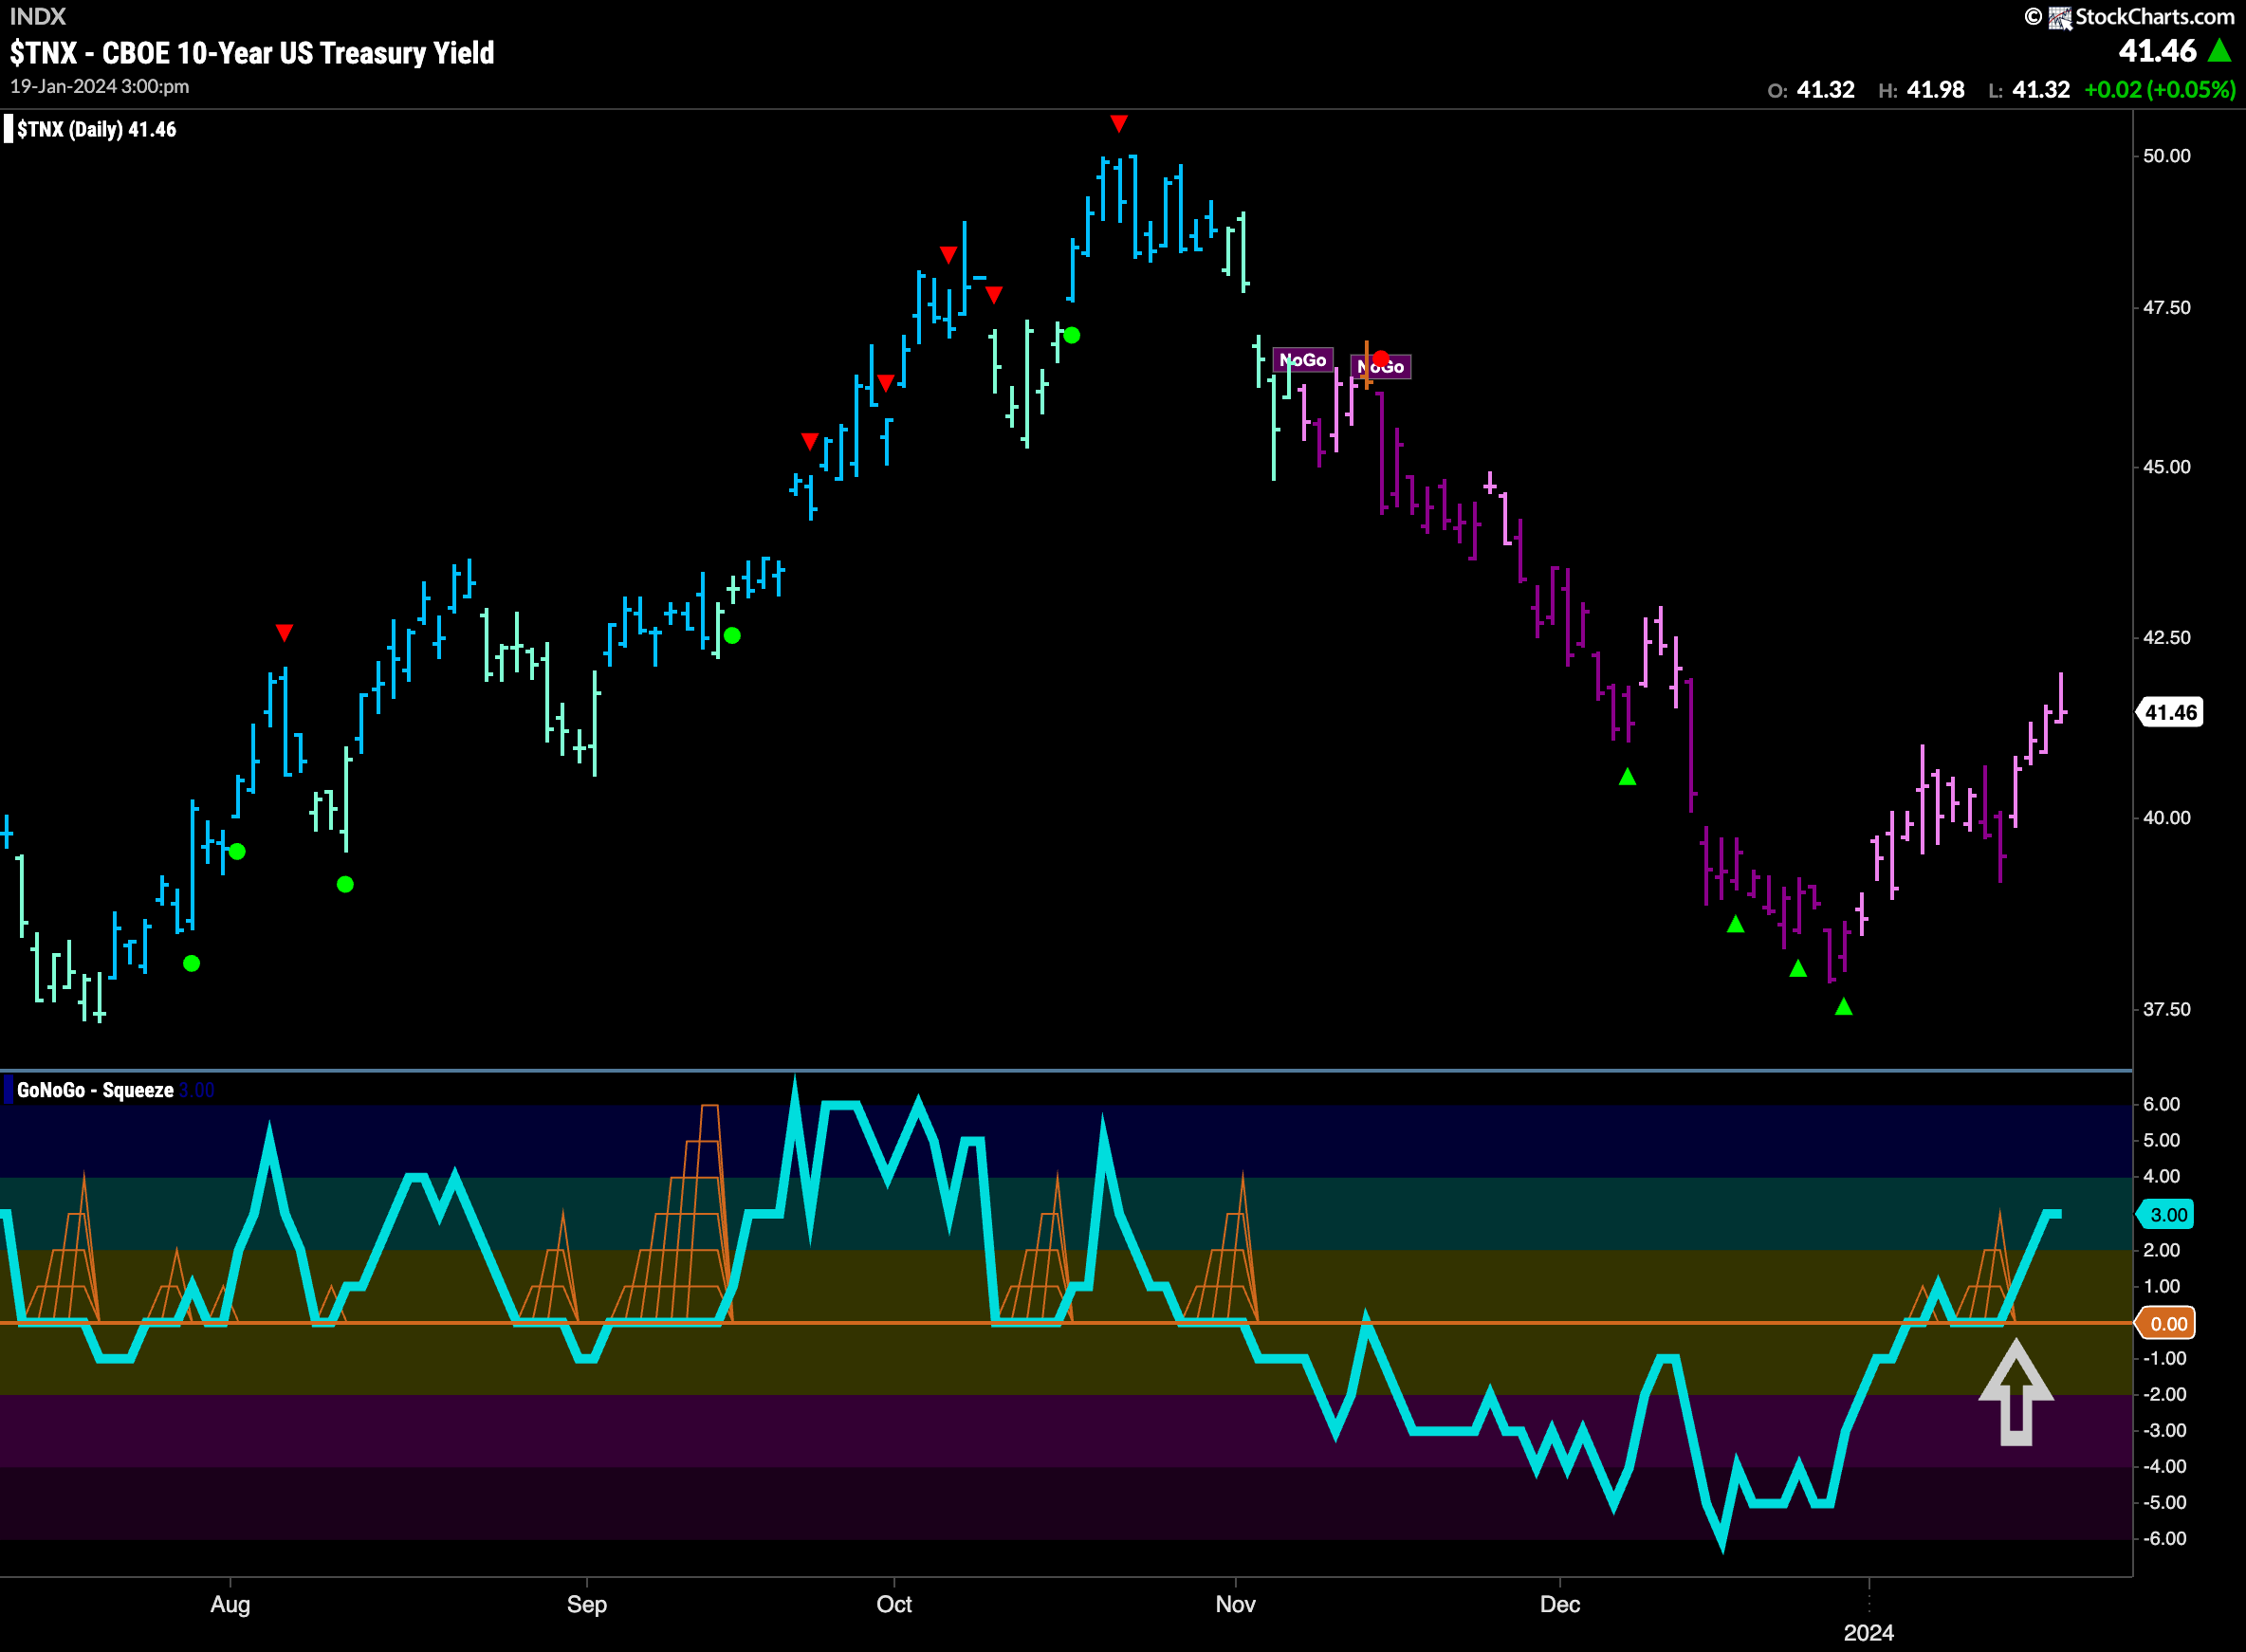
Momentum Reamins Positive for Treasury Rates
How long will this “NoGo” hang on? We see more weak pink “NoGo” bars this week as price put in a new higher low. GoNoGo Oscillator which last week had peeked above the zero line quickly found support at that level and has now moved into positive territory and is at a value of 3. This positive momentum is out of step with the “NoGo” trend. We will look for either a return to the zero line where the oscillator will retest its strength or for GoNoGo Trend to move out of “NoGo” colors in the price panel above.
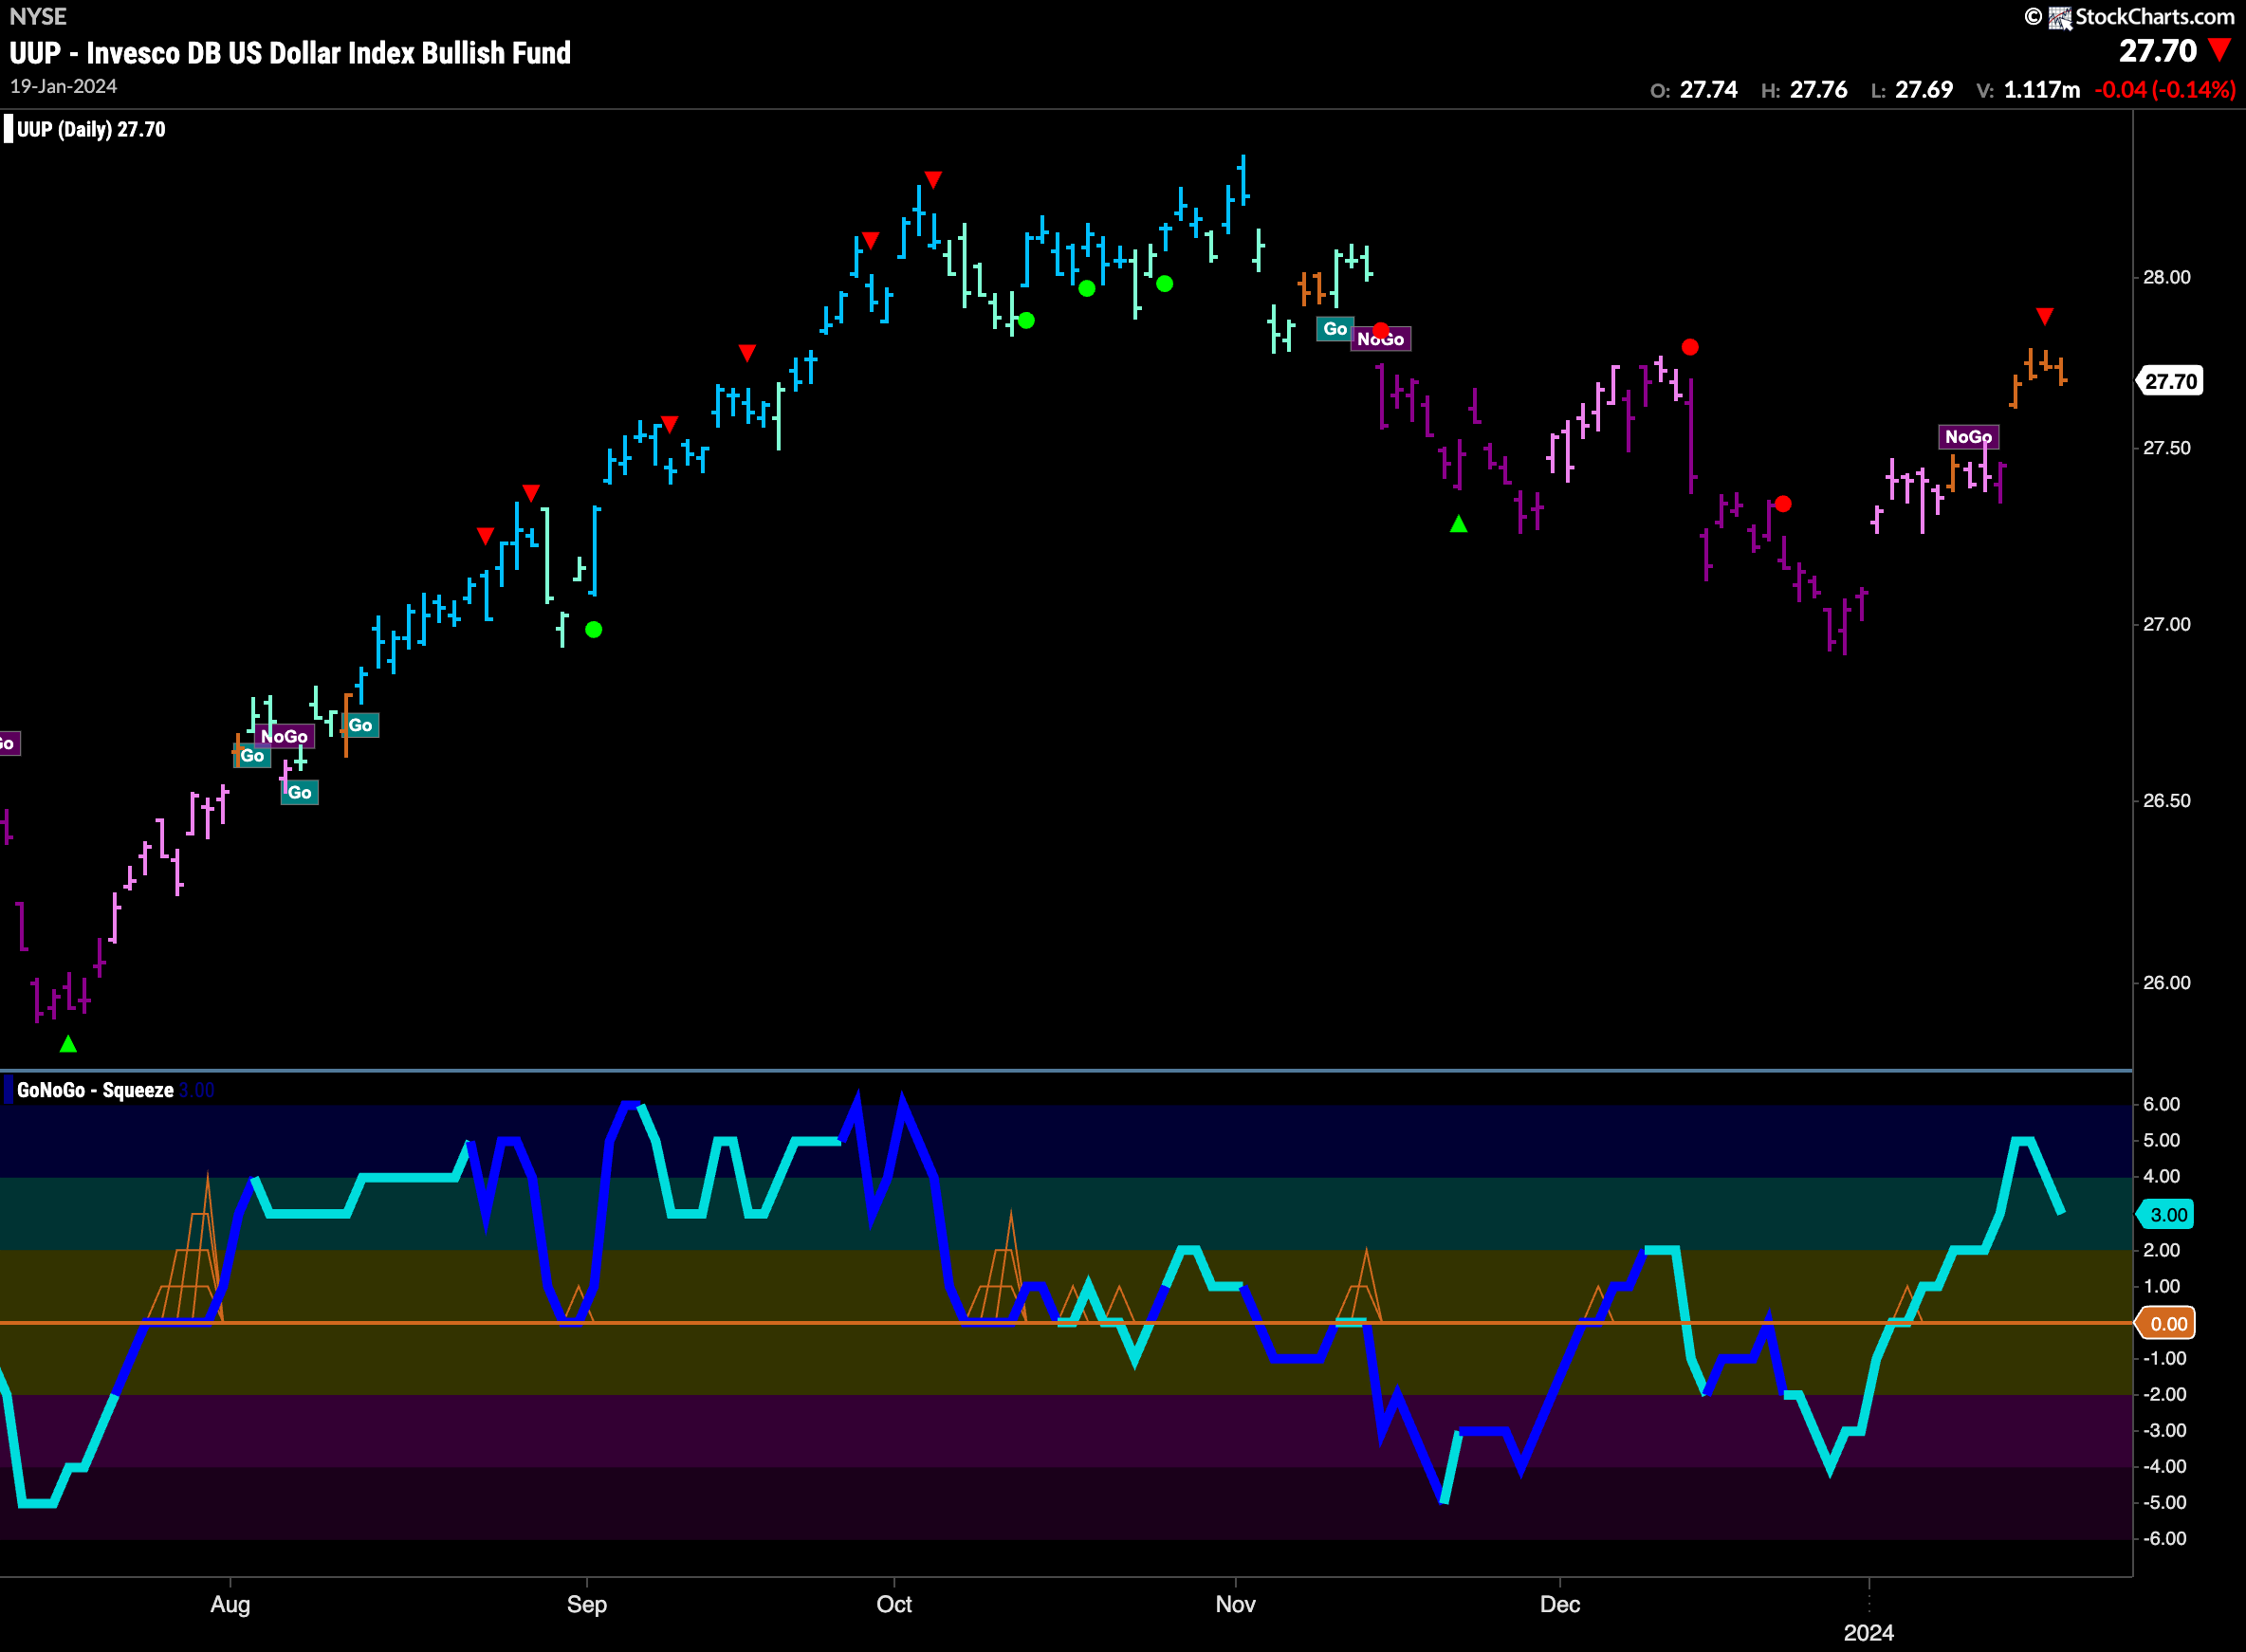
Uncertainty Abounds in the Dollar
Looking at the daily chart below we see that GoNoGo Trend is no longer painting “NoGo” bars. with almost an entire week of amber “Go Fish” bars we can say that the market is undecided regarding the direction of the greenback. Momentum has been positive for a few weeks and still is at a value of 3. We will watch closely this week, there is some resistance on the chart from a prior high and if GoNoGo Trend doesn’t make the switch to “Go” bars we may see price fall from this recent Go Countertrend Correction Icon.
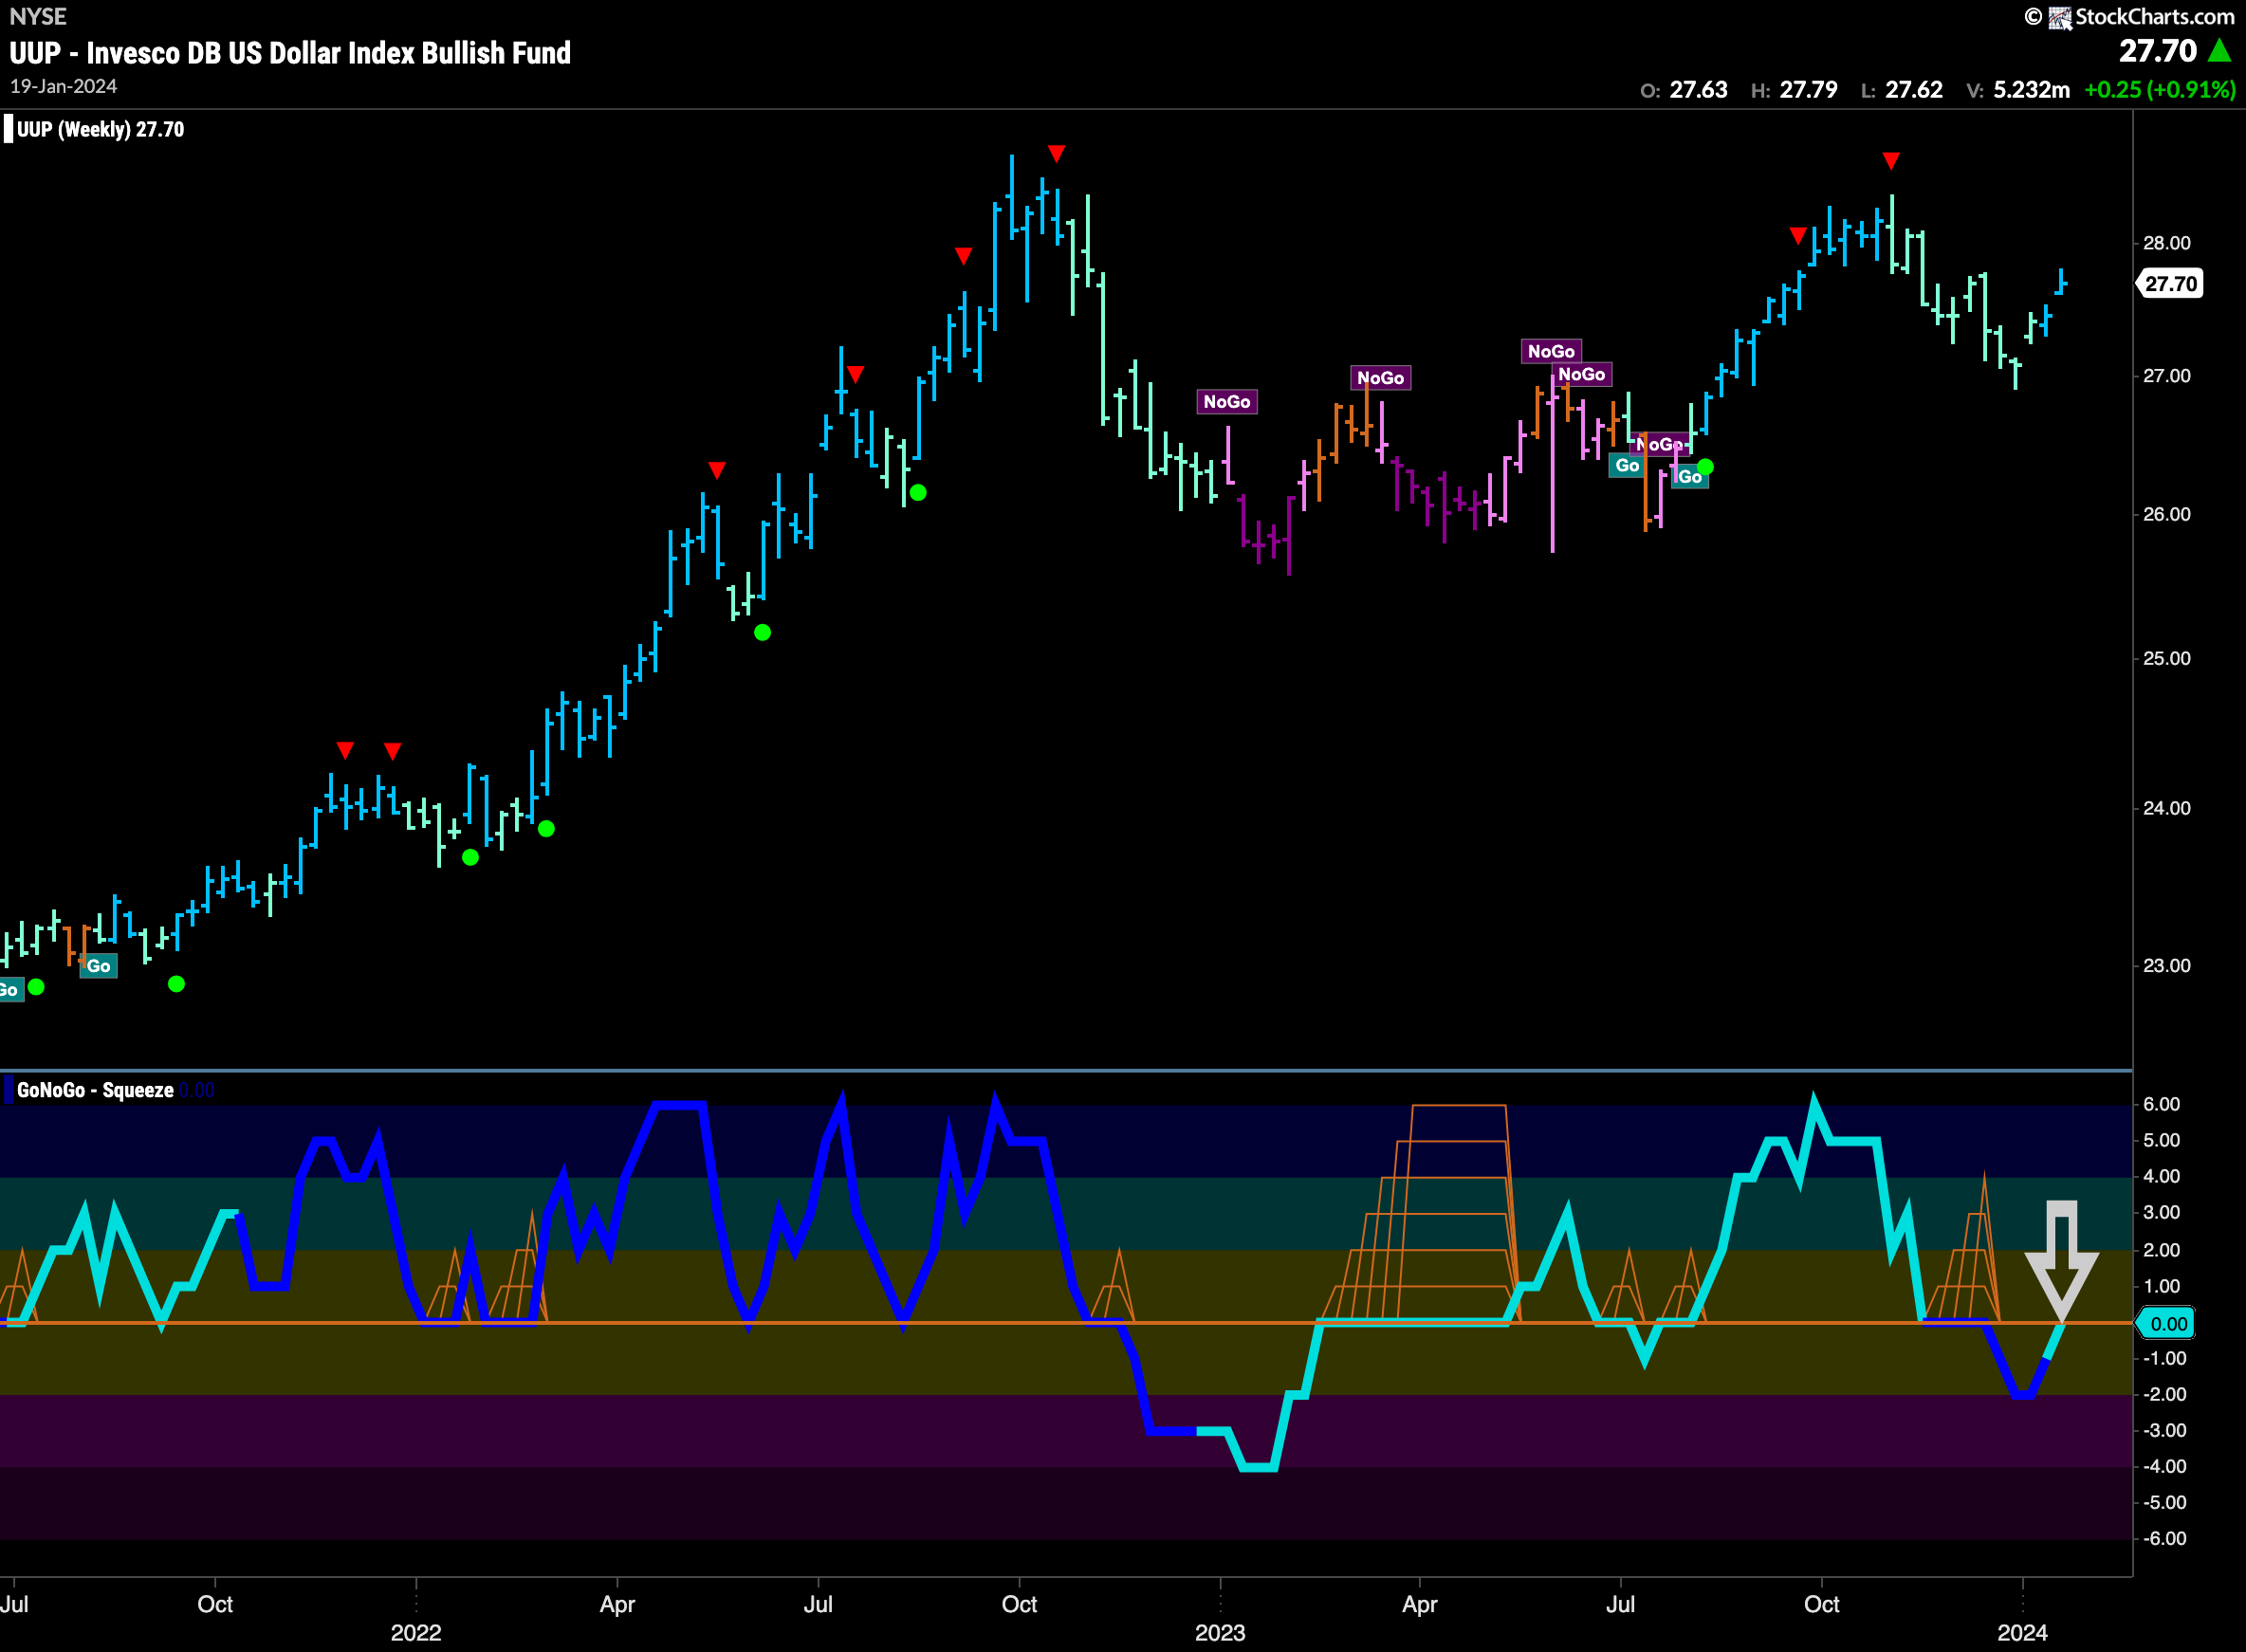
The weekly chart below shows that we are at an important inflection point. The “Go” trend remains in place as price rallied since the last low. However, we see that GoNoGo Oscillator after breaking below the zero line out of a small GoNoGo Squeeze, is back to test that level from below. We will watch to see if it is rejected here. If so, that will put pressure on price and we may see a lower high.
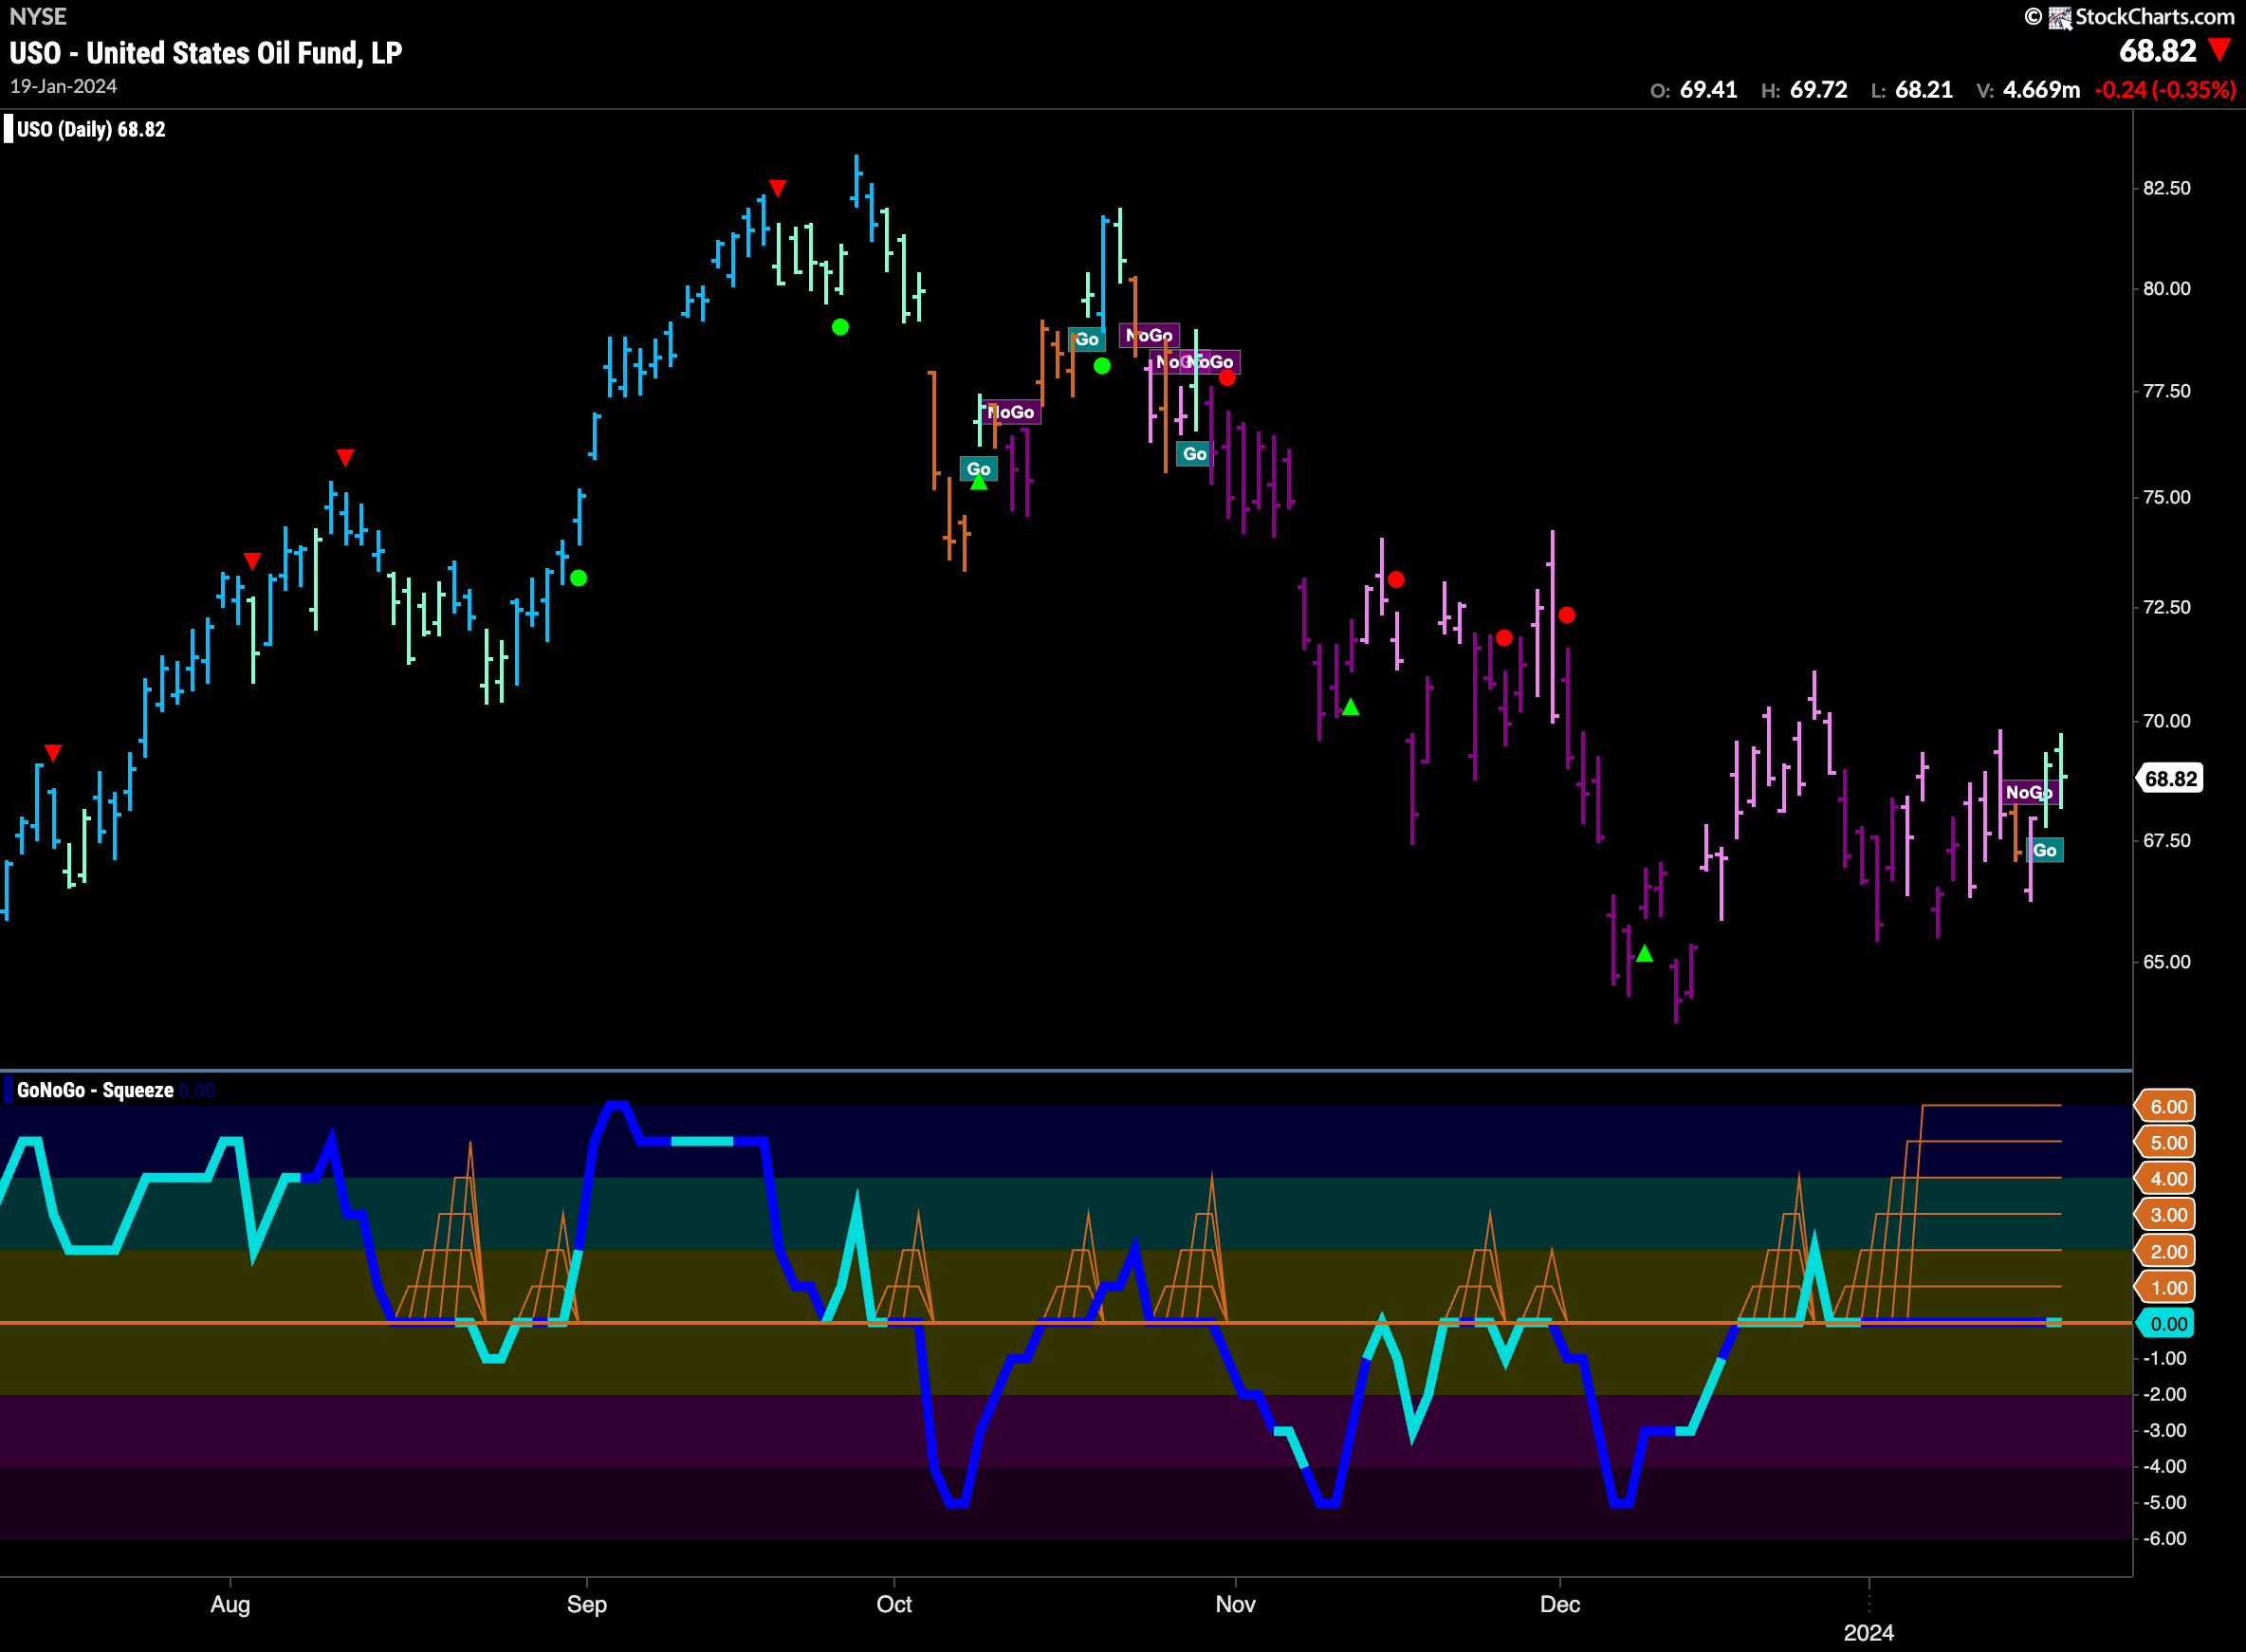
Oil Enters Fresh “Go” Trend
GoNoGo Trend shows a new “Go” trend even as GoNoGo Oscillator remains stuck in a Max GoNoGo Squeeze. Price has stabilized since the low at the end of the last year and we see some buying at slightly higher lows. As price coils in what looks like perhaps a symmetrical triangle GoNoGo Trend has identified a new “Go” trend with a couple of aqua bars. We will watch to see if the oscillator can break out of the Max GoNoGo Squeeze into positive territory which would confirm the change in trend and tell us that momentum is in line with the new “Go” trend.
Gold Valiantly Trying to Stay in Trend
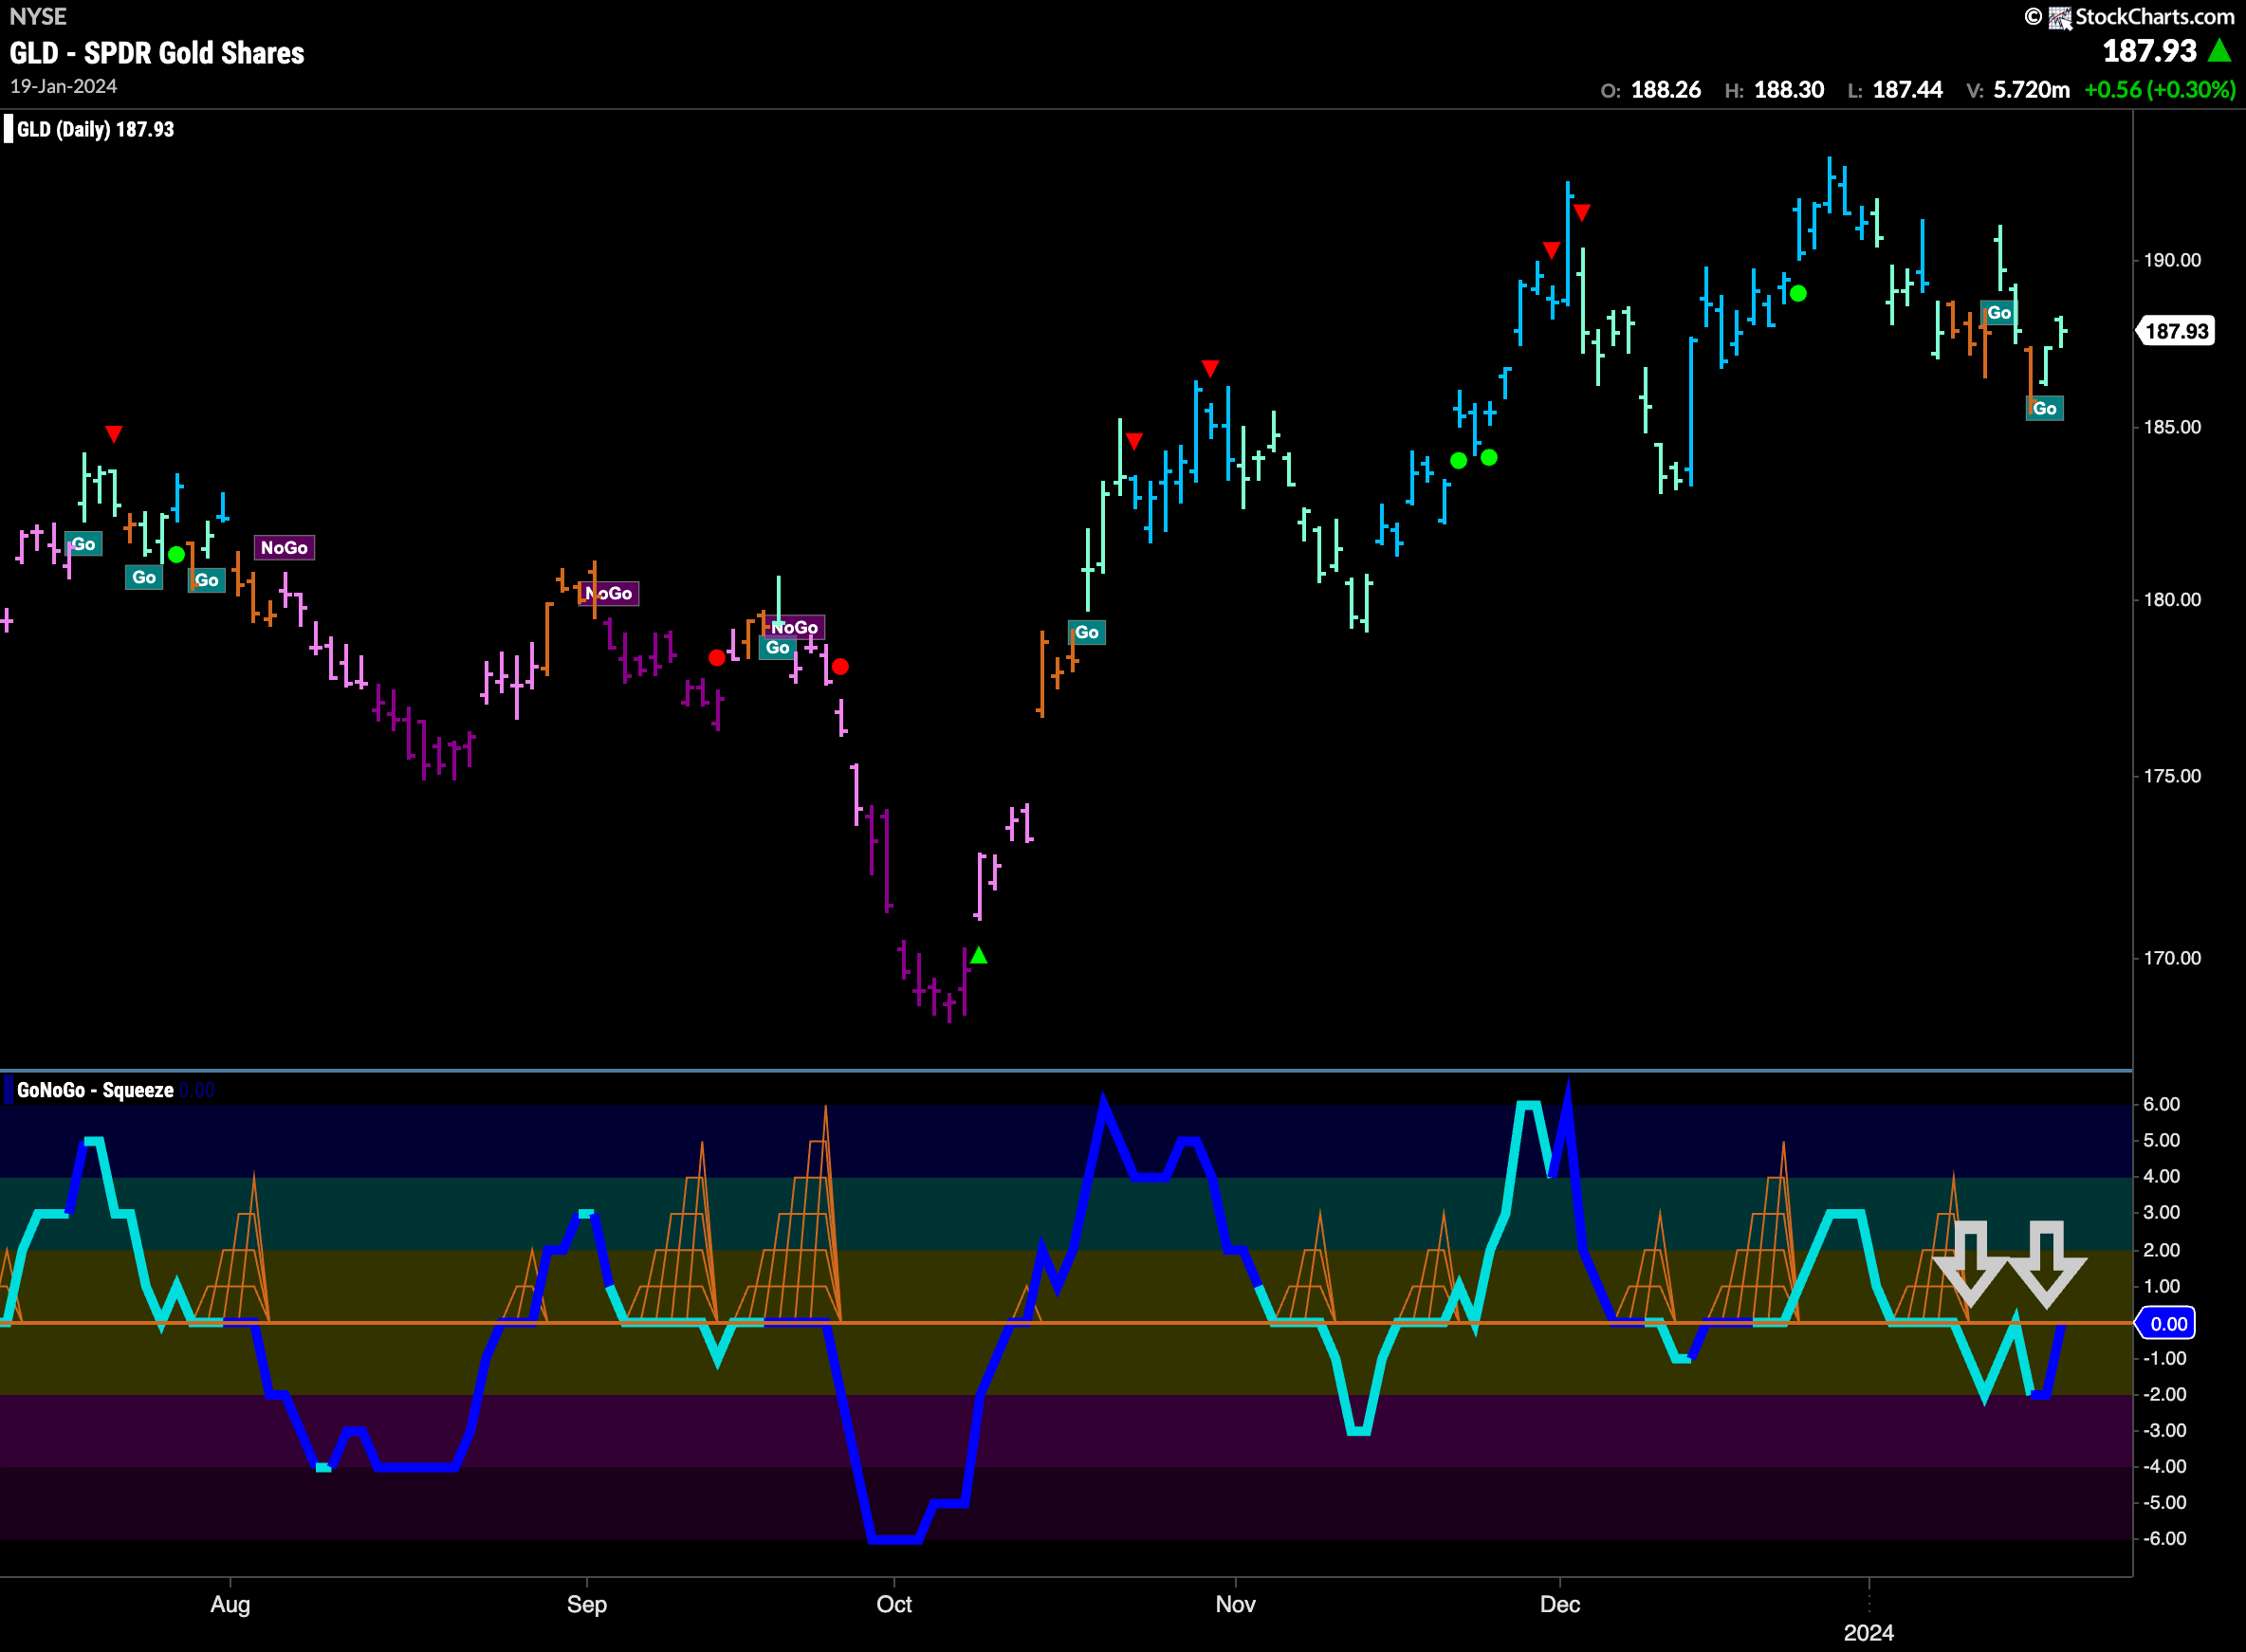
GoNoGo Trend Gold fighting back again this week. After another amber “Go Fish” bar the indicator was able to paint aqua “Go” bars as the week ended. However, we so see that GoNoGo Oscillator is now finding resistance at the zero line and is now testing that level once again on heavy volume. If it falls into negative territory again it will be even harder this week for the “Go” trend to persist.
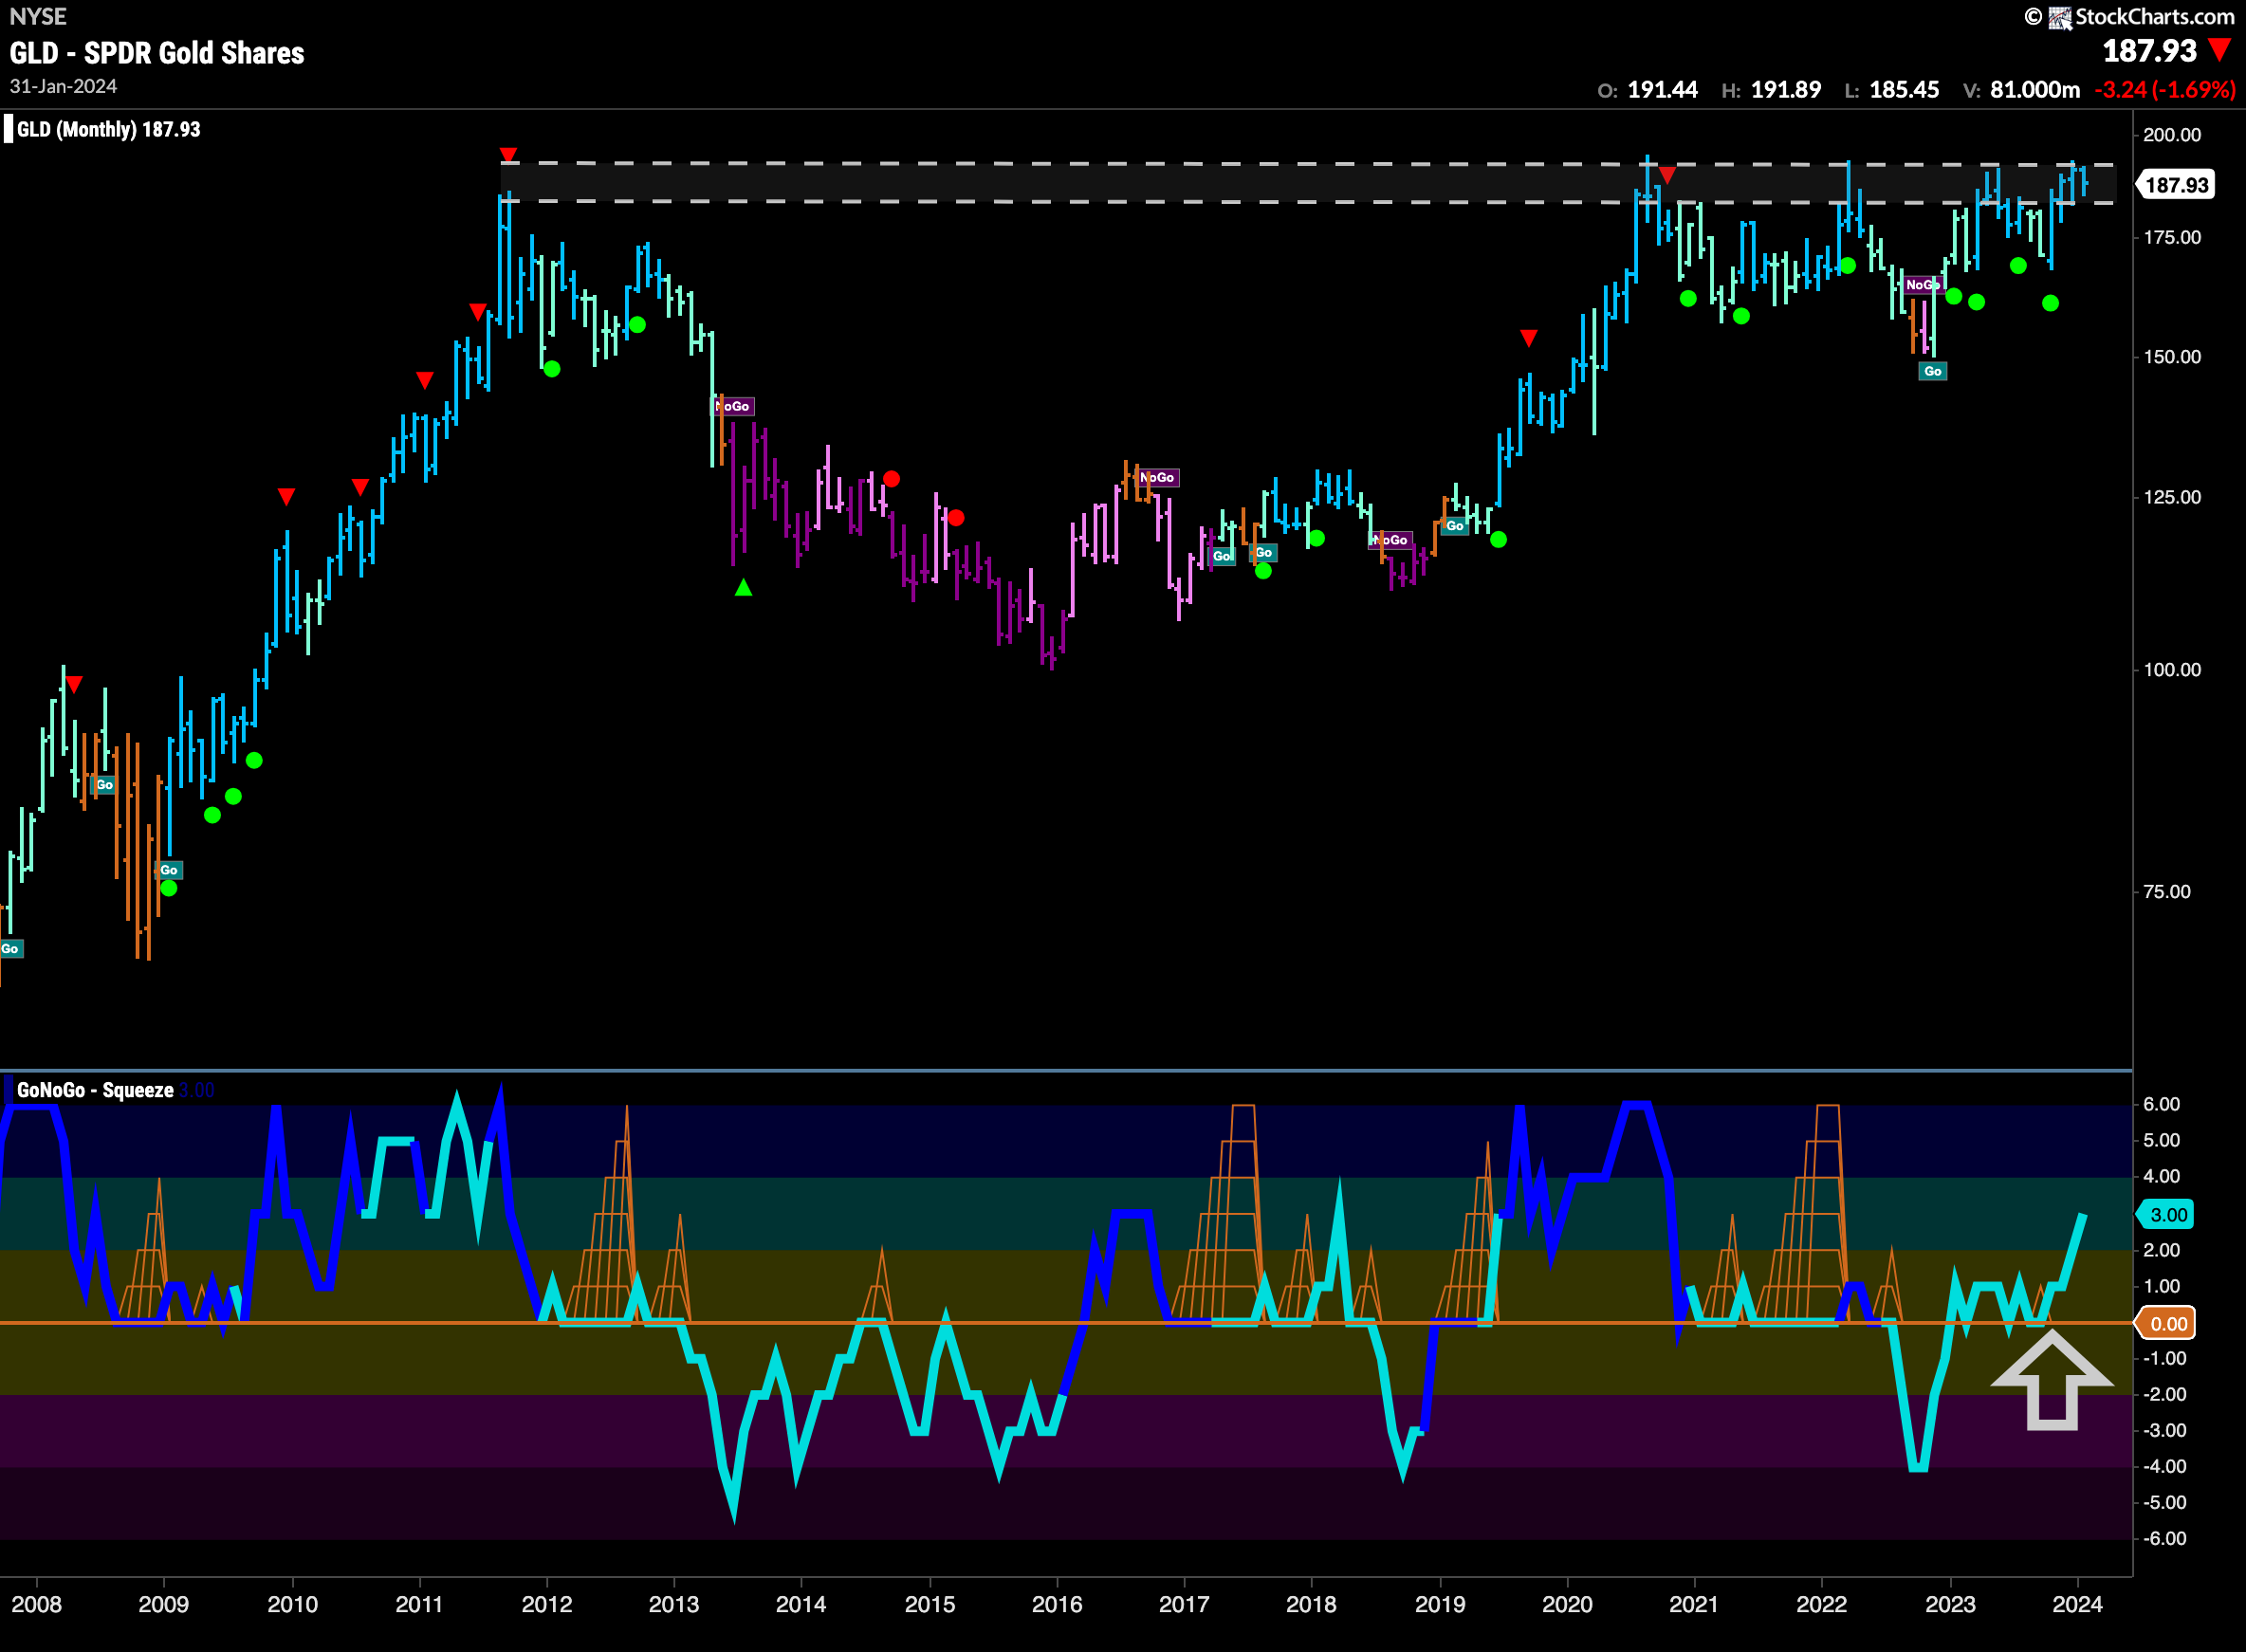
Perhaps it will take another decade before there is a decisive break out! The monthly chart here shows price again struggling with the overhead supply and resistance at these levels. This is a chart that we will likely be looking at all year. It remains encouraging that GoNoGo Oscillator has found support again at zero and is now in positive territory. With GoNoGo Trend painting strong blue bars the outlook is certainly more bullish than anything else.
Sector RelMap
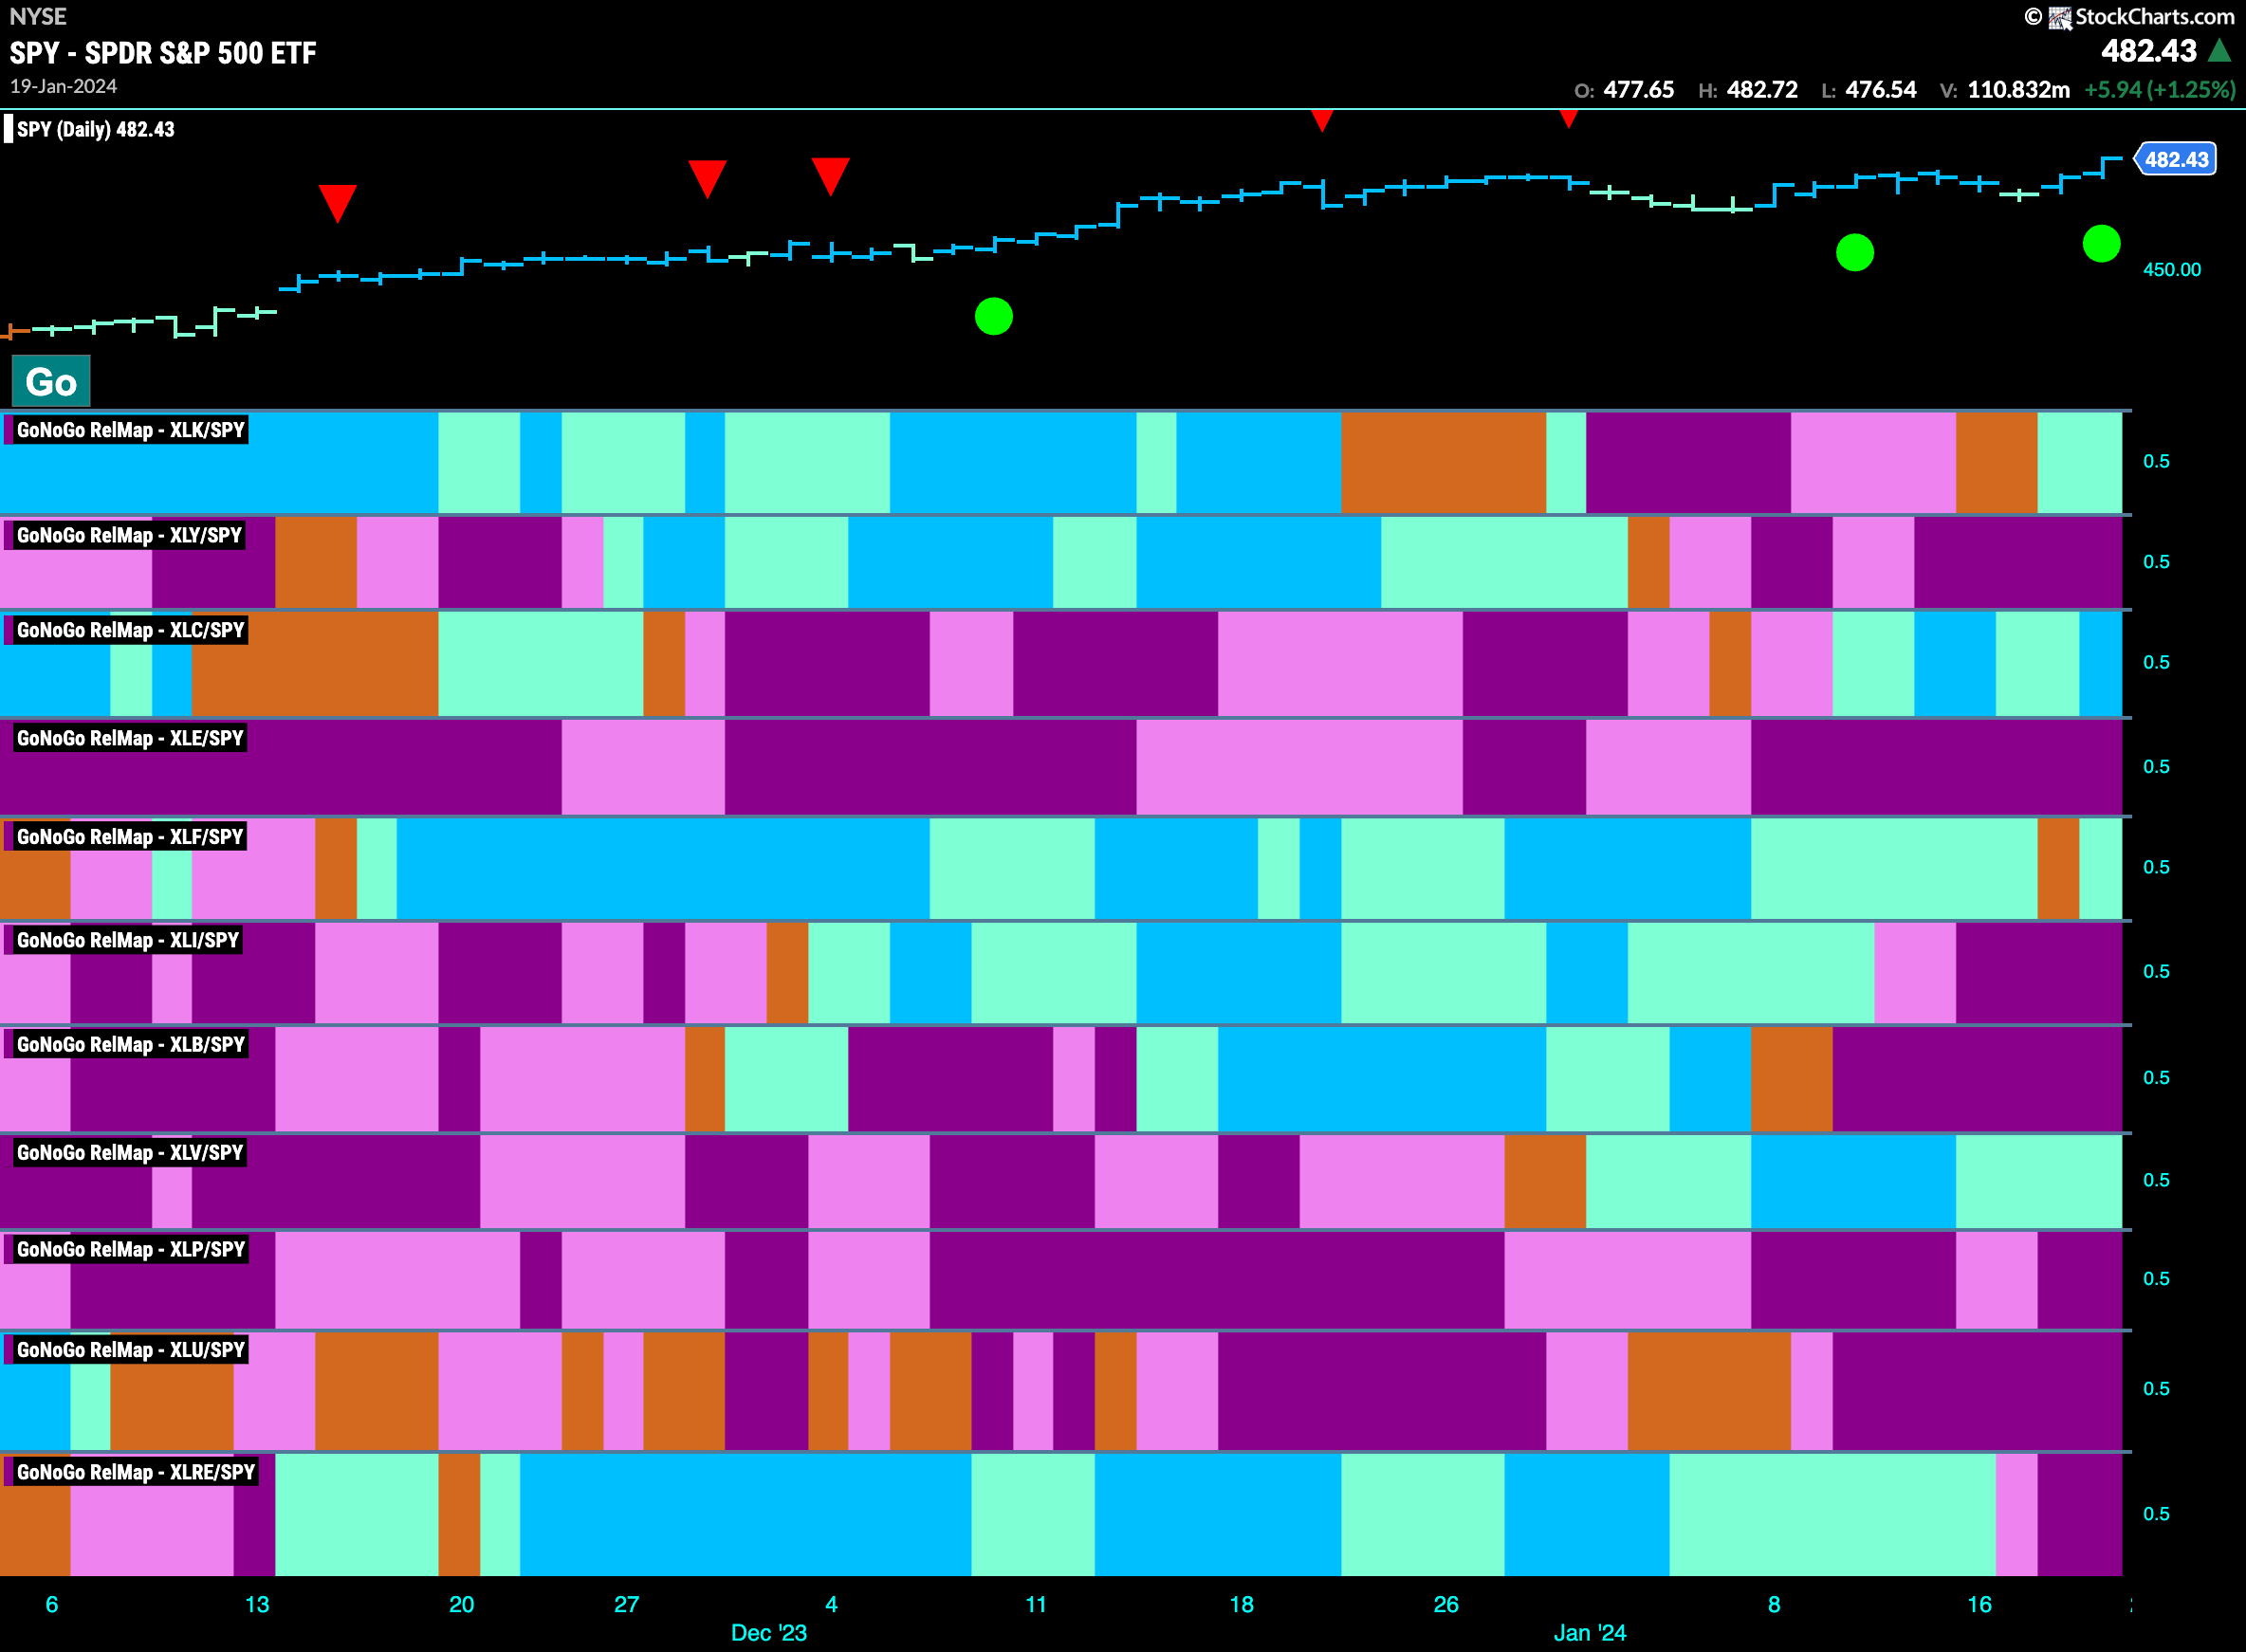
Below is the GoNoGo Sector RelMap. This GoNoGo RelMap applies the GoNoGo Trend to the relative strength ratios of the sectors to the base index. Looking at this map, we can quickly see where the relative outperformance is coming from as well as which sectors are lagging on a relative basis. 4 sectors are outperforming the base index this week. $XLK, $XLC, $XLF and $XLV, are painting “Go” bars.
Technology Sub-Group RelMap
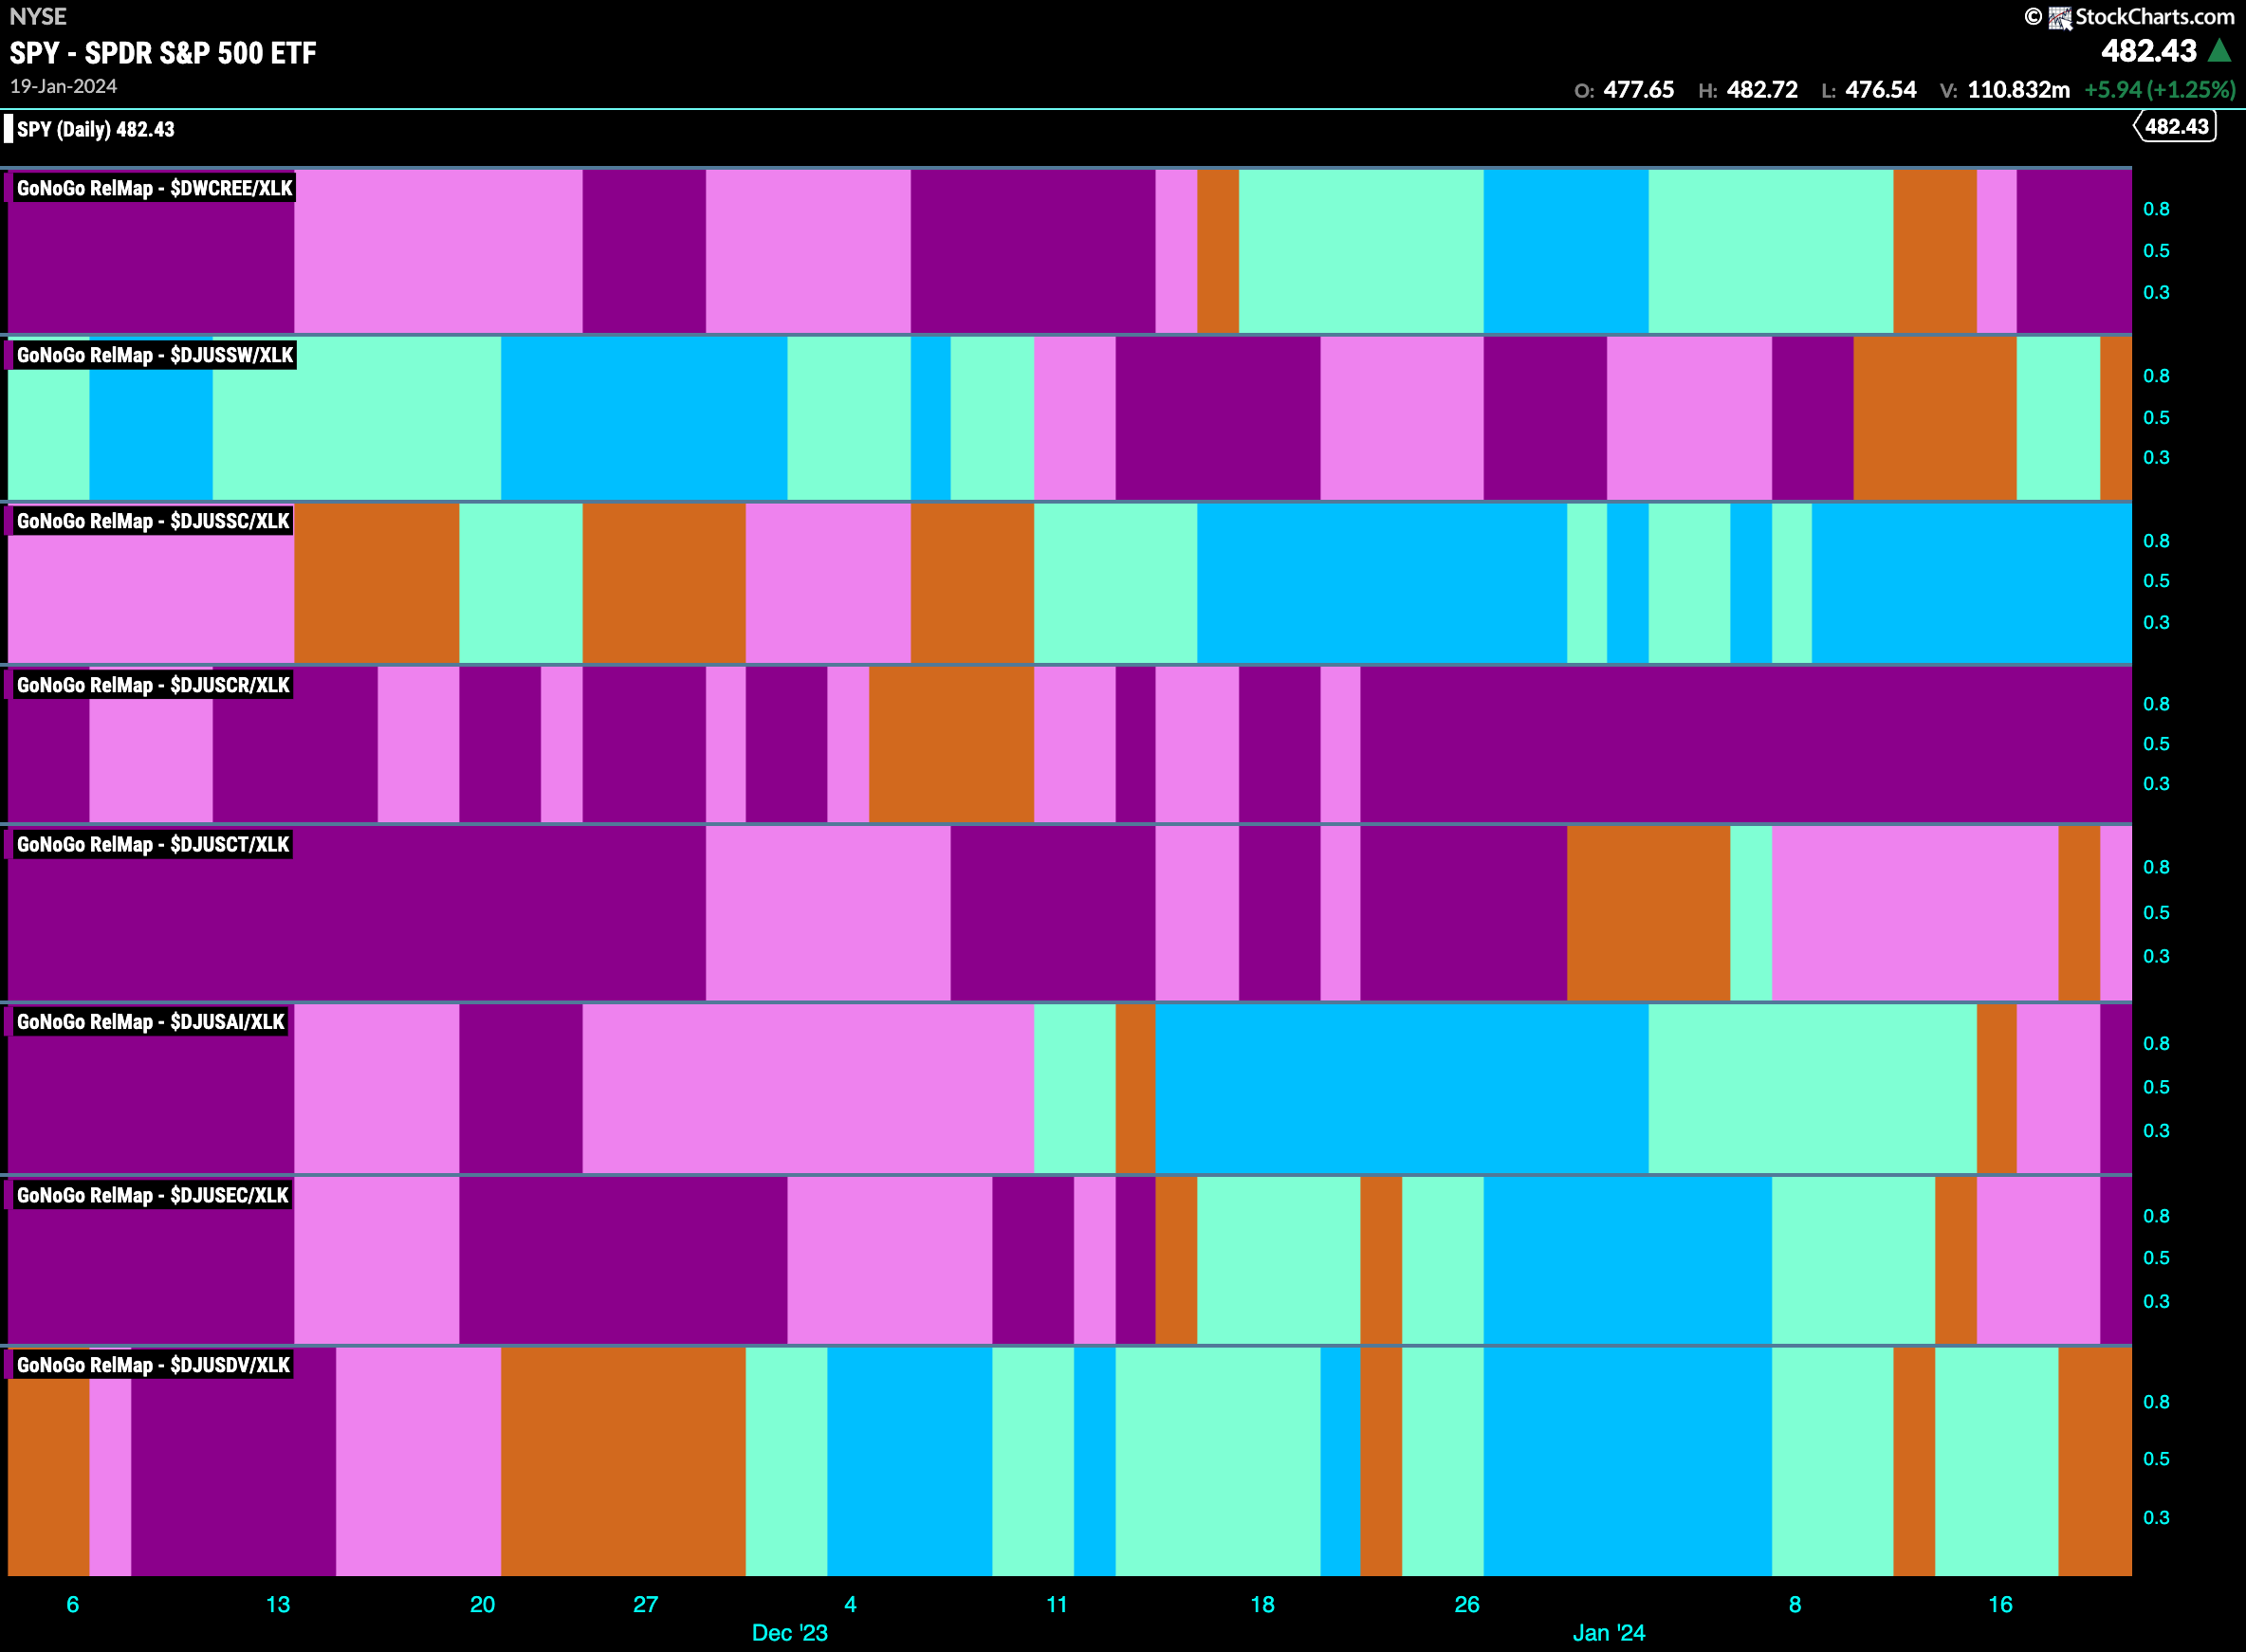
The GoNoGo Sector RelMap above shows that the technology sector has started to outperform the larger index on a relative basis. It ist the last of the “Go” sectors to join the party on the above RelMap. Below, we see the individual groups of the sector relative to the sector itself. We apply the GoNoGo Trend to those ratios and see that (no surprise) it is the semi conductors sub group that is powering technology back into a position of leadership.
$SOXX Sockin’ it to ’em!
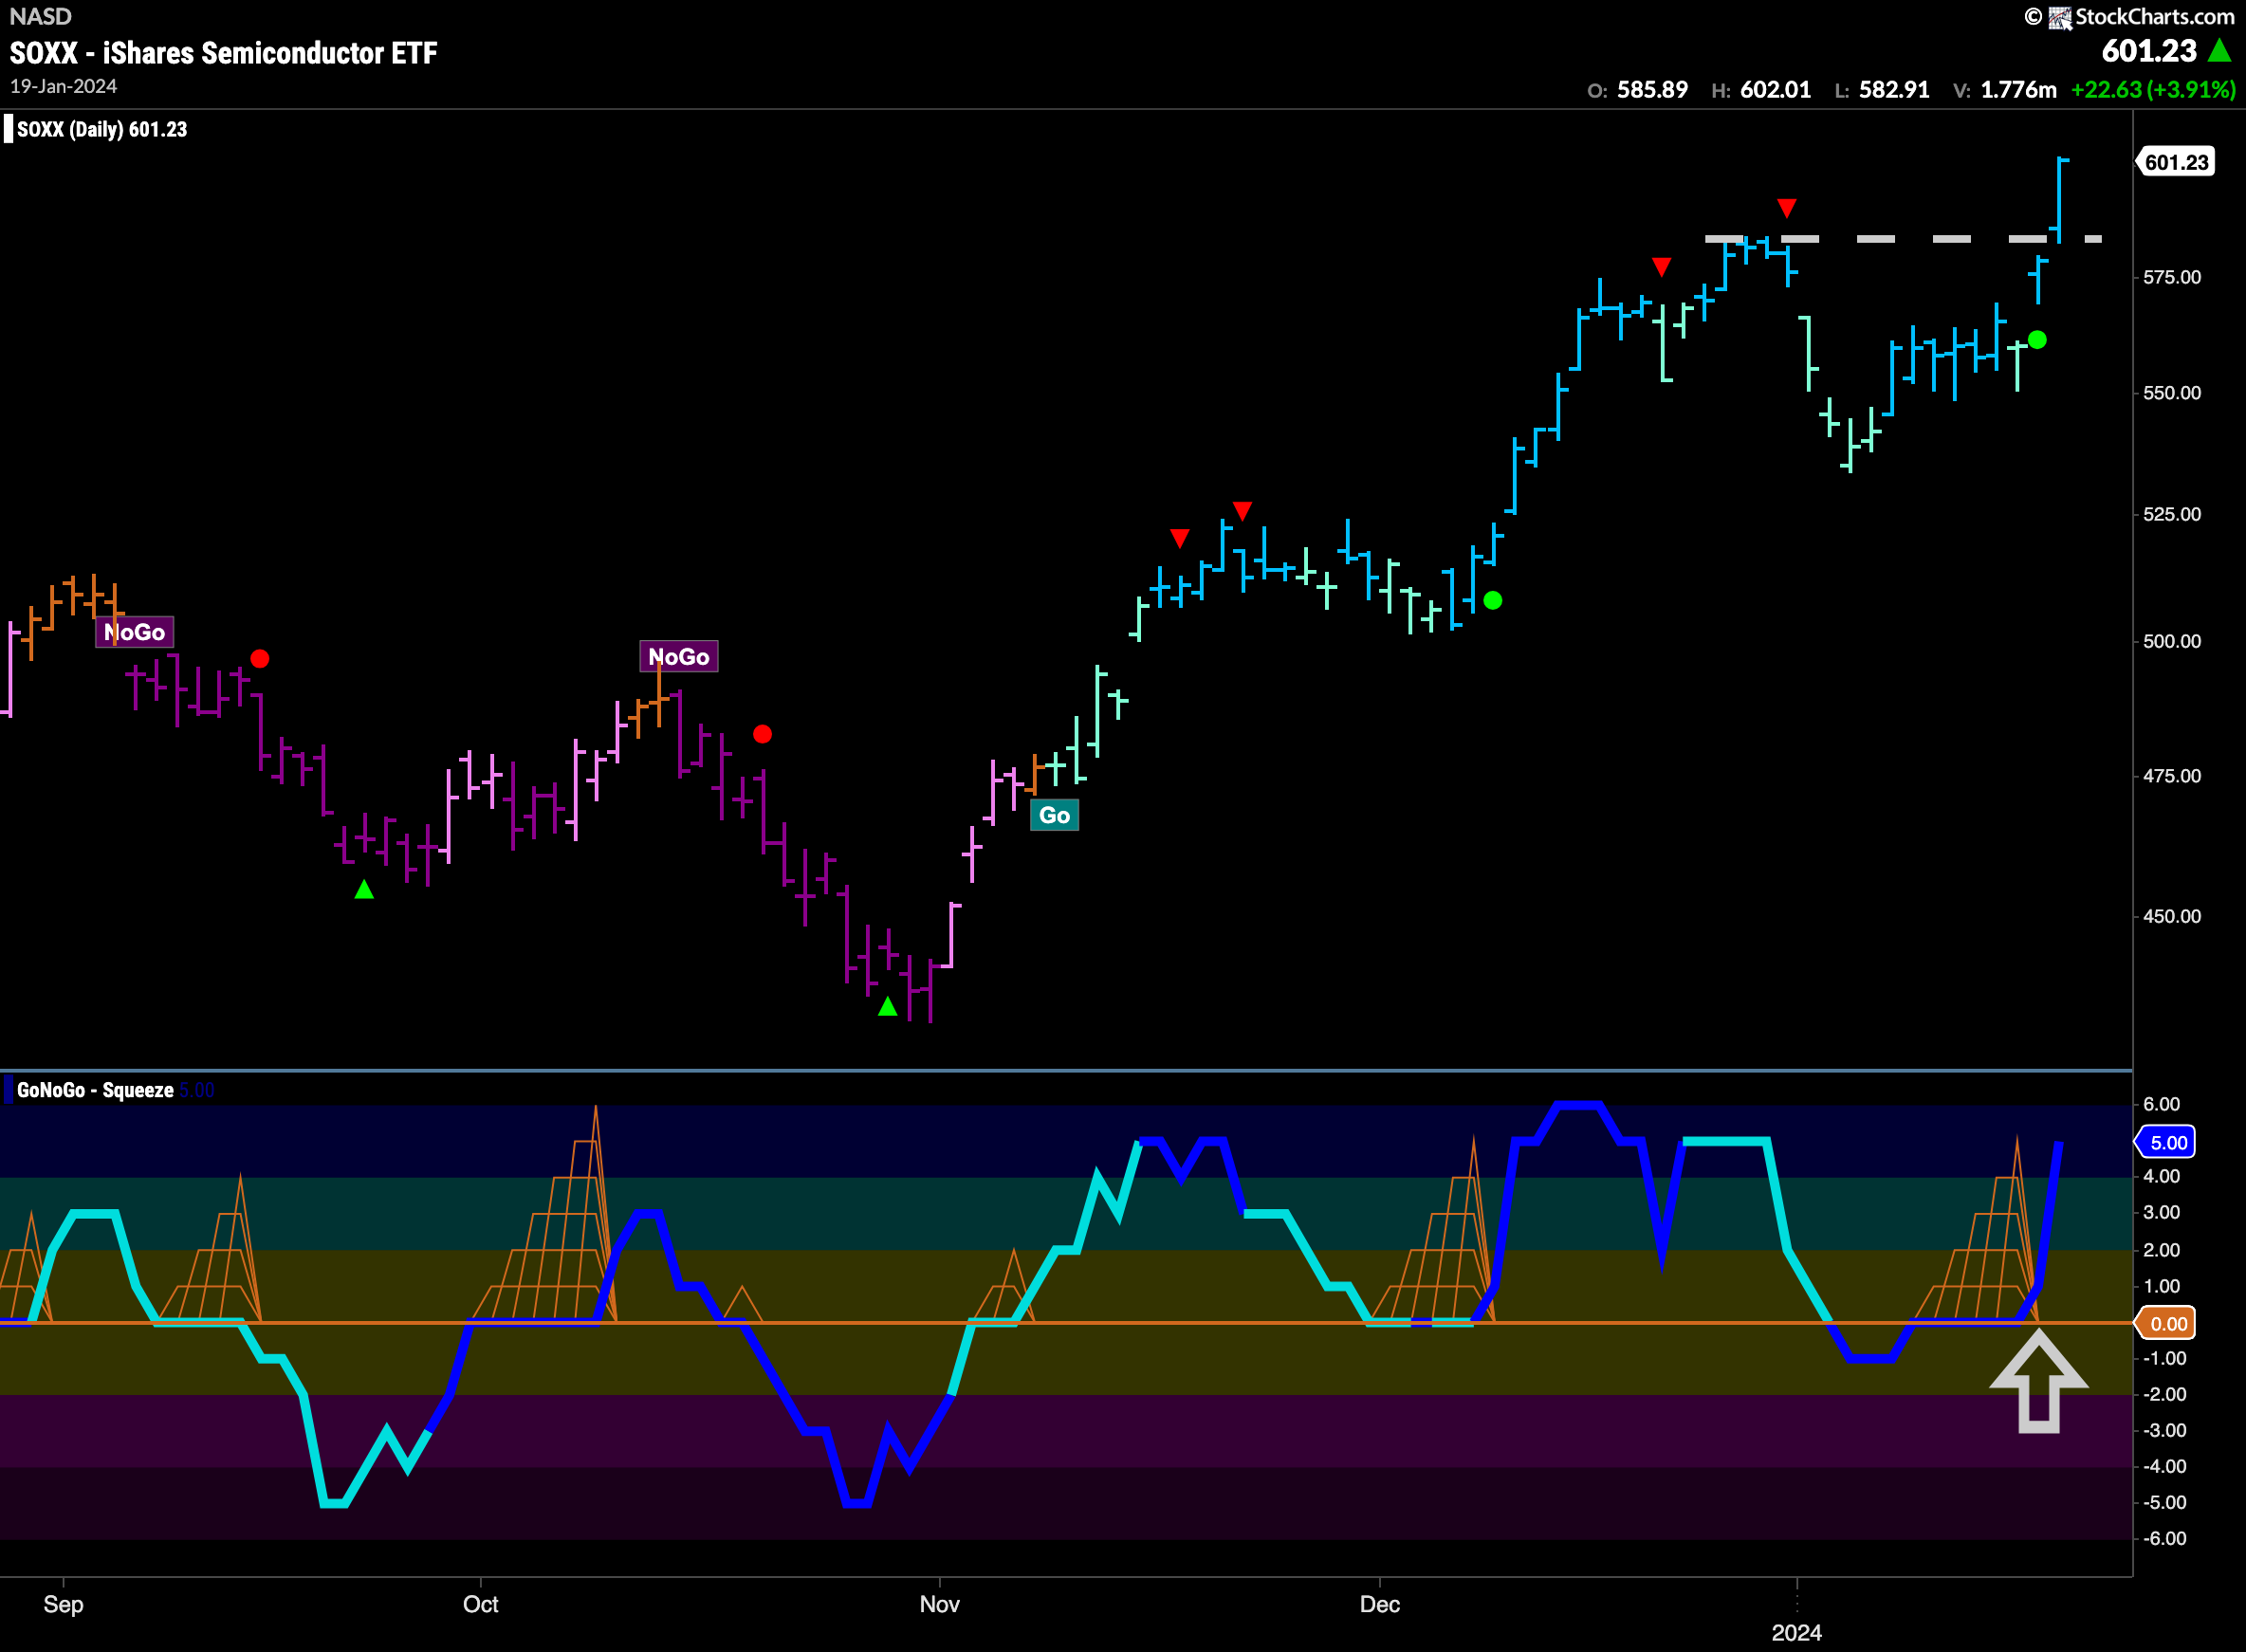
$SOXX had a great week. As the market rallied so did $SOXX but with even more energy. We can see that on heavy volume the GoNoGo Oscillator broke out of a GoNoGo Squeeze and flew into overbought territory at a value of 5. This high velocity move propelled price to new highs and a break of what could have been some resistance form a prior high in one single bar. With momentum in positive territory and strong “Go” bars these are definite signs of trend continuation.
$NVDA Racing Higher
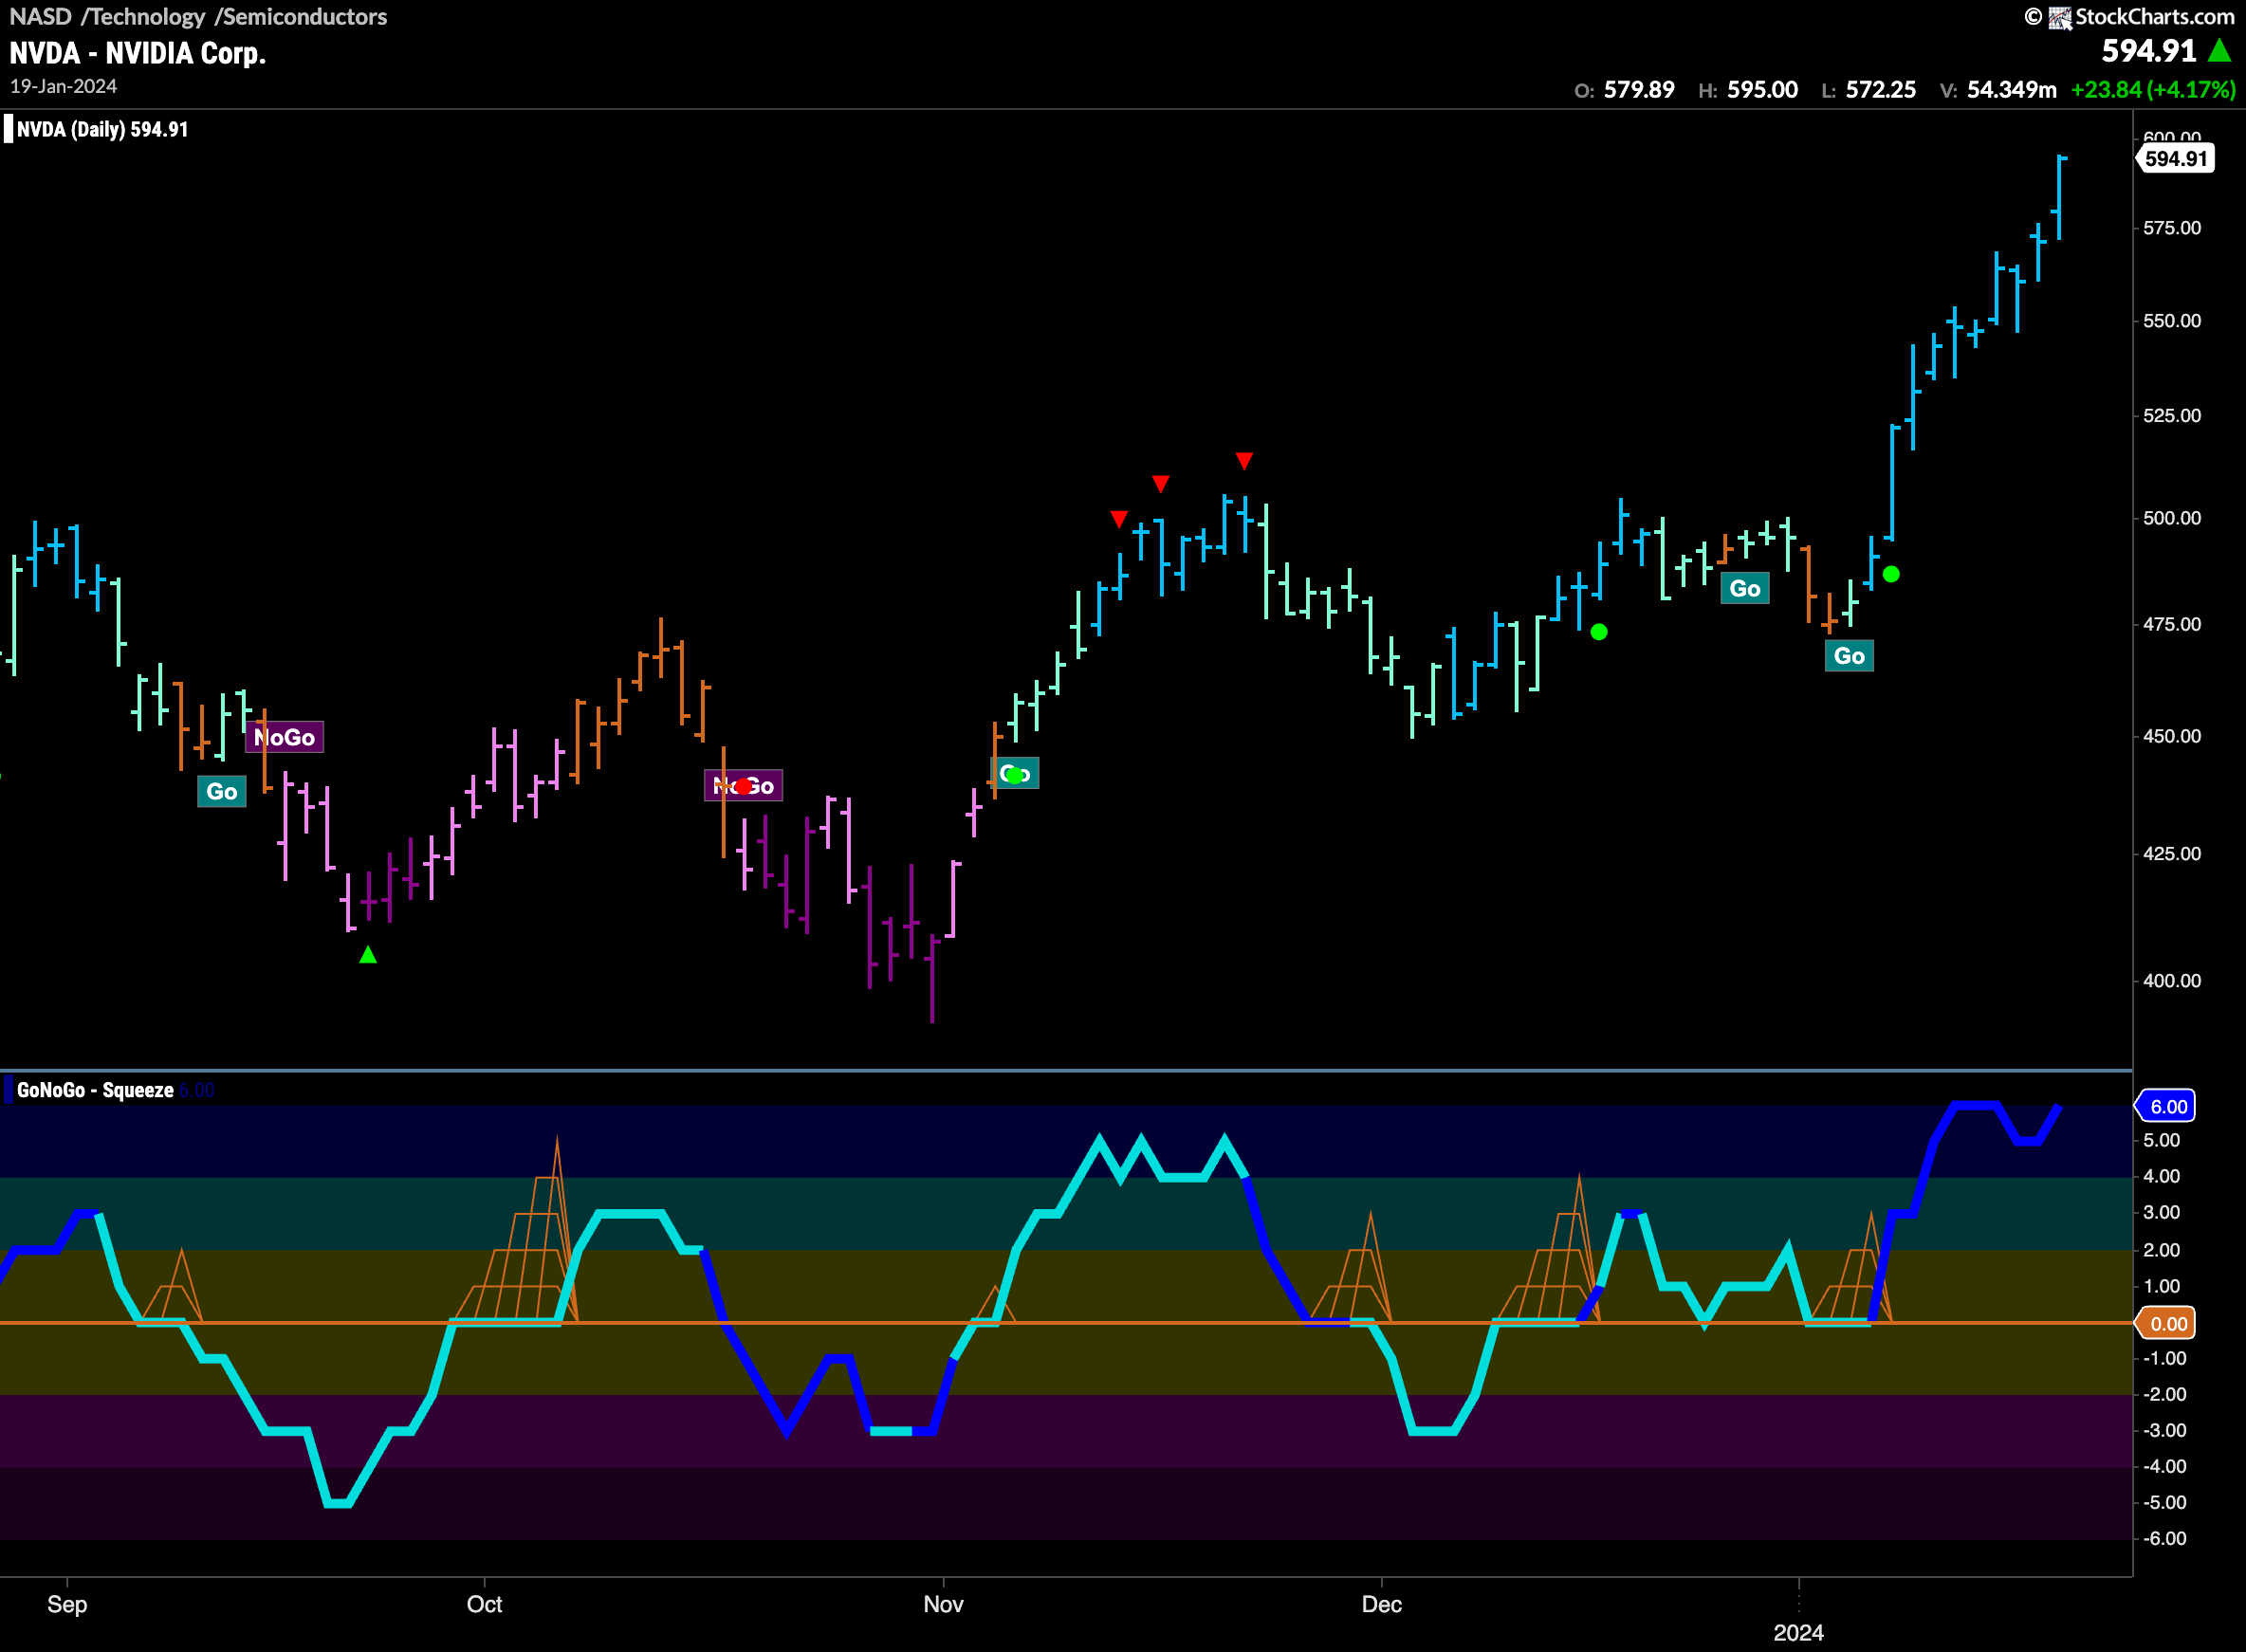
A true powerhouse in the industry, Nvidia is in a strong “Go” trend with the indicator painting a string of uninterrupted bright blue “Go” bars ever since the market made up its mind following the uncertainty of the “Go Fish” bars a few weeks ago. GoNoGo Oscillator found support at the zero line at that time and has since raced to overbought territory on heavy volume. As of yet, there are no signs of price slowing down.
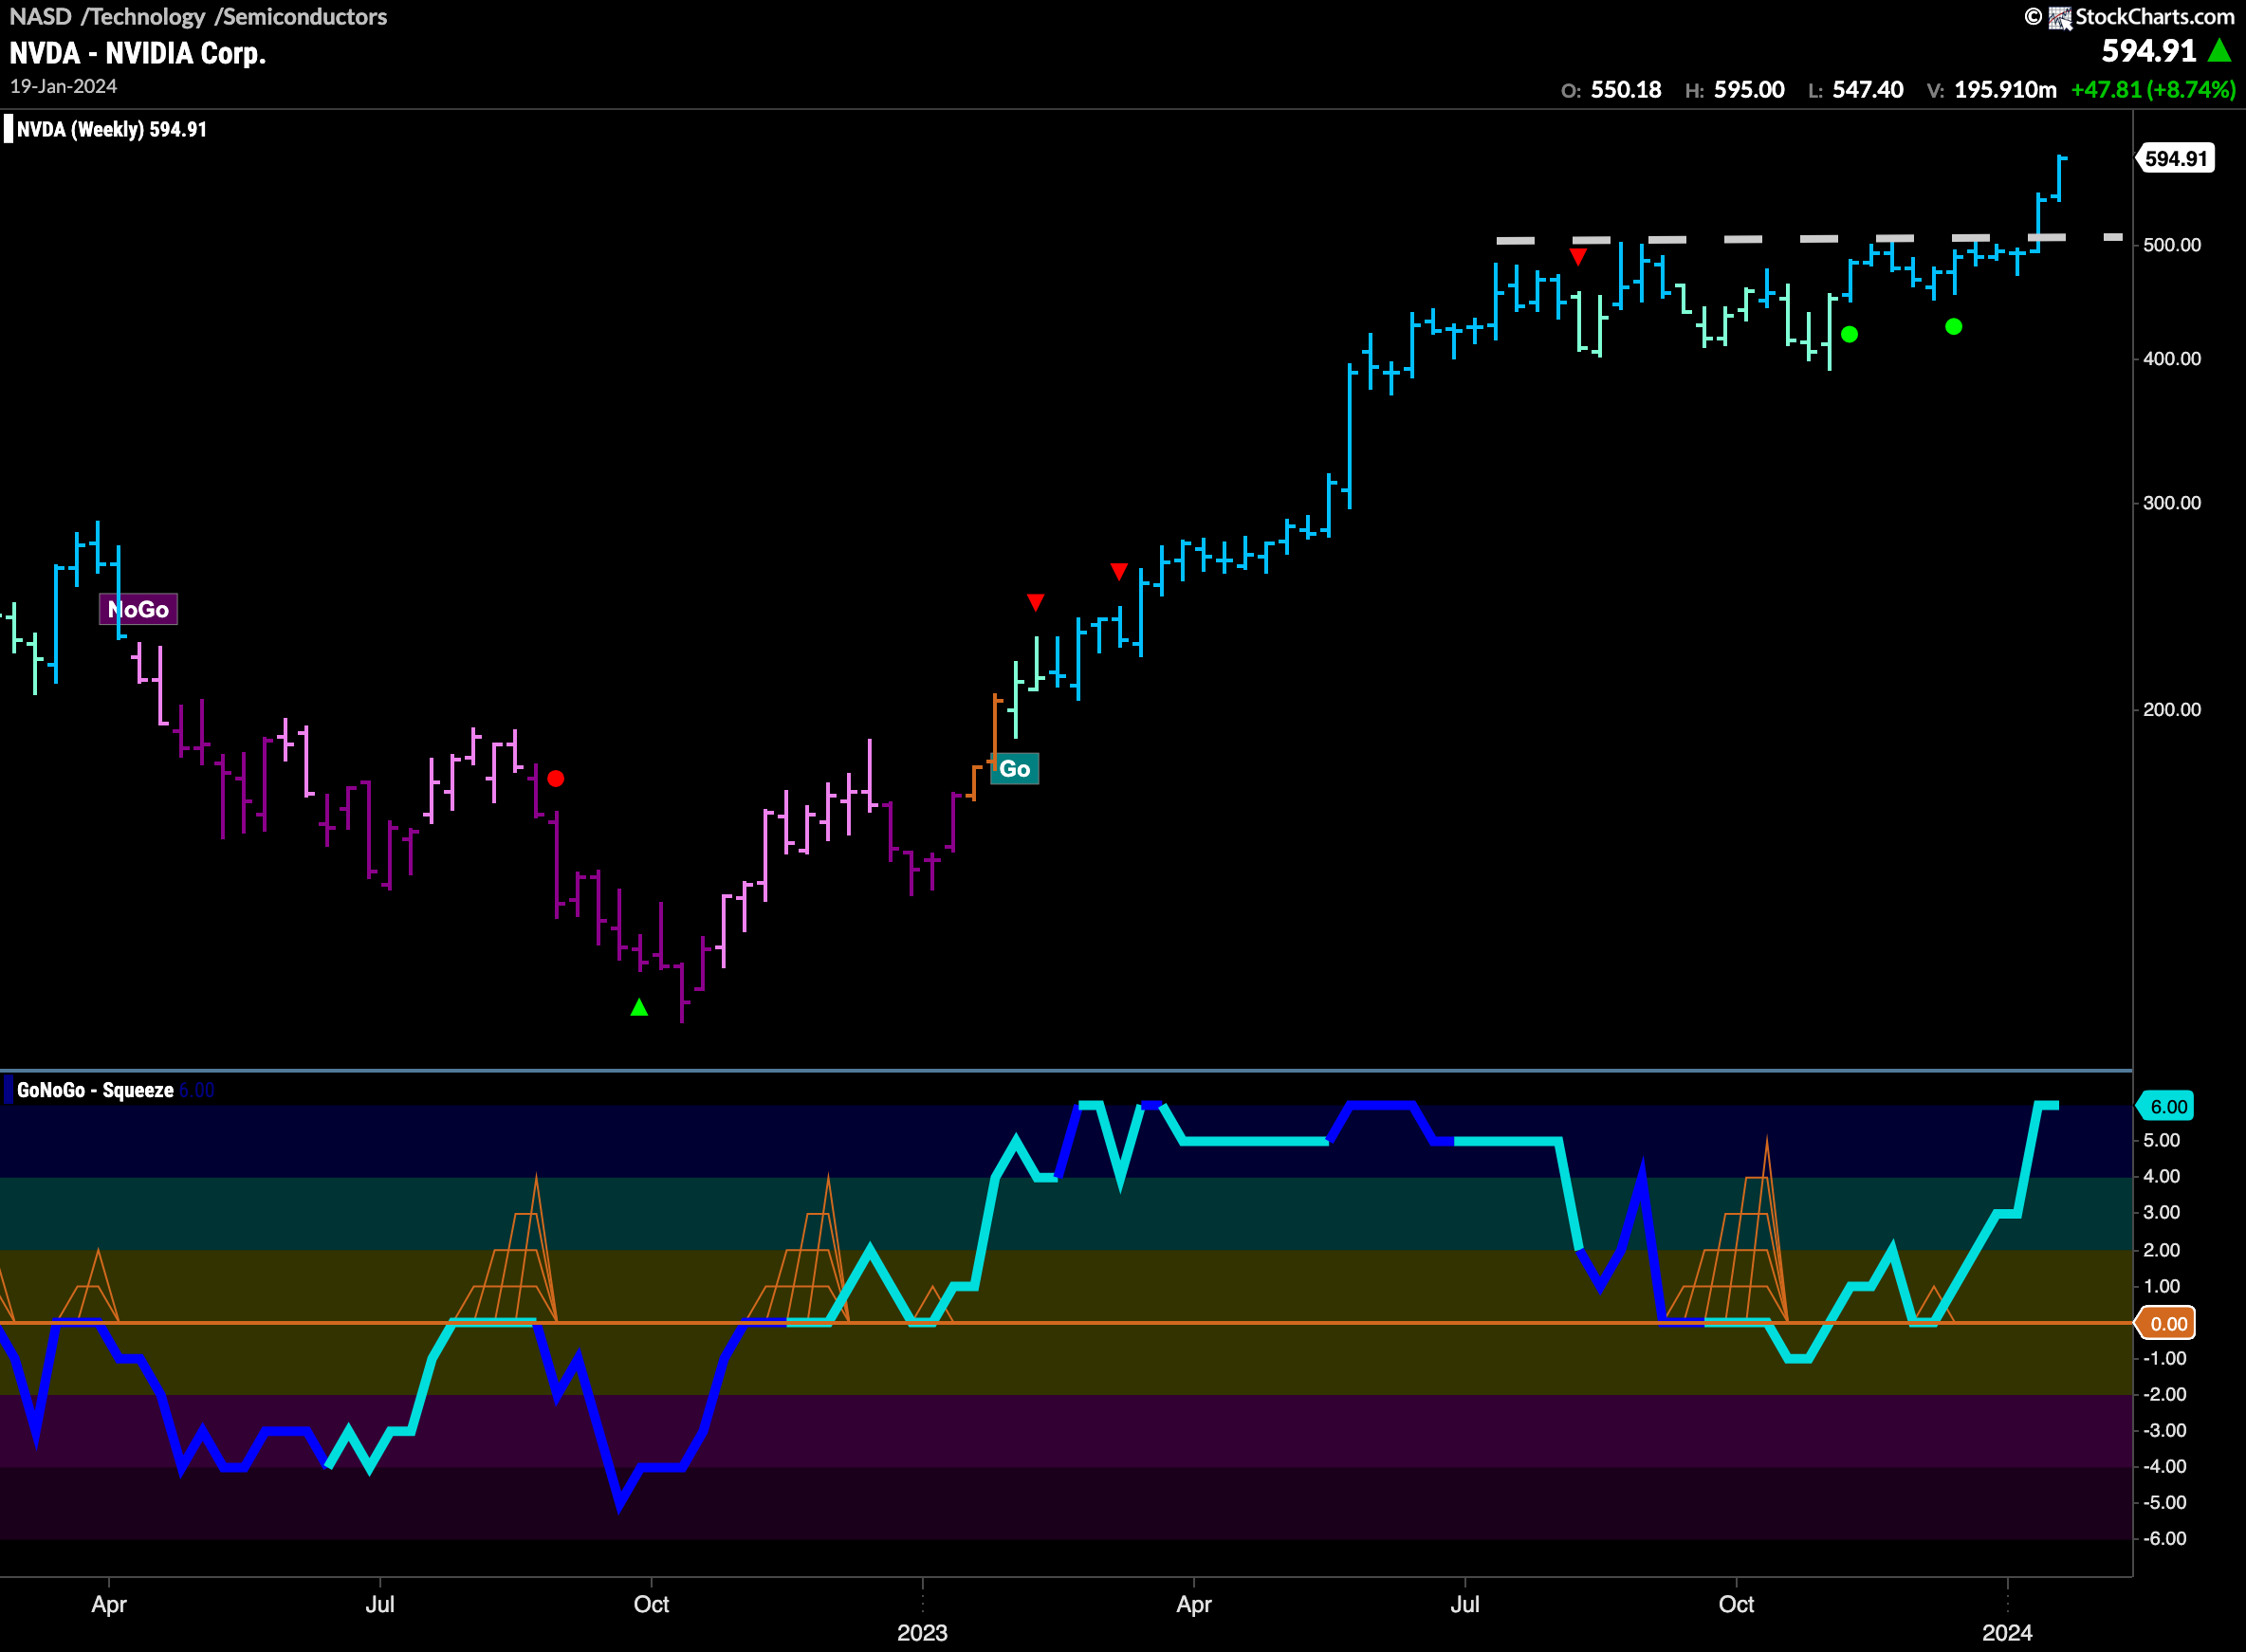
The longer time frame chart shows that this is a significant move higher. We see that price moved sideways for several months as this “Go” trend consolidated. Even as GoNoGo Trend showed some weakness with aqua bars GoNoGo Oscillator was able to mostly find support at the zero line and stay in positive territory. During the second half of the consolidation, we saw two Go Trend Continuation Icons (green circles) telling us that momentum was resurgent in the direction of the “Go” trend. In short order, we see that price has broken above resistance to new highs. A measured move approach puts a target close to $900. Are we only half way through this move?
