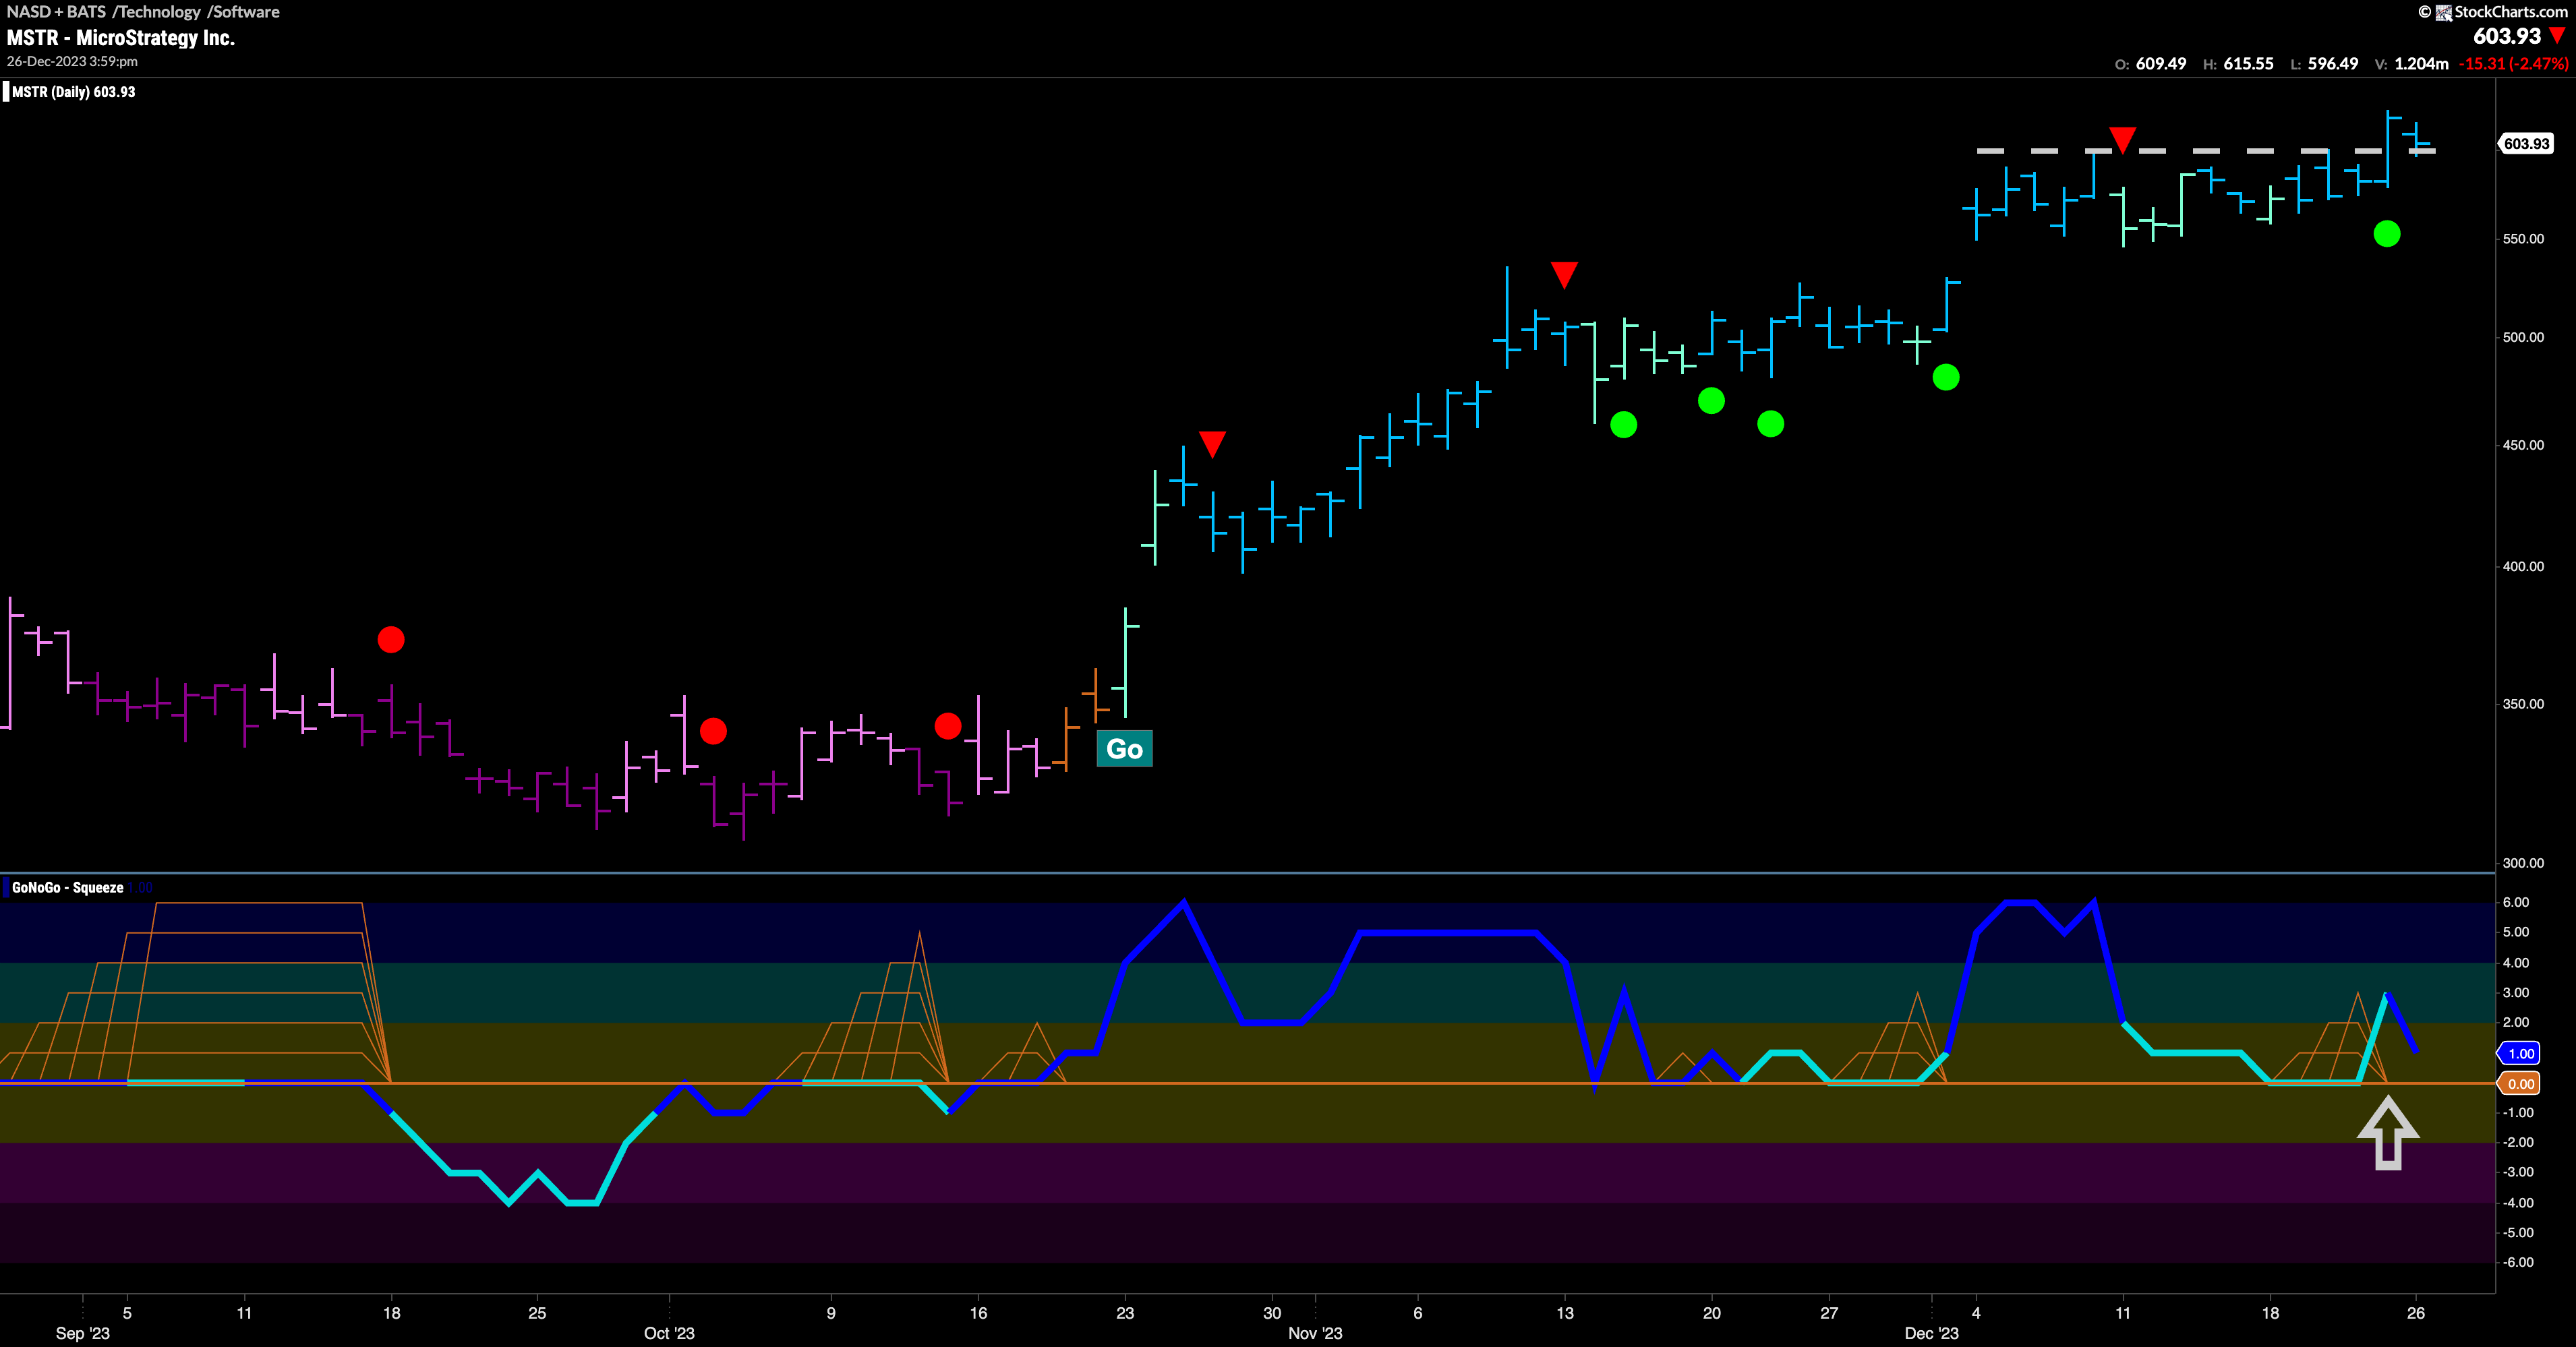

After rallying out of a “NoGo” trend in late October, $MSTR has seen a new “Go” trend in the form of higher highs and higher lows since then.
More recently, as momentum cooled earlier this month we saw the GoNoGo Chart post a Go Countertrend Correction Icon (red triangle) after the most recent high. GoNoGo Trend also painted some weaker aqua bars as price has moved mostly sideways since the last high and GoNoGo Oscillator fell to test the zero line from above. It remained there for a few days, telling us that there was little directional momentum as buyers and sellers fought over future price direction. Now, the oscillator has has broken out of a small GoNoGo Squeeze and that surging momentum in the direction of the underlying “Go” trend gave price the push it needed to close at a new high. We will see if it can consolidate from here and move higher.


