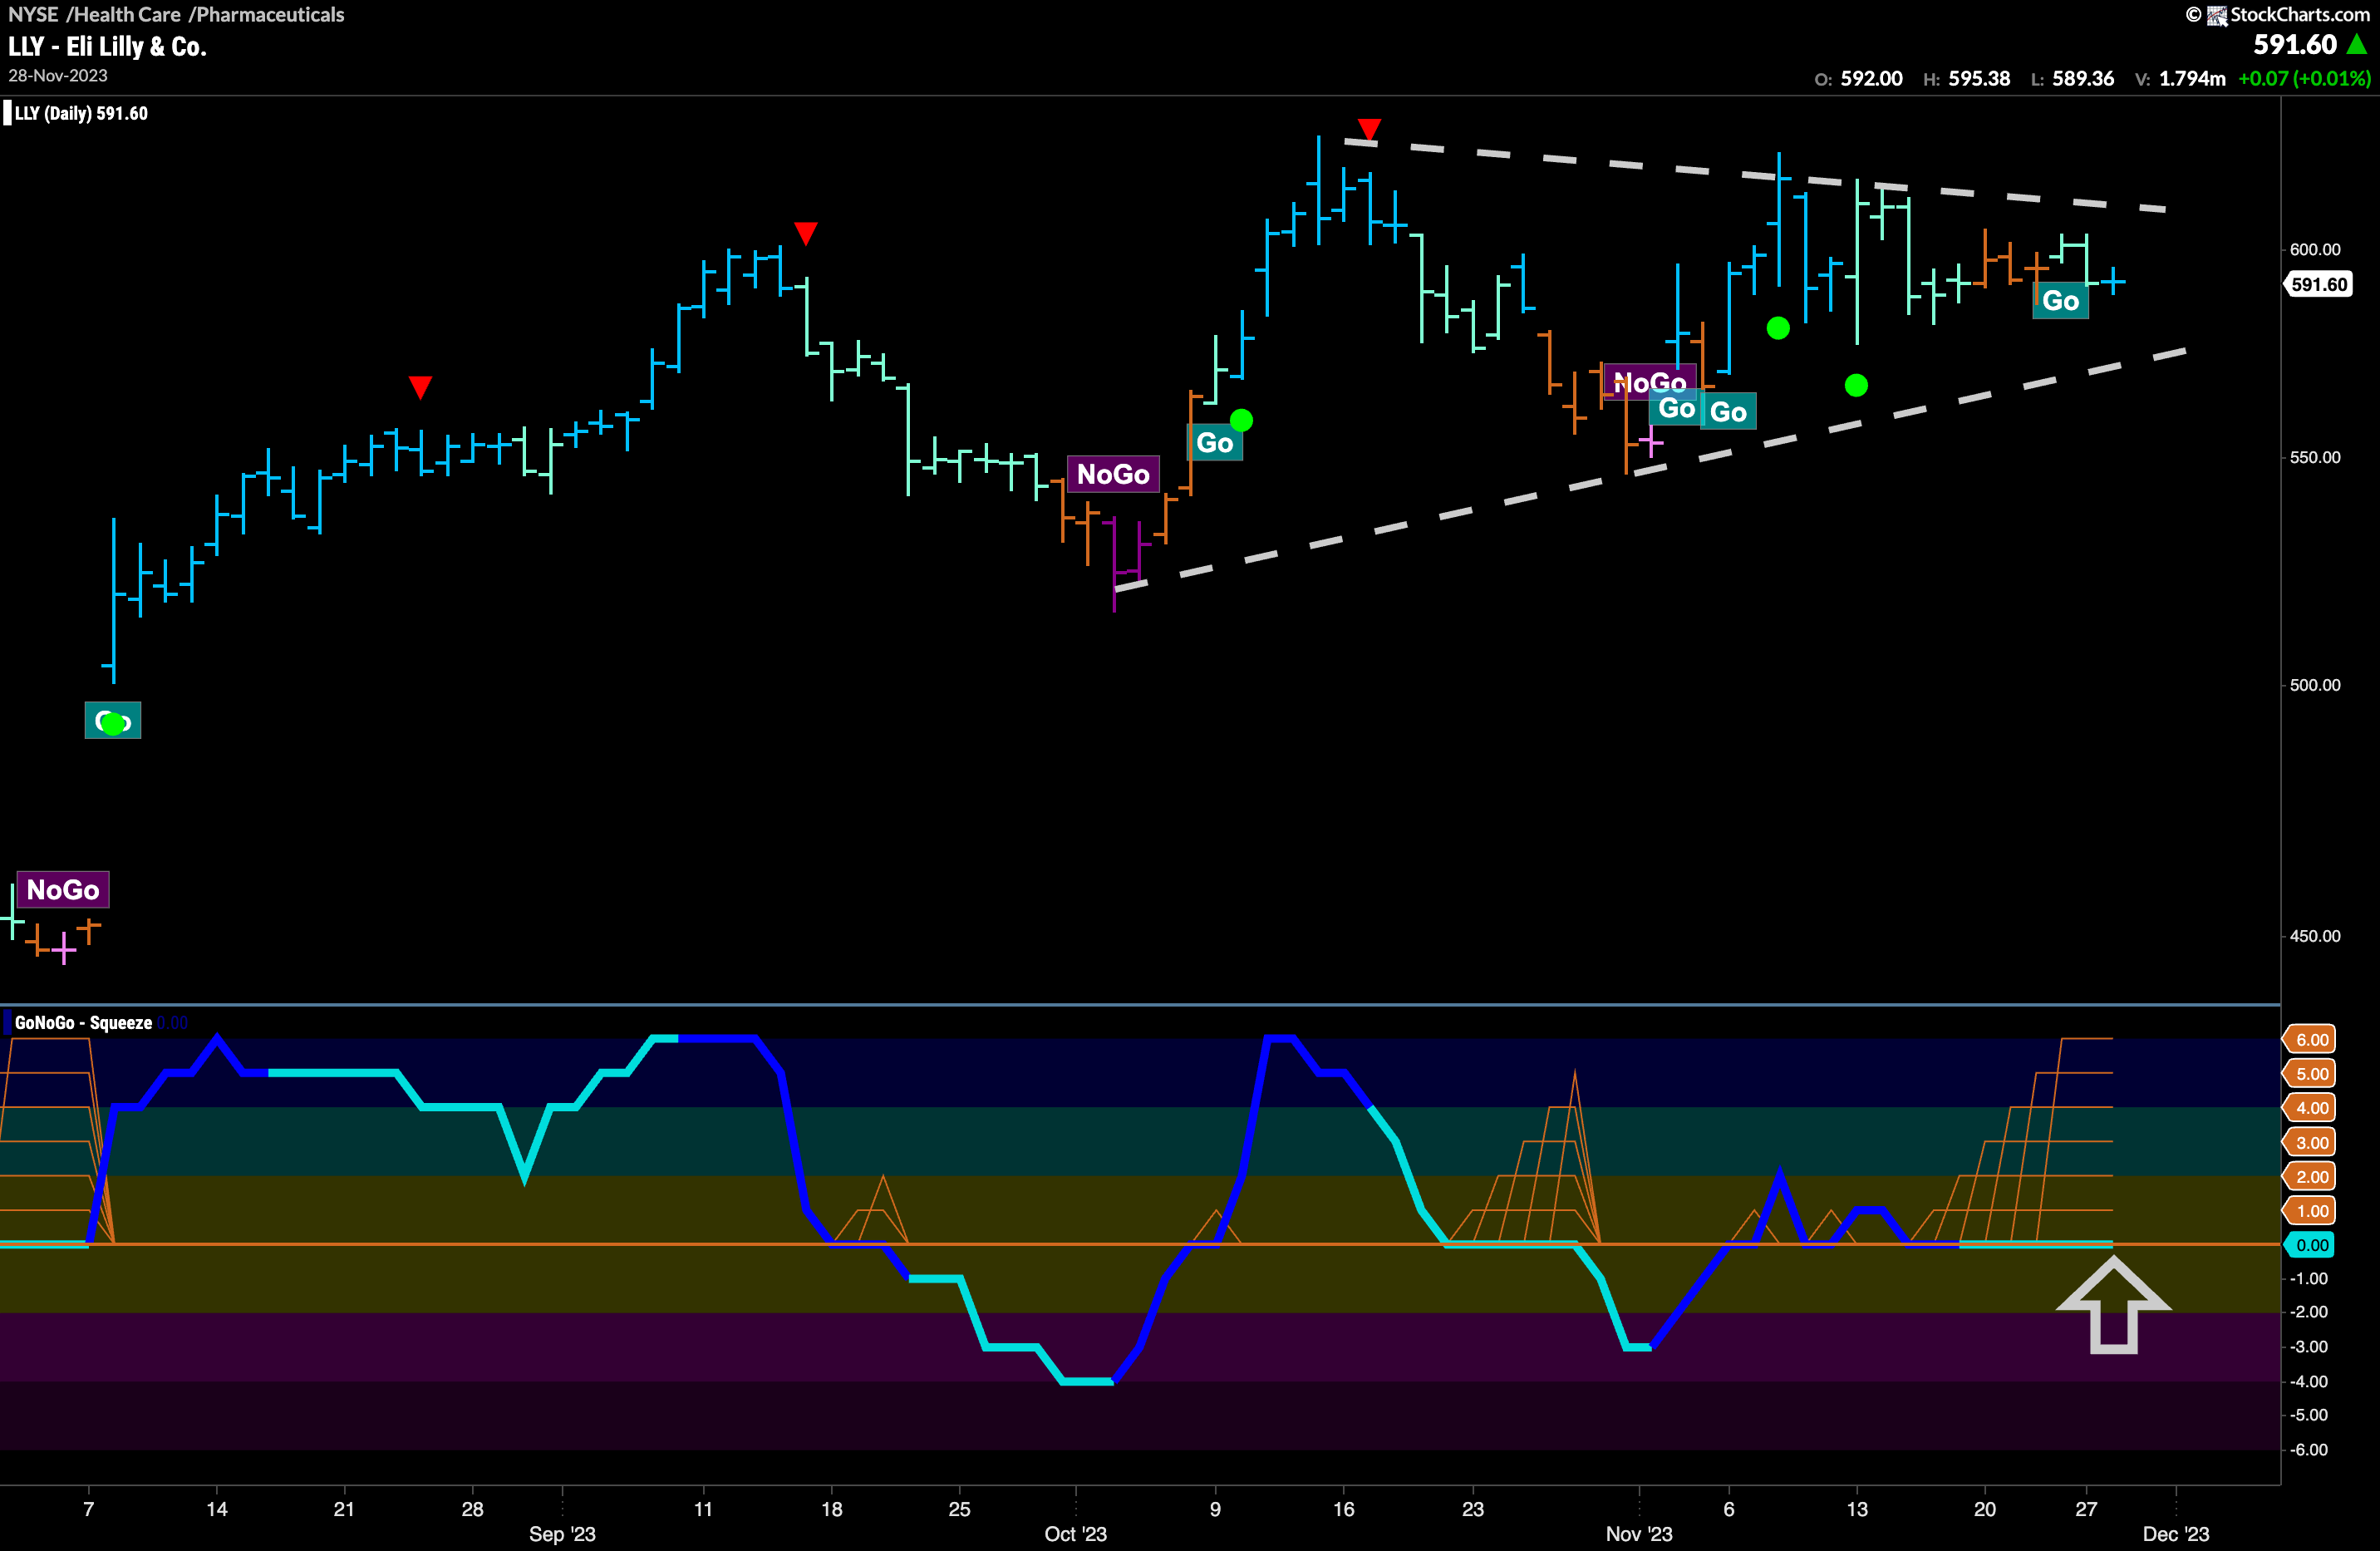

$LLY sees GoNoGo Trend painting “Go” bars as price tries to find direction.
The pharmaceuticals company has seen price set a series of lower highs while at the same time make a series of higher lows. Buyers and sellers are converging as we can see from the trend lines drawn on the chart. Sellers are selling more aggressively at lower price points but buyers are buying more aggressively at higher levels. This price compression has caused GoNoGo Oscillator to fall to and ride the zero line where we see the climbing grid of a Max GoNoGo Squeeze. We will watch for the break of the GoNoGo Squeeze in order to determine price’s most likely next direction. Given that GoNoGo Trend is painting “Go” bars, and if the Squeeze is broken into positive territory we may well see price break out of the triangle it is in and set a new higher high. Of course, if the Squeeze is broken to the downside, then we would look for price to test the rising support from the lower trend line.


