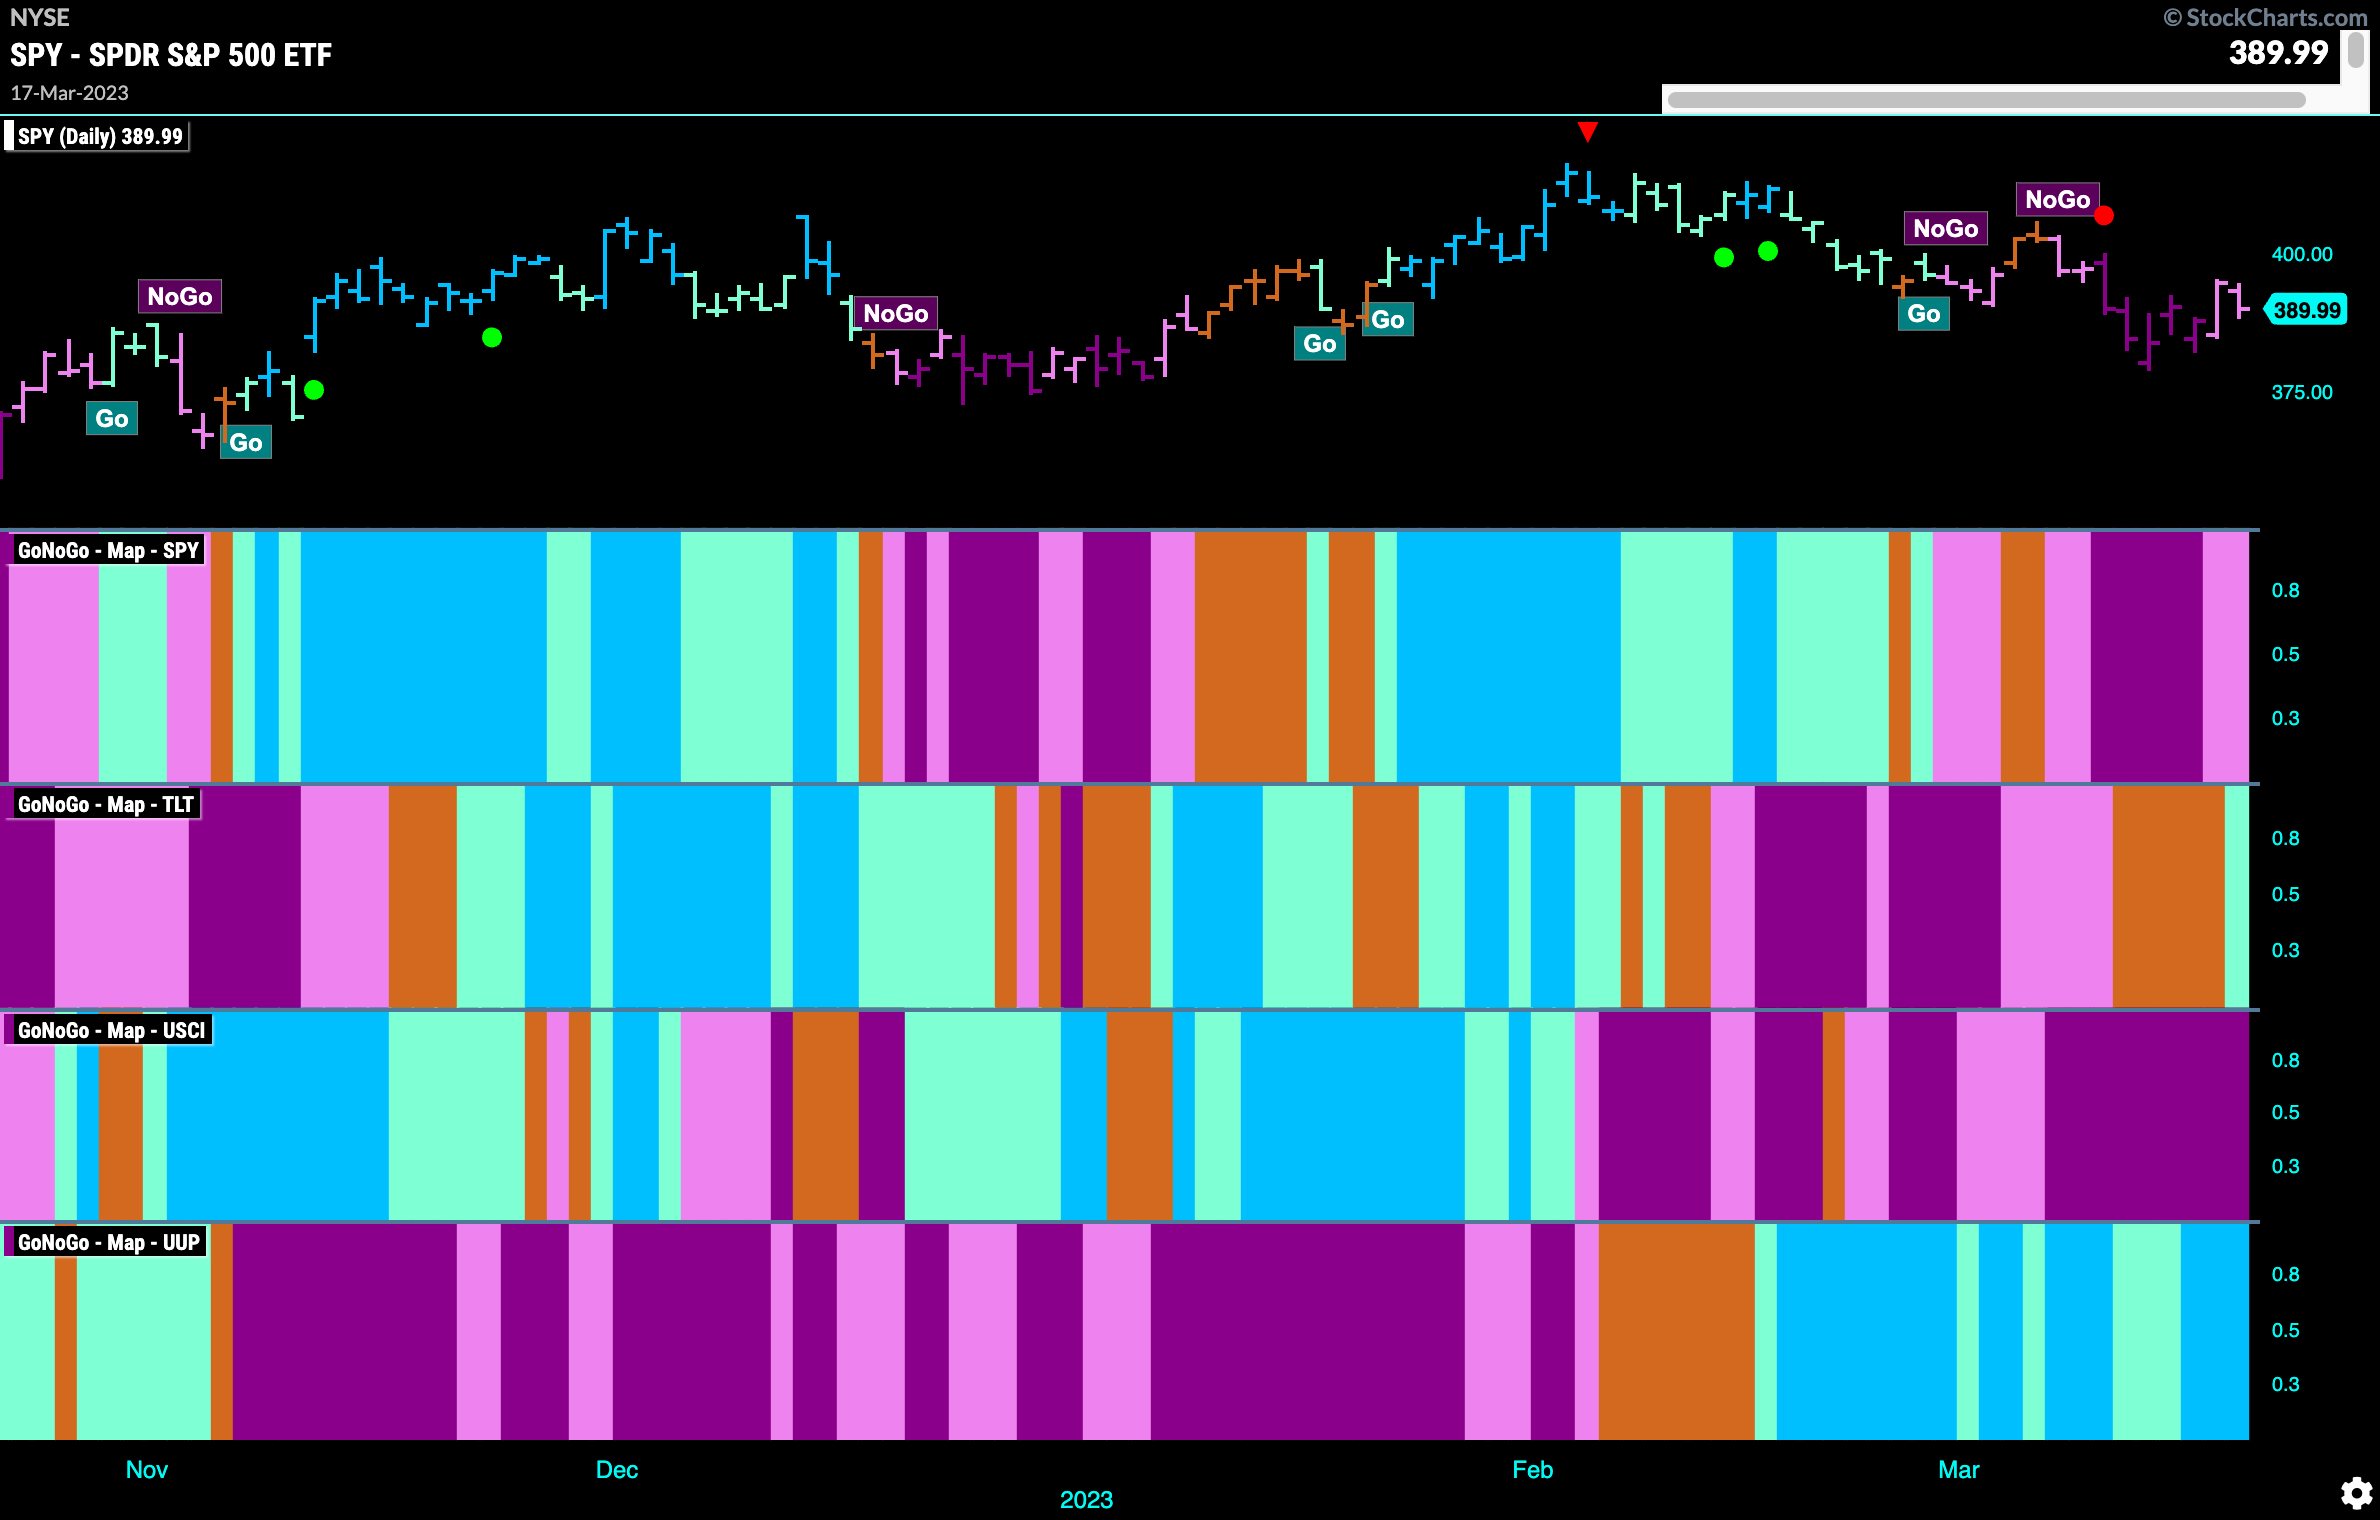
Good morning and welcome to this week’s Flight Path. Let’s take a look at the GoNoGo Asset map below. Equities continue to struggle although they did end the week painting weaker pink “NoGo” bars. We see an aqua blue “Go” bar in treasury bond prices but the “NoGo” in commodities and the “Go” in the dollar remain firmly in place.
Equities Try to Rally But Remain in NoGo
The “NoGo” trend remains in place for U.S. equities this week even as the week ended with some pink bars. GoNoGo Oscillator is testing the zero line from below and volume is heavy. We will watch to see if the zero line holds as support which we know it should if the “NoGo” is to remain strong. A rejection here at zero would likely put downward pressure on prices. The opposite scenario would be if the oscillator can break into positive territory. 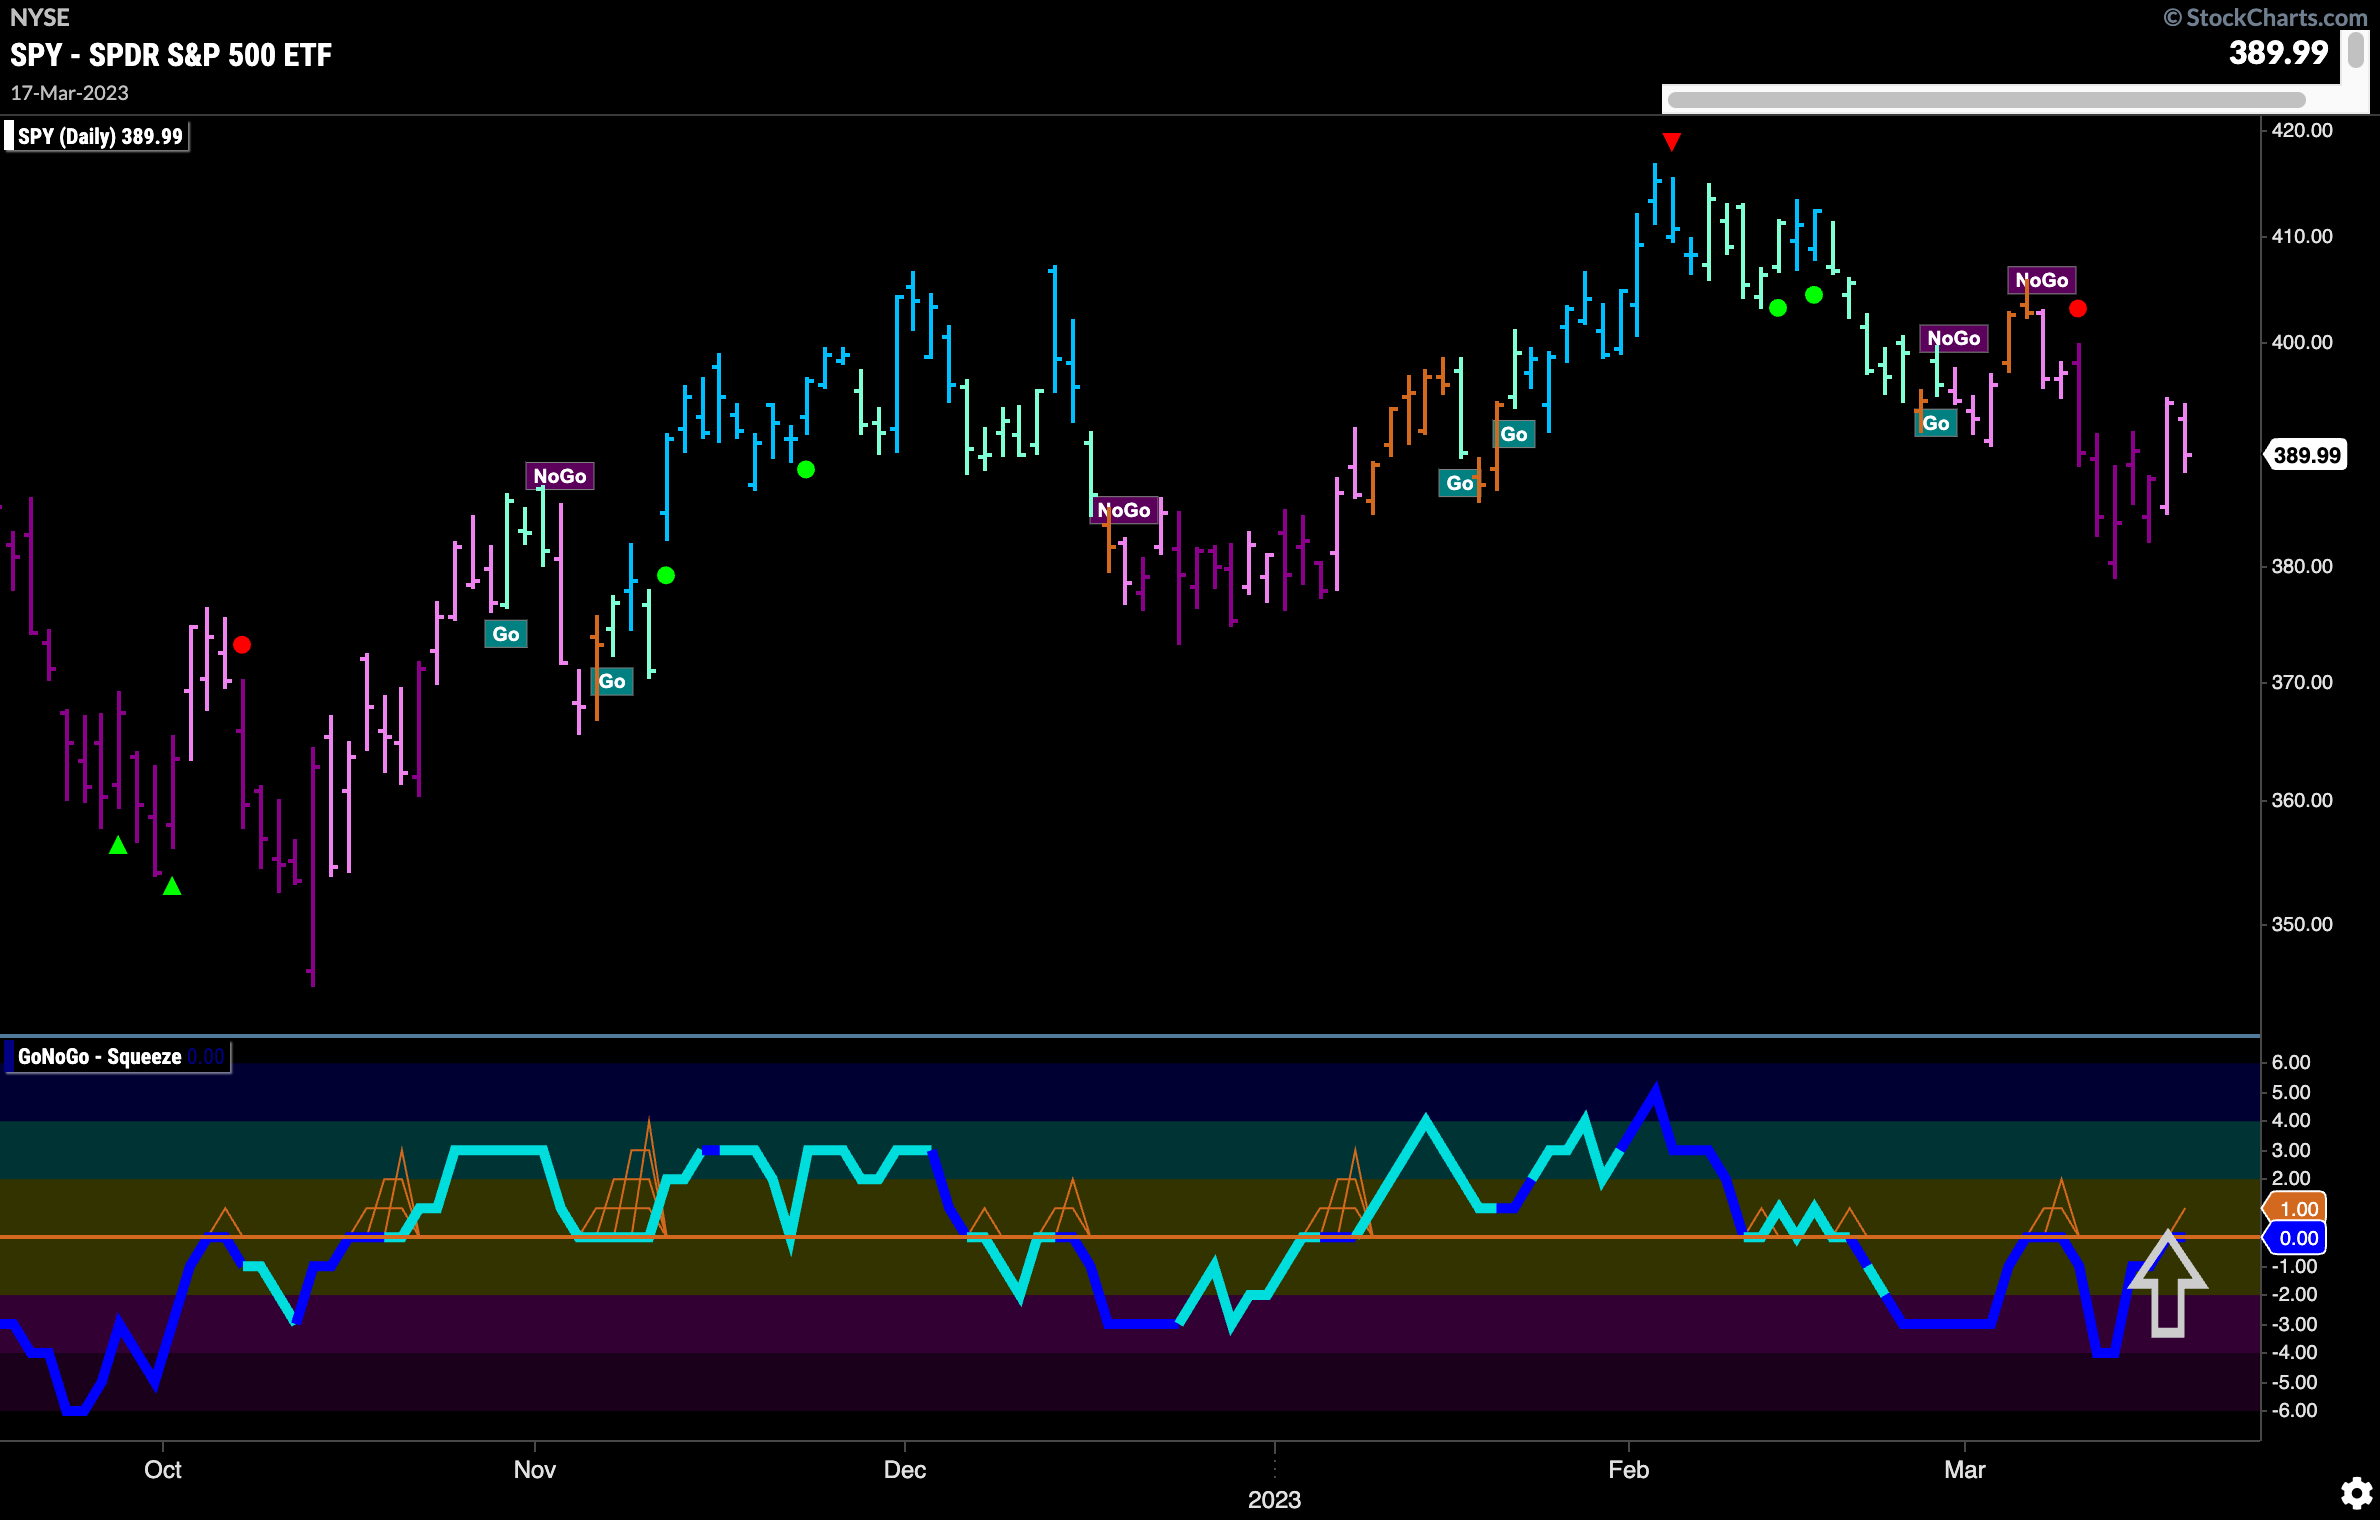
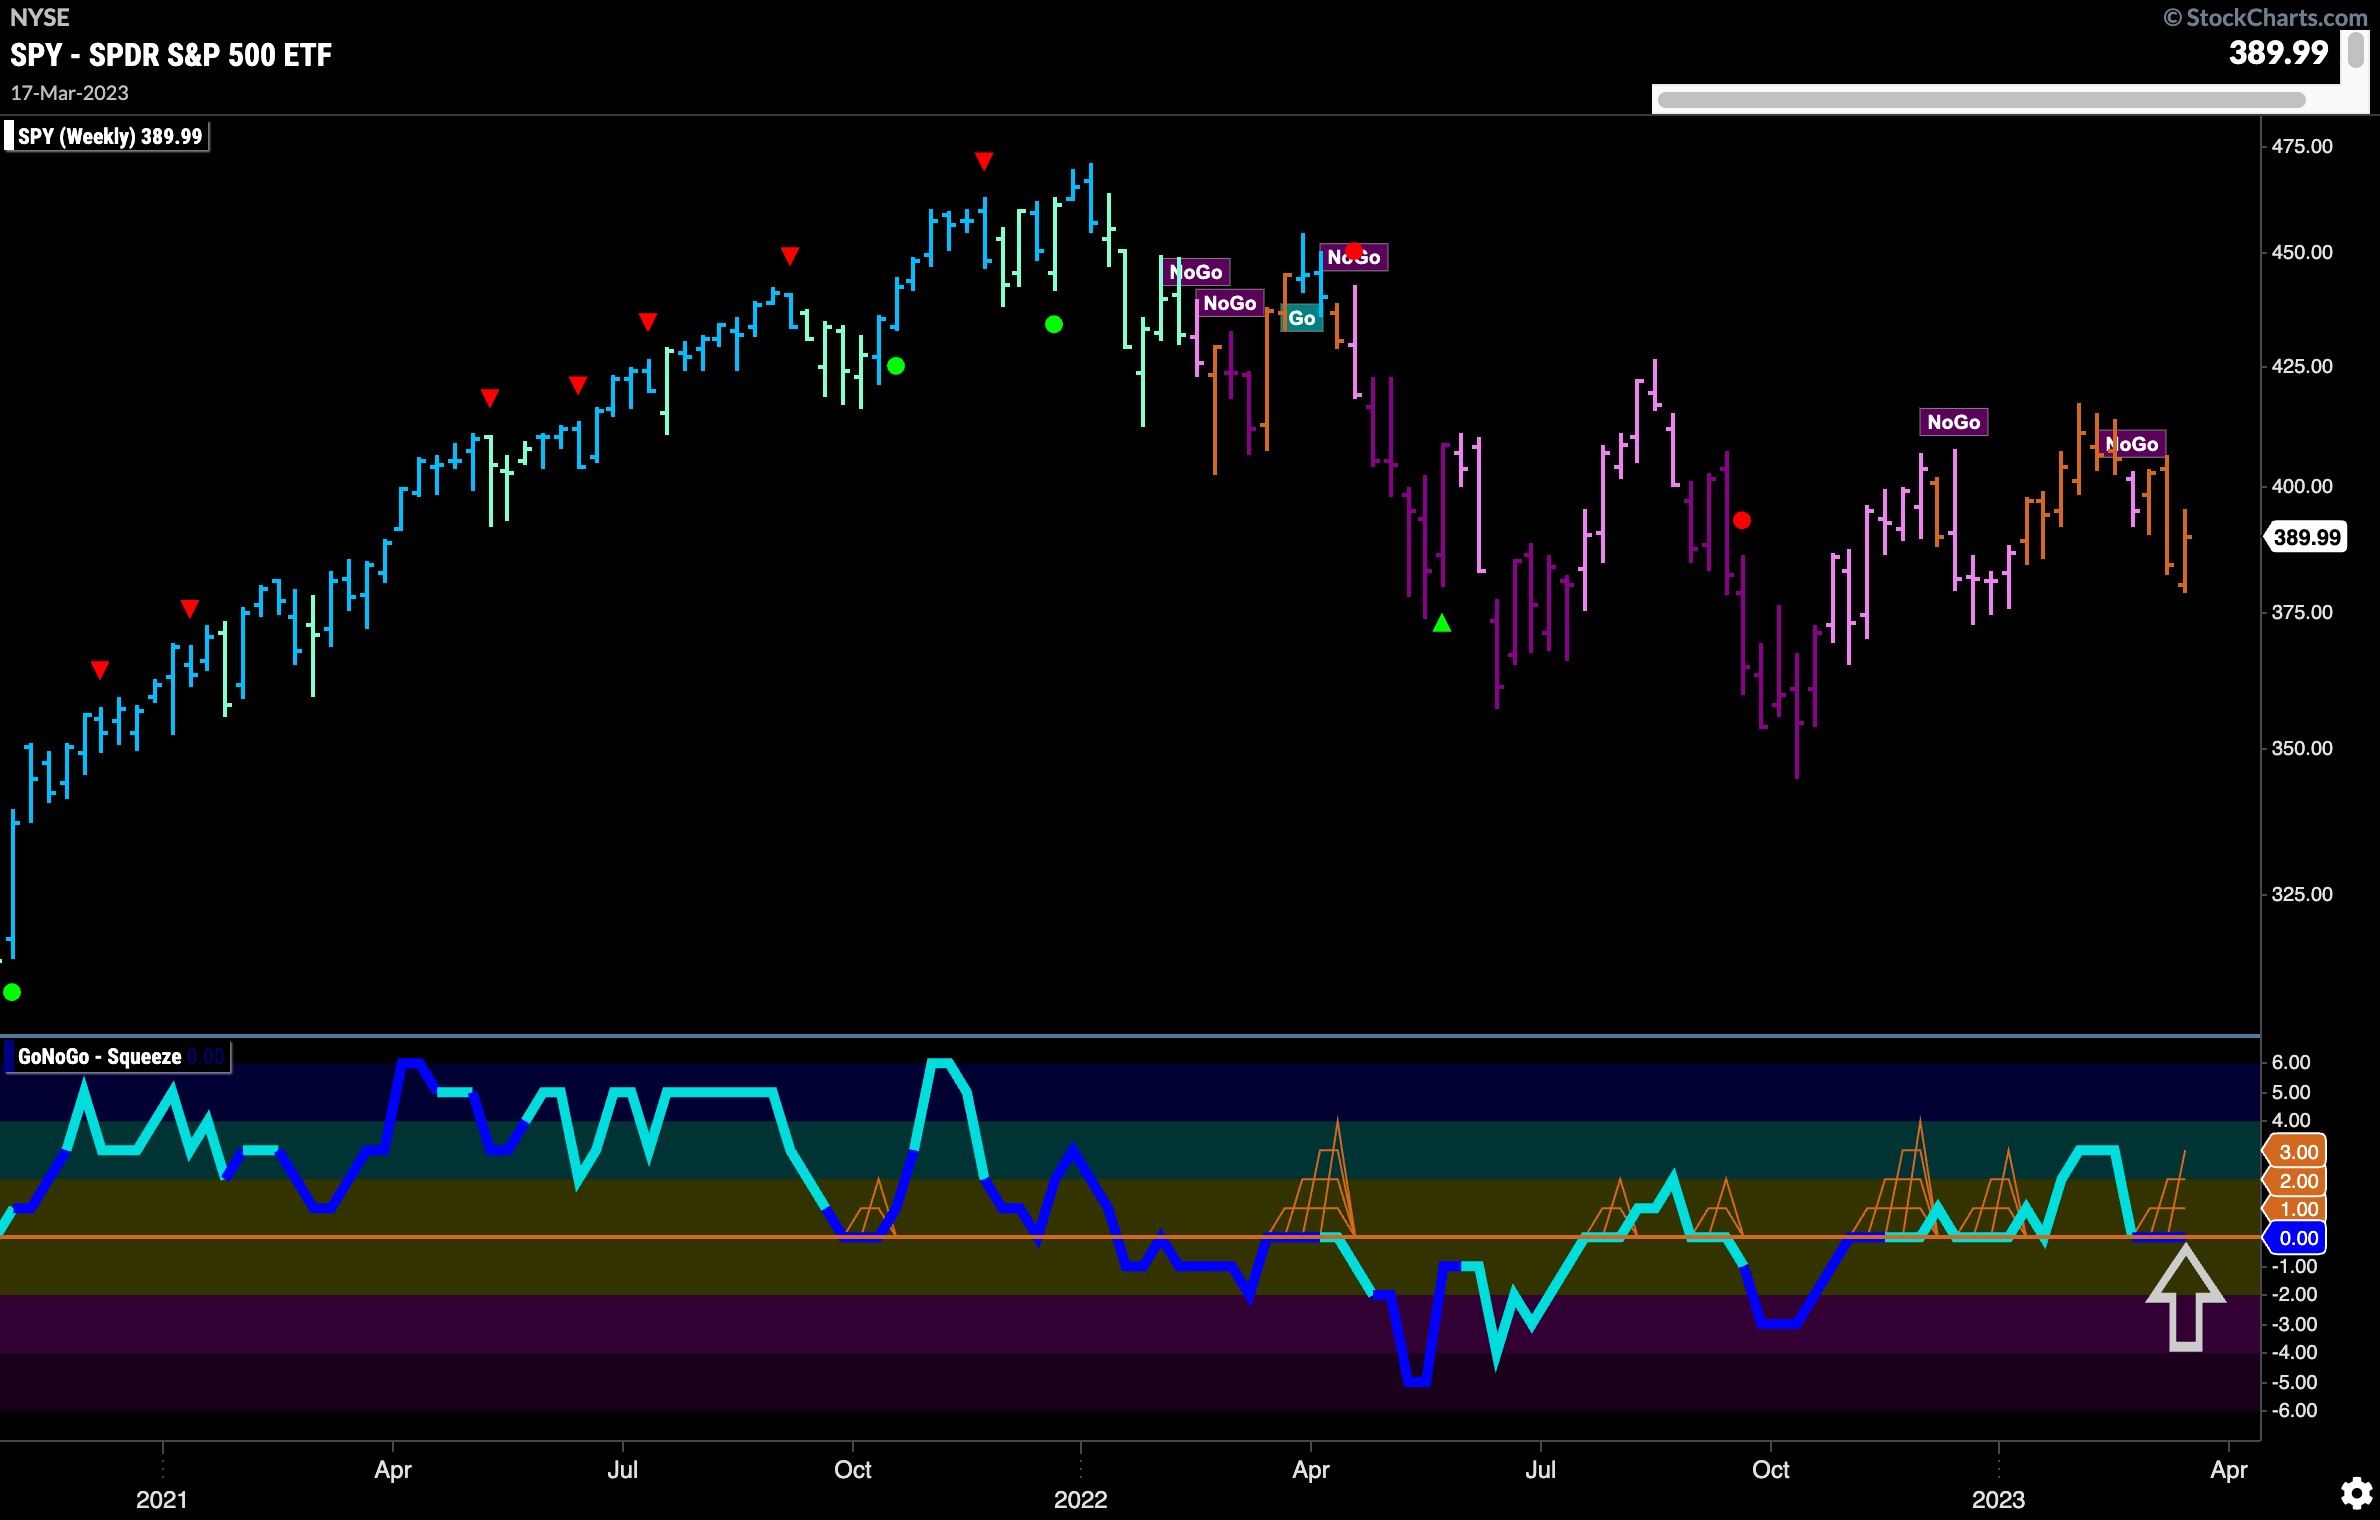
Another amber bar this week as price direction remains uncertain. GoNoGo Oscillator remains stuck at the zero line where we are seeing the beginnings of a GoNoGo Squeeze build. We will watch to see if we can find support here at this level. This would be constructive if the oscillator can again rally into positive territory.
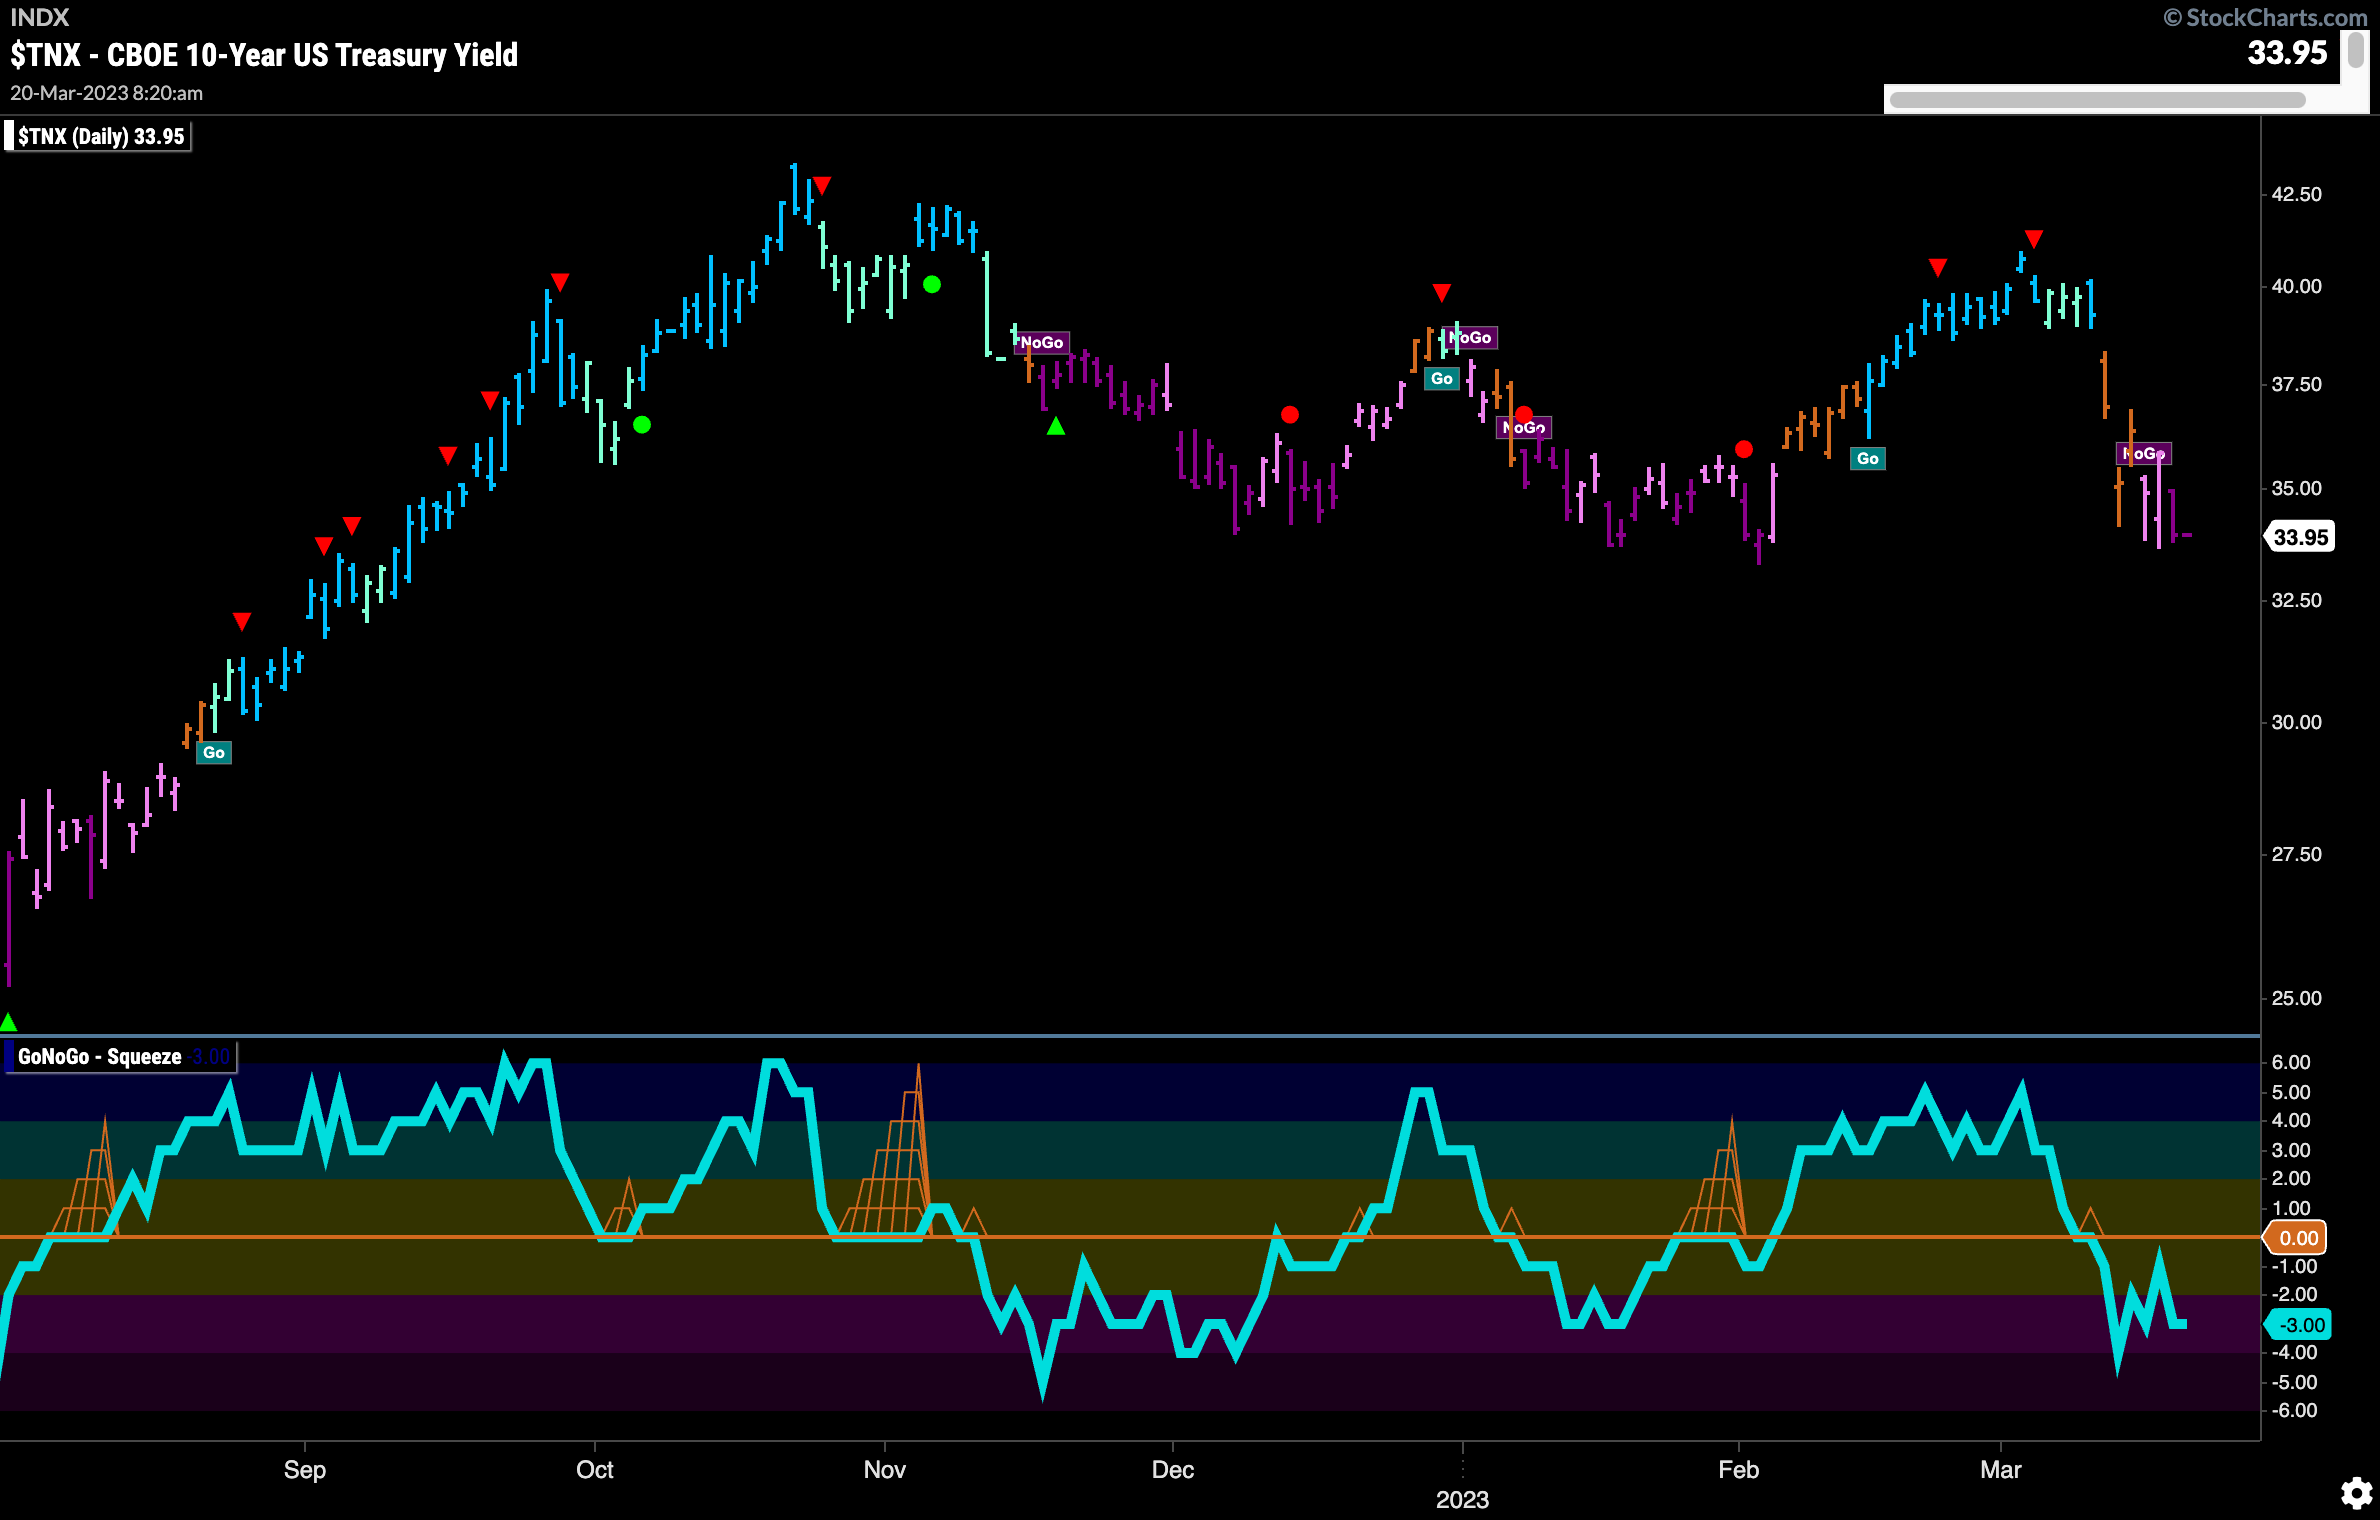
Treasury Rates Enter NoGo
After falling precariously a week ago GoNoGo Showed that price entered a “NoGo” trend and by the end of the week this had strengthened as the indicator paints strong purple “NoGo” bars. We are looking at natural levels of support from prior lows and so we will watch to see if price finds some stability here. GoNoGo Oscillator is in negative territory but not yet oversold.
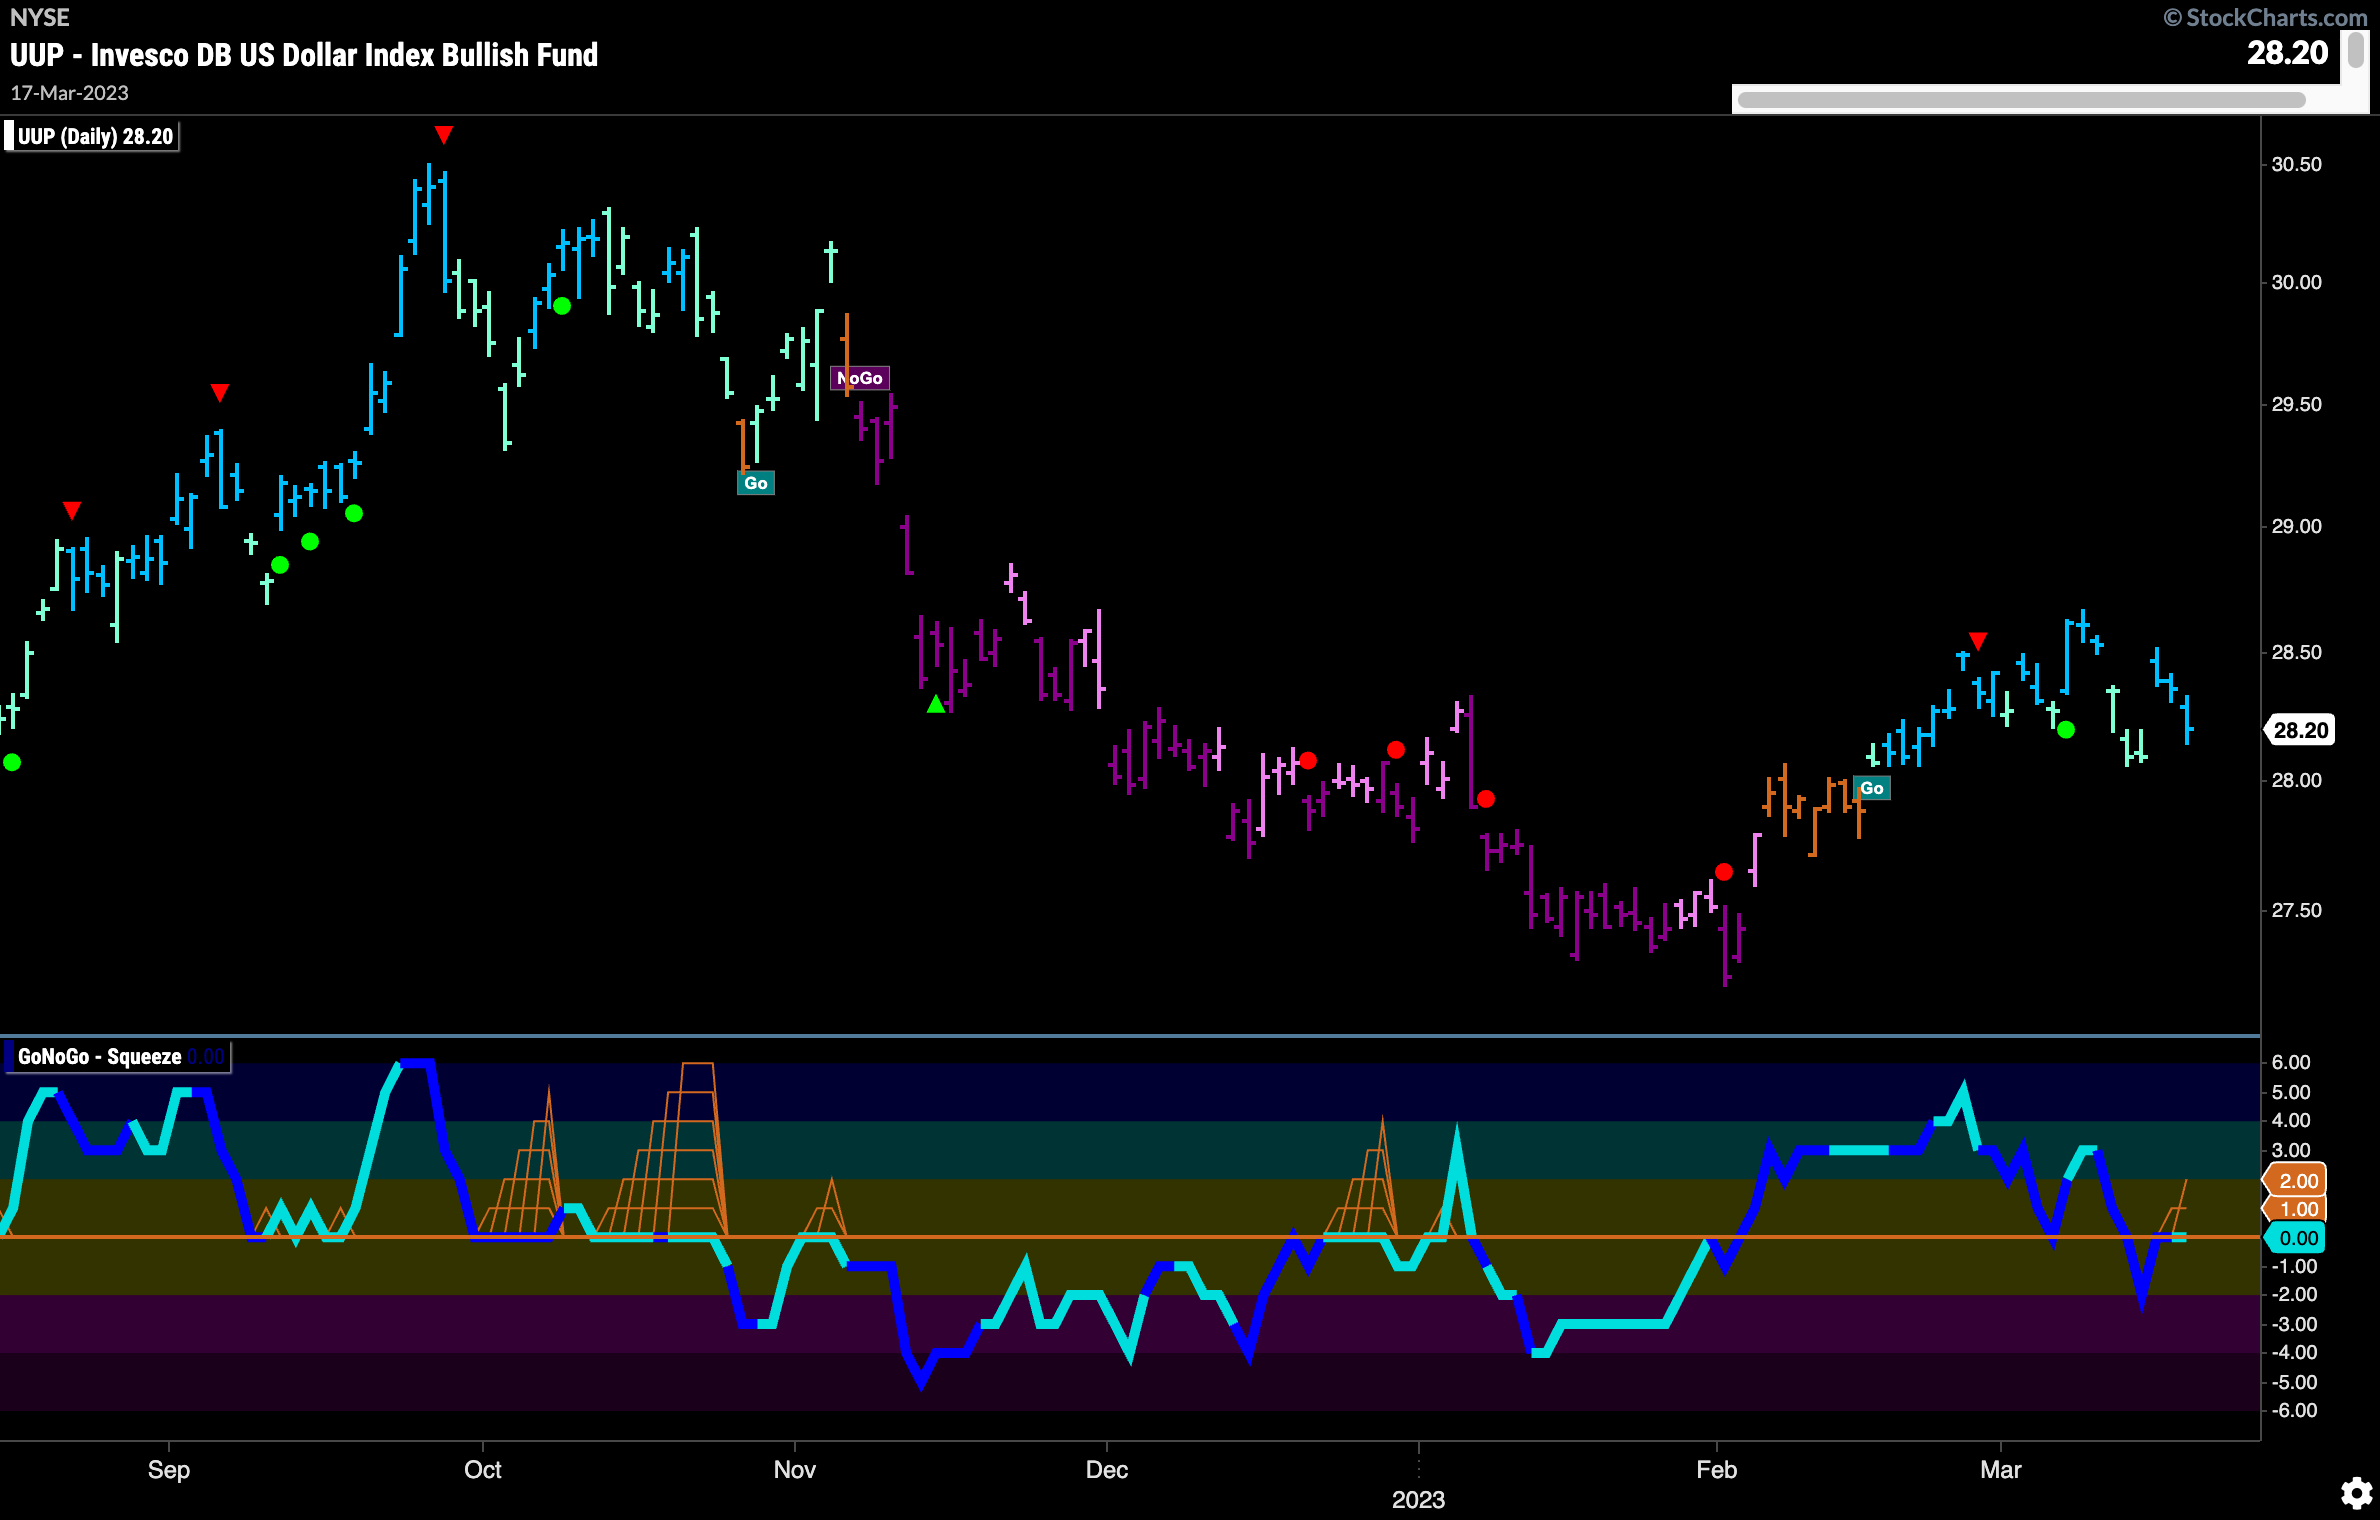
Dollar Sees Strong Go bars
After last week’s dragonfly Doji we saw price trend strengthen which allowed GoNoGo Trend to paint strong blue bars later in the week. GoNoGo Oscillator is back at zero now and we will watch to see if this level can provide support for the oscillator. This would indicate positive momentum allowing the trend to continue.
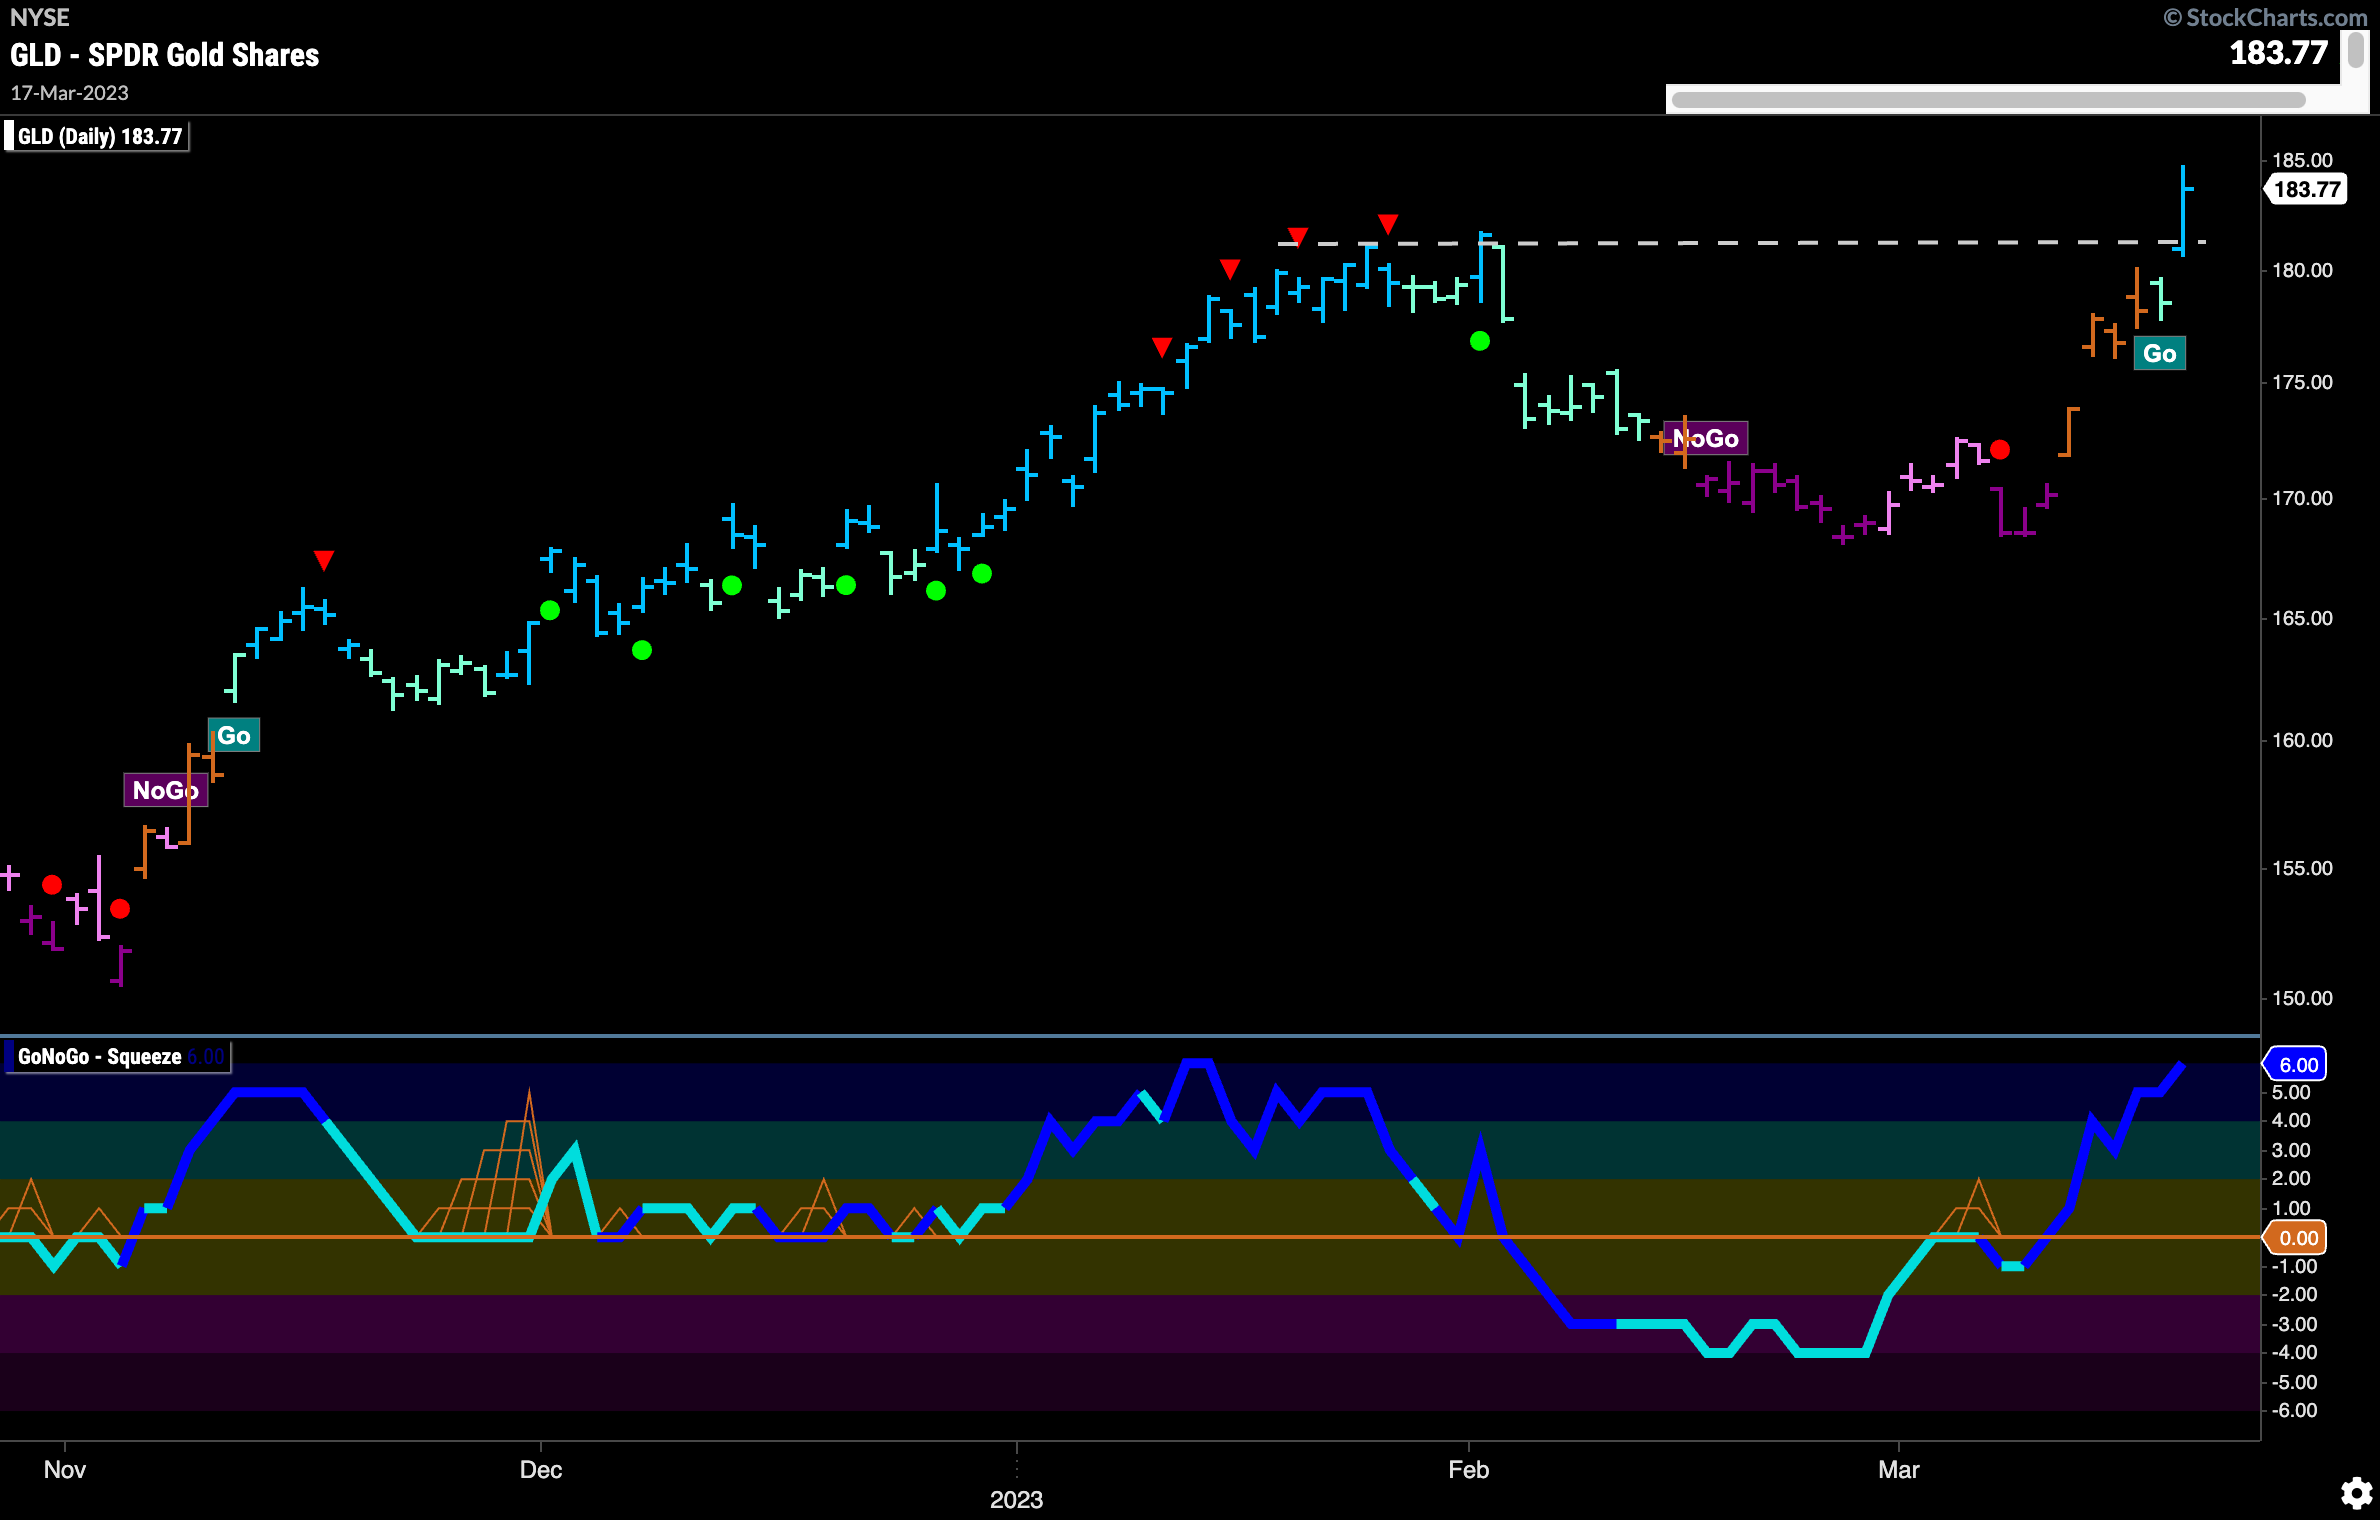
Gold Soars above Prior Highs
Gold blew through what could have been resistance levels from the gap and then raced to set a new high on Friday. The trend is now a “Go” with the indicator painting a strong blue bar. GoNoGo Oscillator is overbought and volume is heavy. We will watch to see if there is any pullback which would be signaled by a Go Countertrend Correction Icon (red arrow).
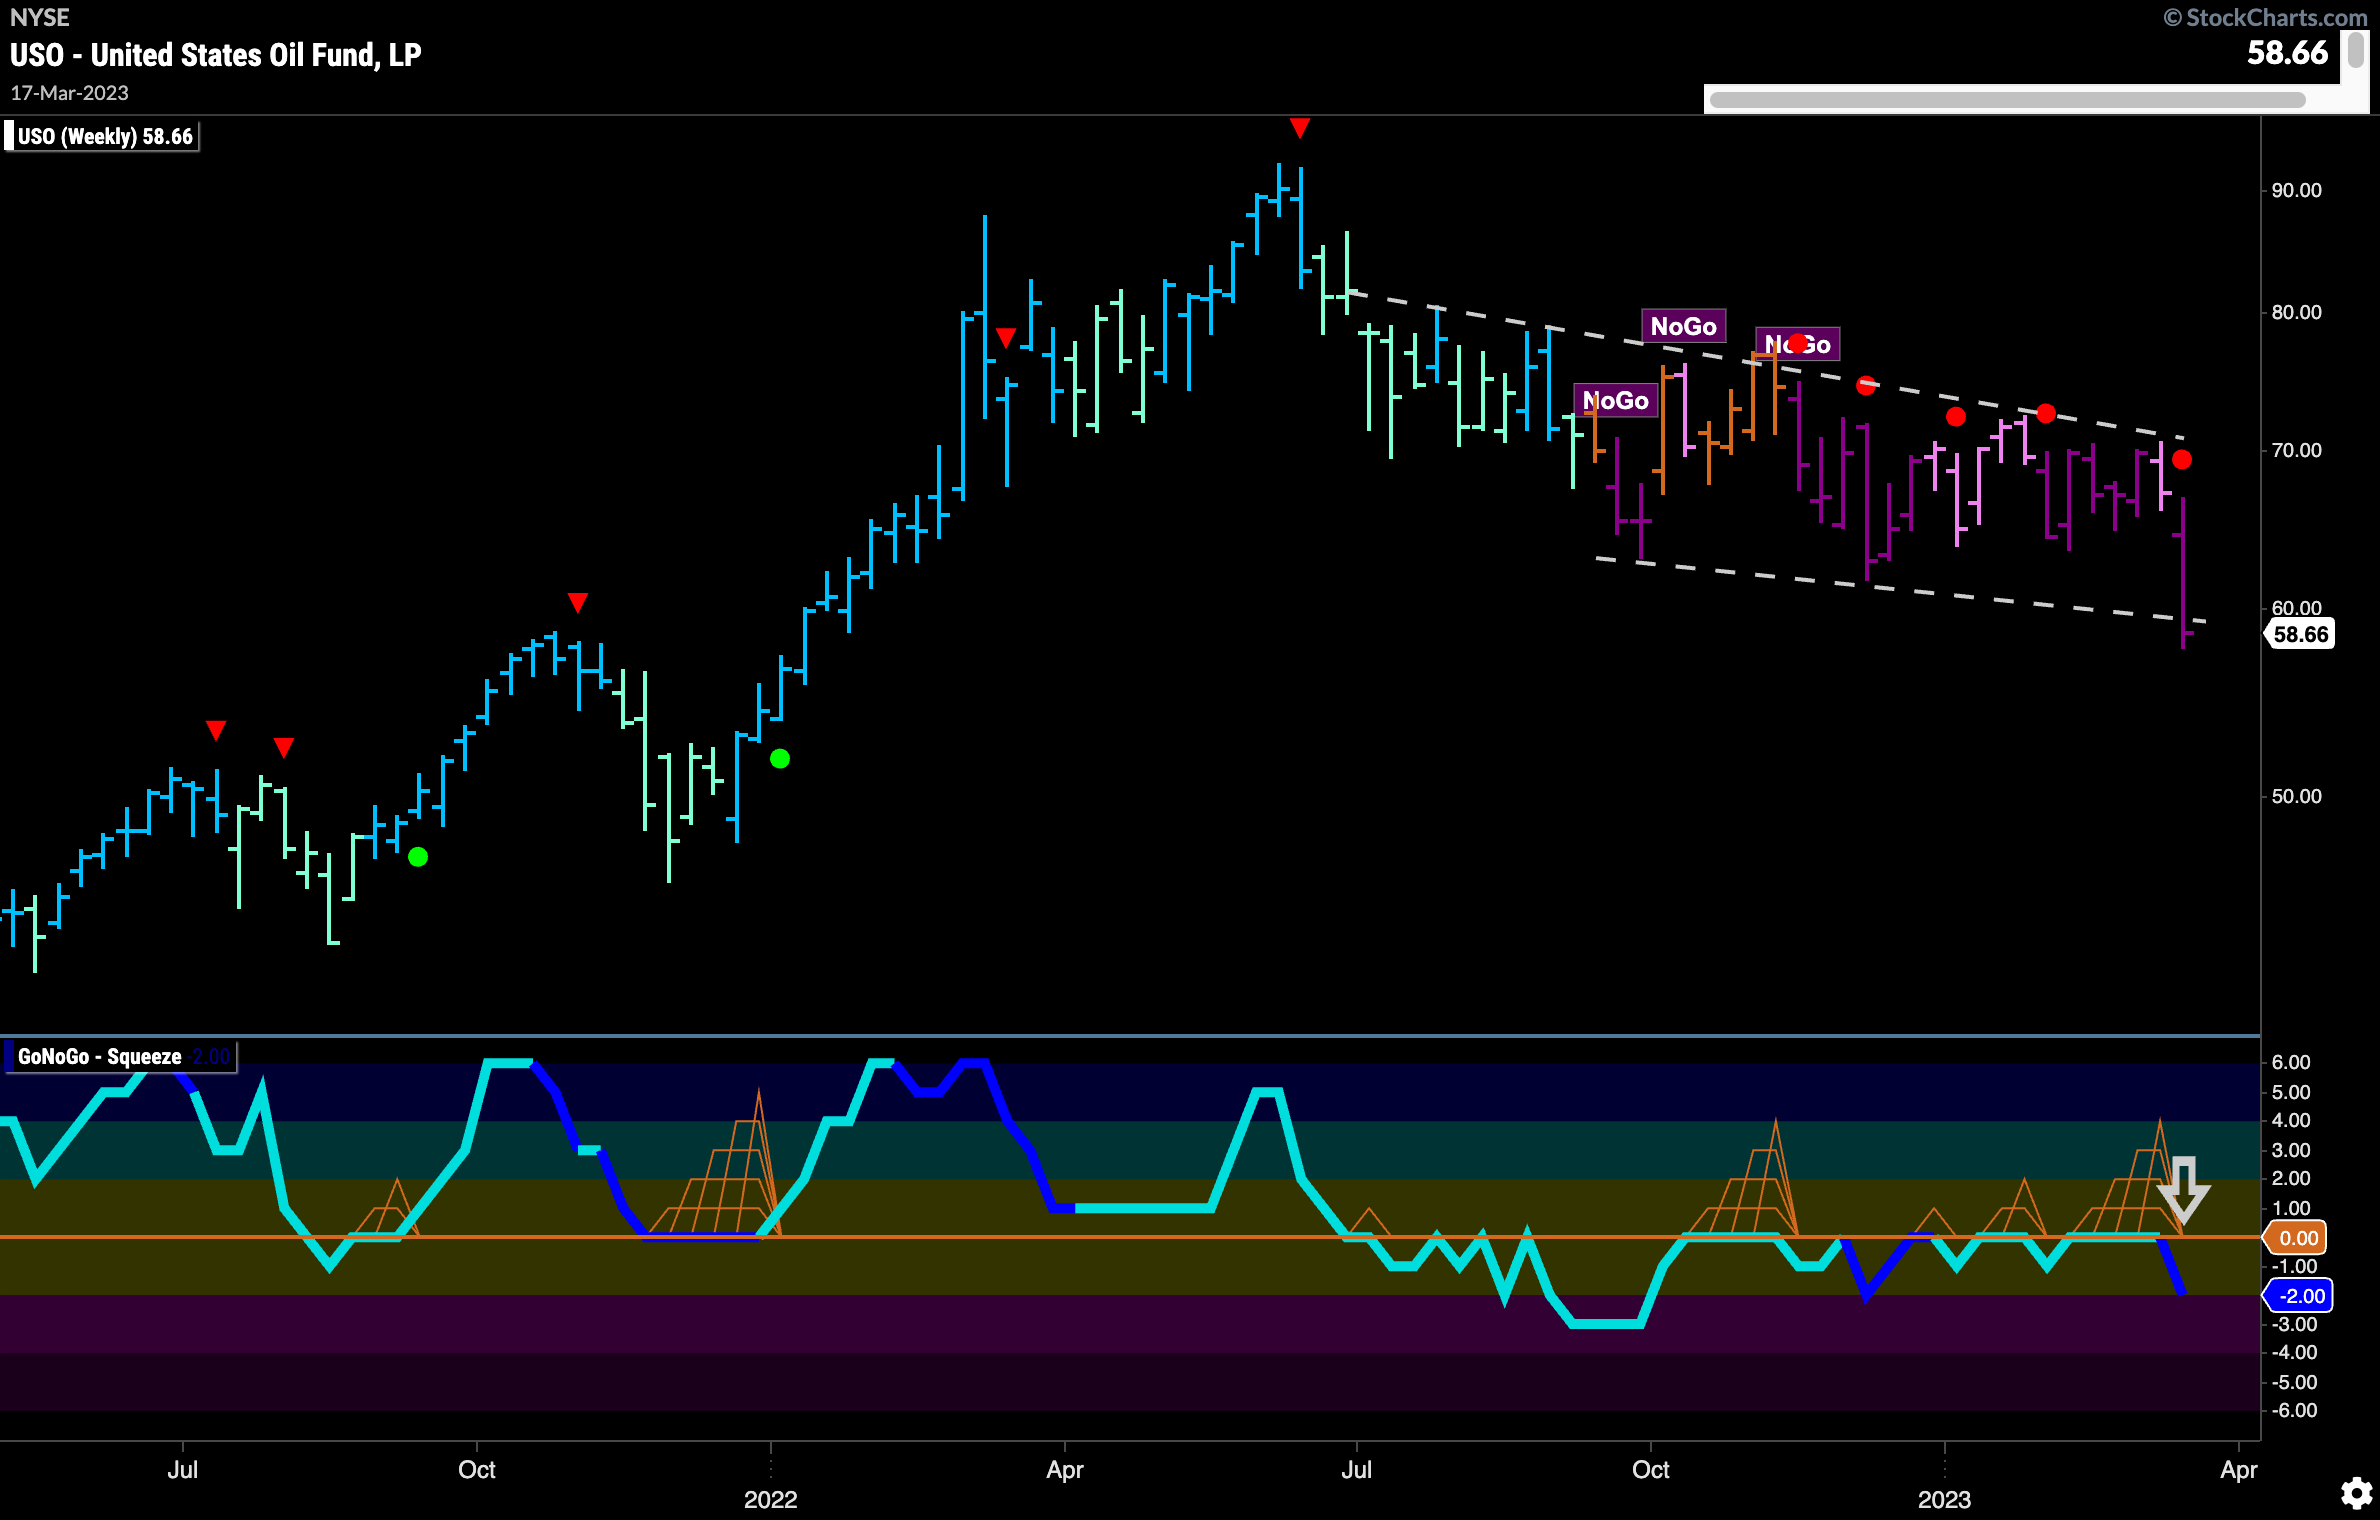
Oil Remains Locked in Slow Moving “NoGo”
$USO showed its true colors again this week and they are still “NoGo” colors. A strong purple bar brought price right down to the lows of the downward sloping channel that we have been monitoring. GoNoGo Oscillator looks to have been turned away by the zero line again and on heavy volume this time out of a small GoNoGo Squeeze. We will continue to look for downward price action.
 Sector RelMap
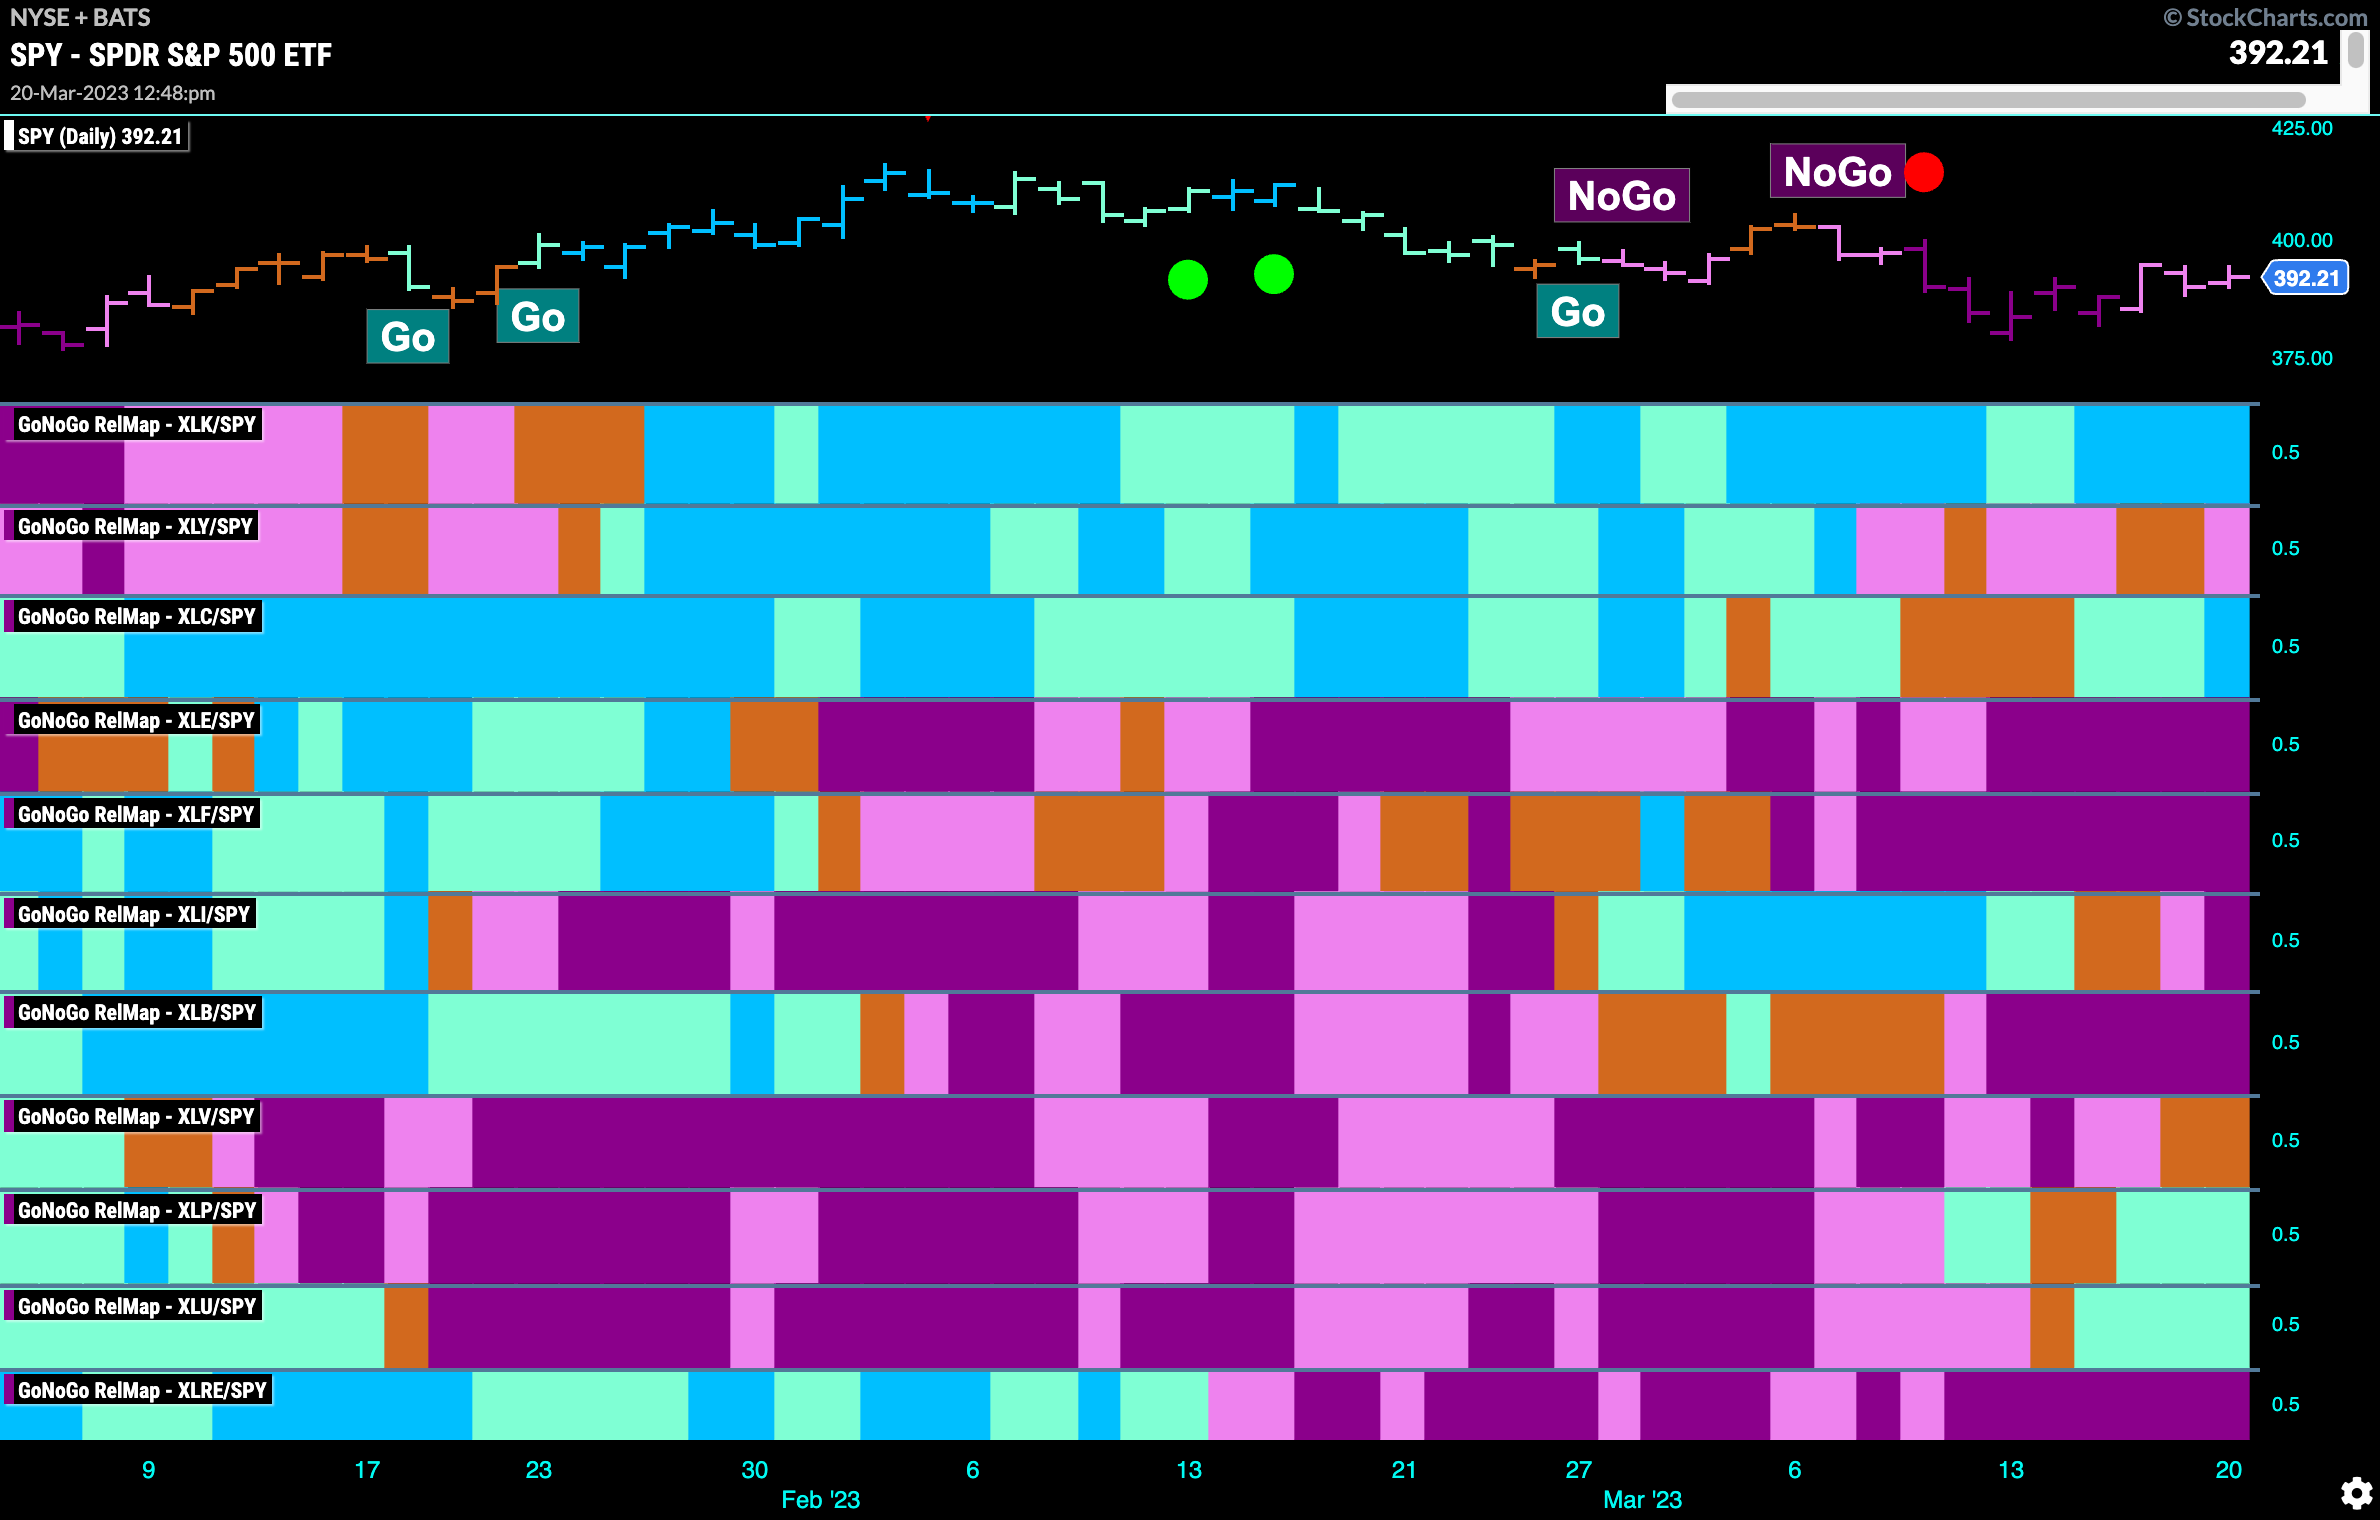
Below is the GoNoGo Sector RelMap. This GoNoGo RelMap applies the GoNoGo Trend to the relative strength ratios of the sectors to the base index. Looking at this map, we can quickly see where the relative outperformance is coming from as well as which sectors are lagging on a relative basis. 4 sectors are outperforming the base this week. $XLK, $XLC, $XLP, and $XLU are painting “Go” bars.
Consumer Staples See Strength In Soft Drinks
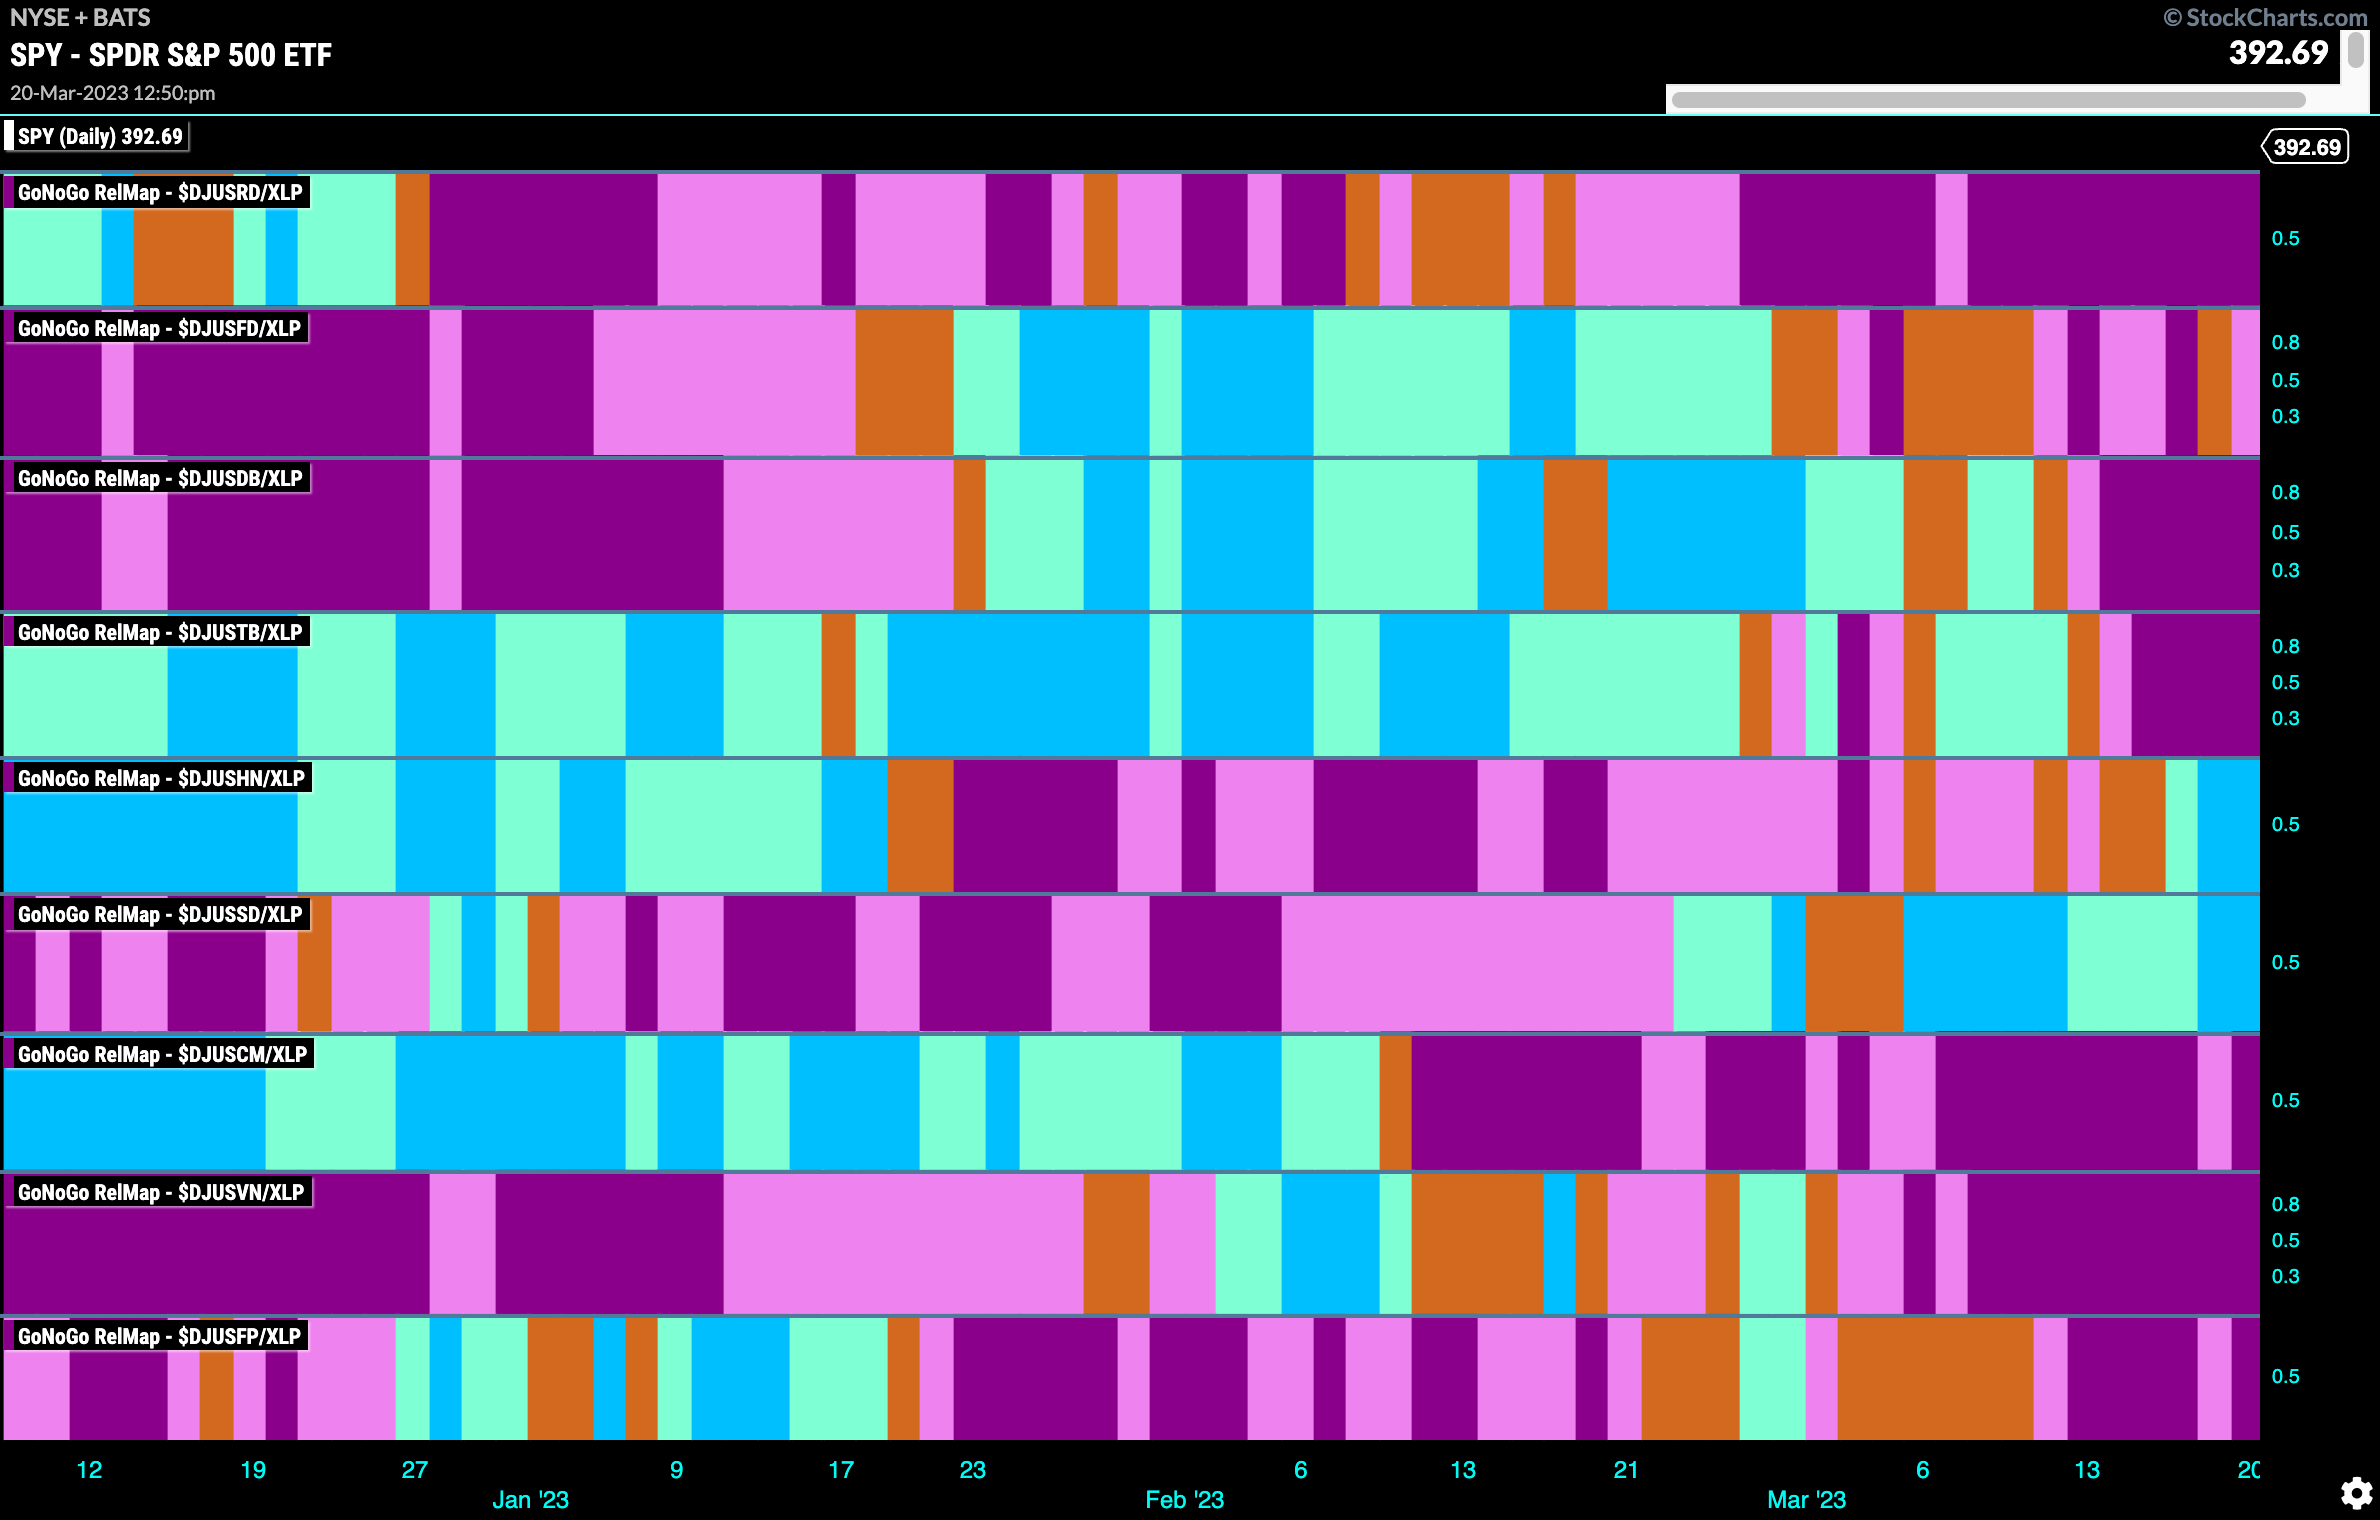
Diving deeper into the consumer staples sector, we can take a look at the sub industry groups RelMap below. This allows us to see where the outperformance we saw in the staples sector is truly coming from. Interestingly, the most healthy “Go” trend on a relative basis to the $XLP is that of soft drinks. We can see that the 6th map panel has entered a “Go” trend and restrengthened last week.
Coca Cola Starting to Fizz
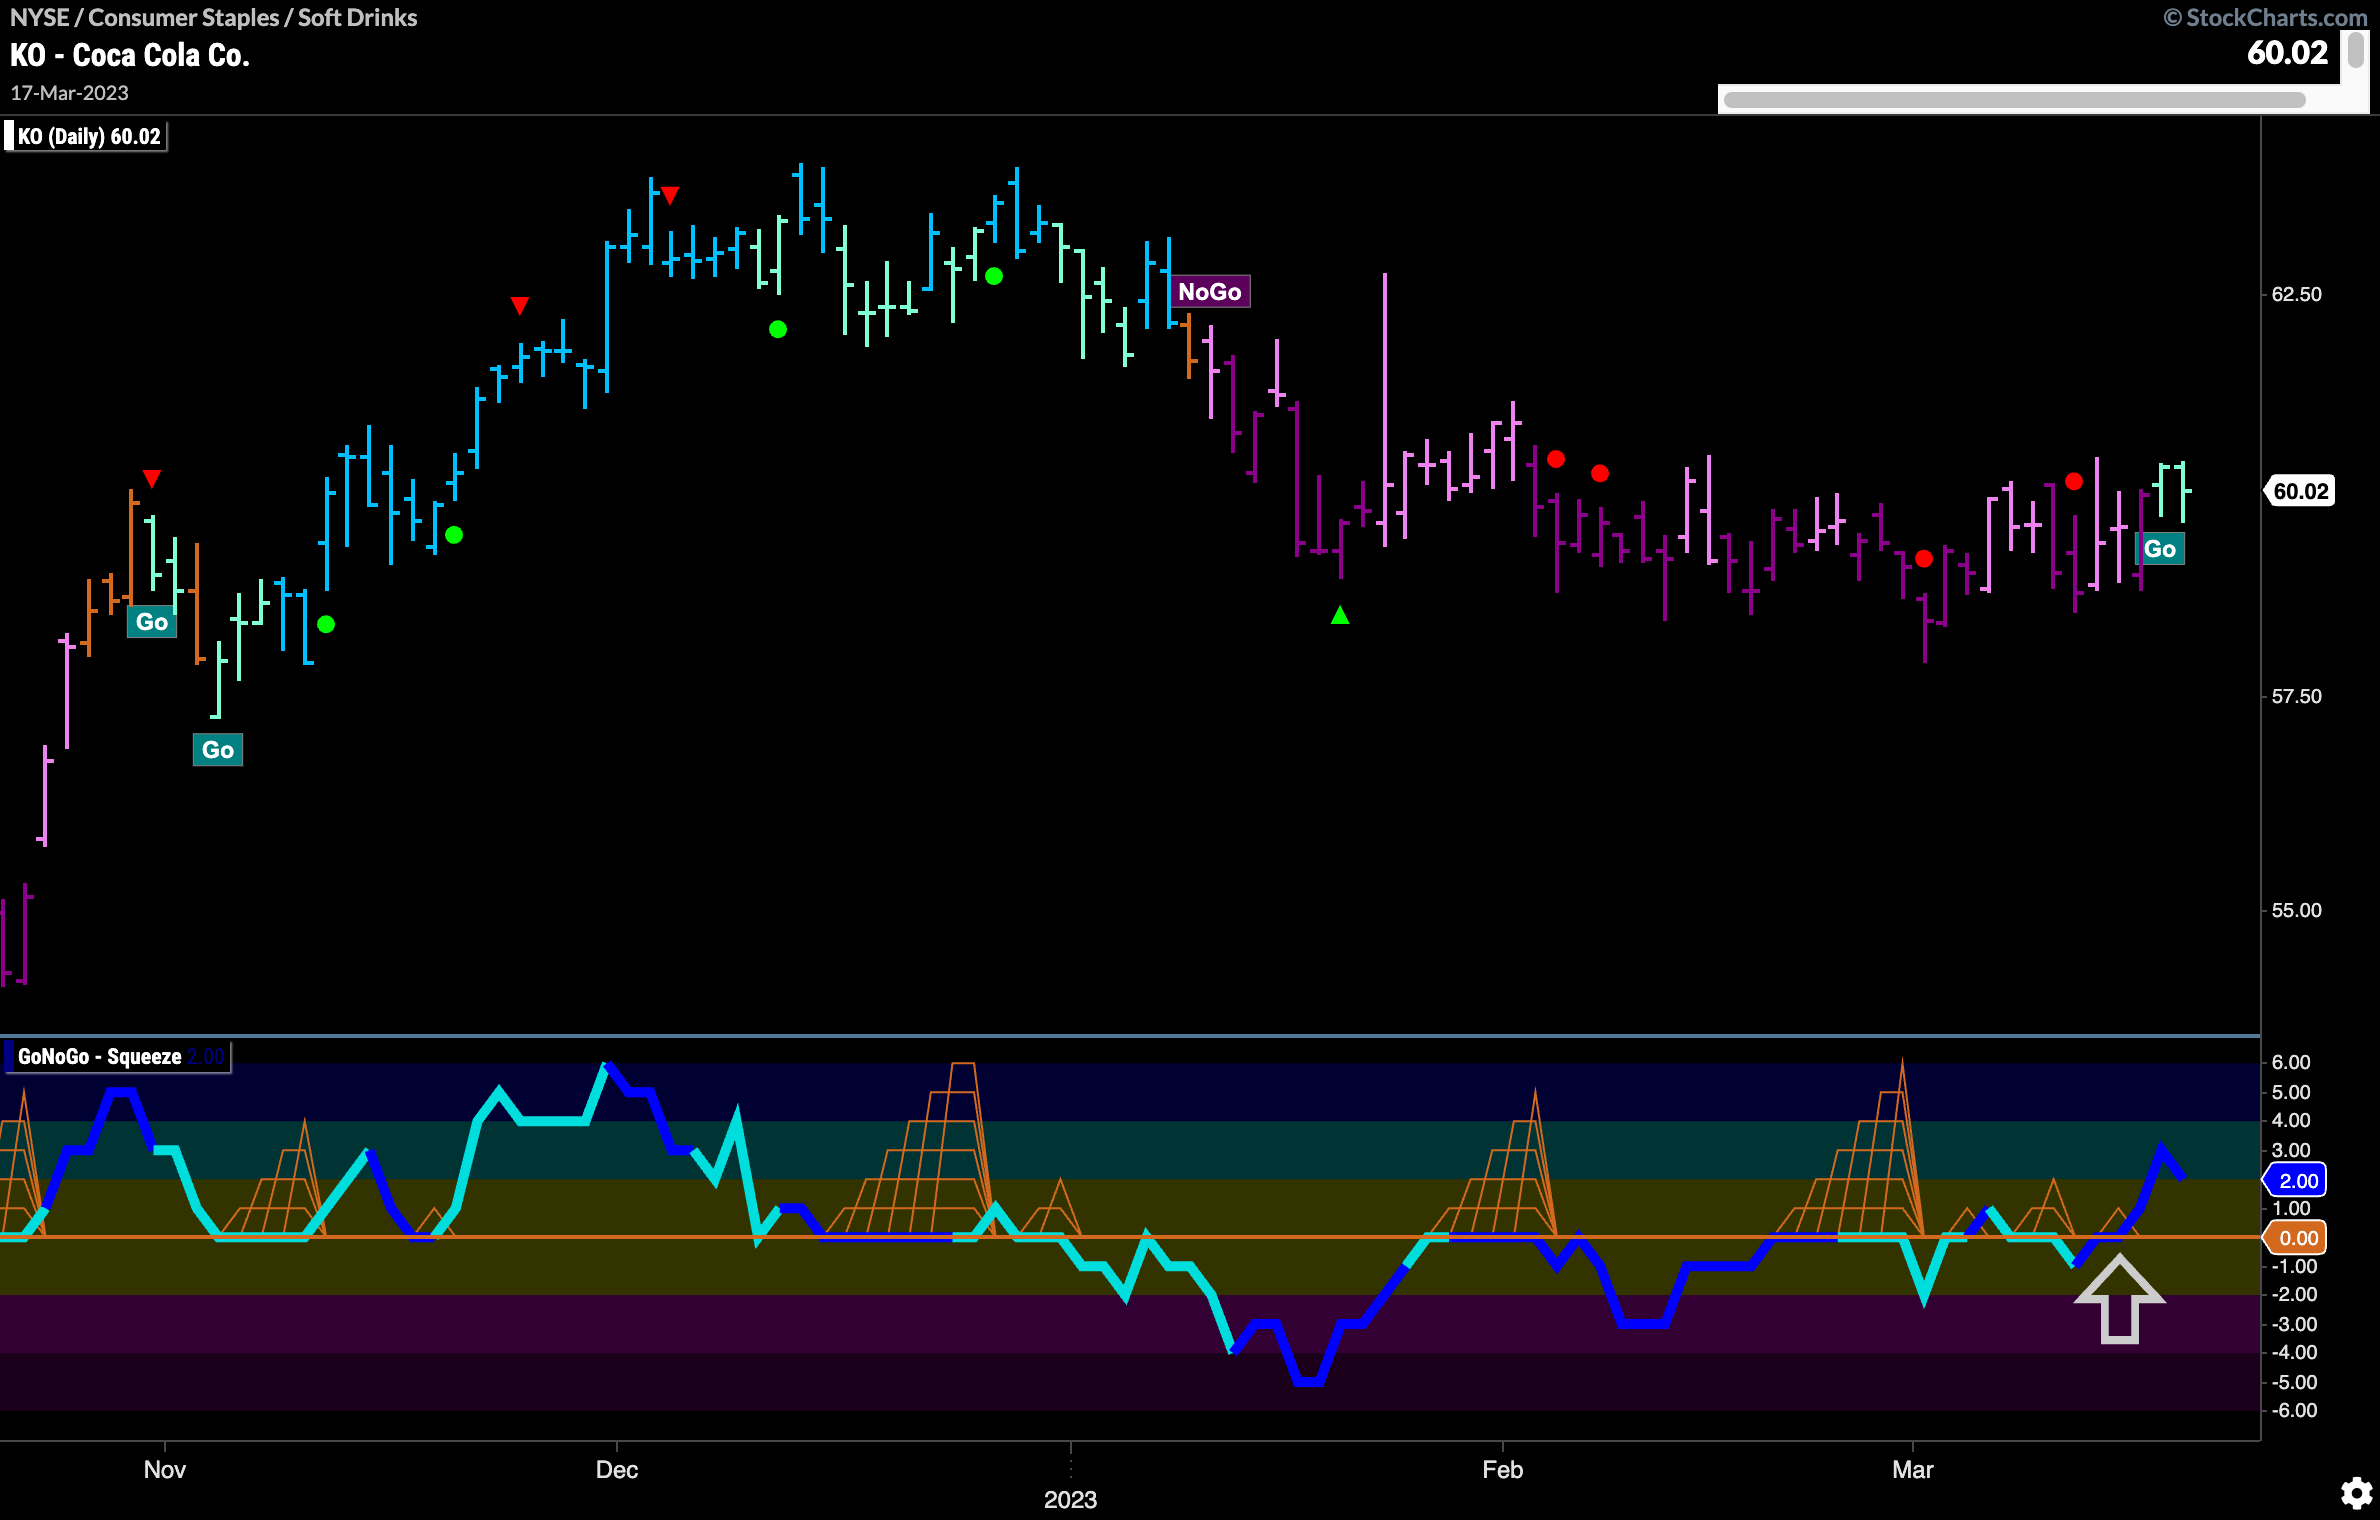
This chart shows the prices of Coca Cola Co. If the soft drink sub group has entered a relative “Go” trend to its sector and the staples sector itself is in a relative “Go” trend to the S&P 500 then we could really be “fishing where the fish are” if we look for a good chart of a single security in that space. We can see that for $KO, we have entered a new “Go” trend on a daily basis and that the GoNoGo Oscillator burst through the zero line into positive territory on heavy volume. Perhaps $KO will bubble to the top.
