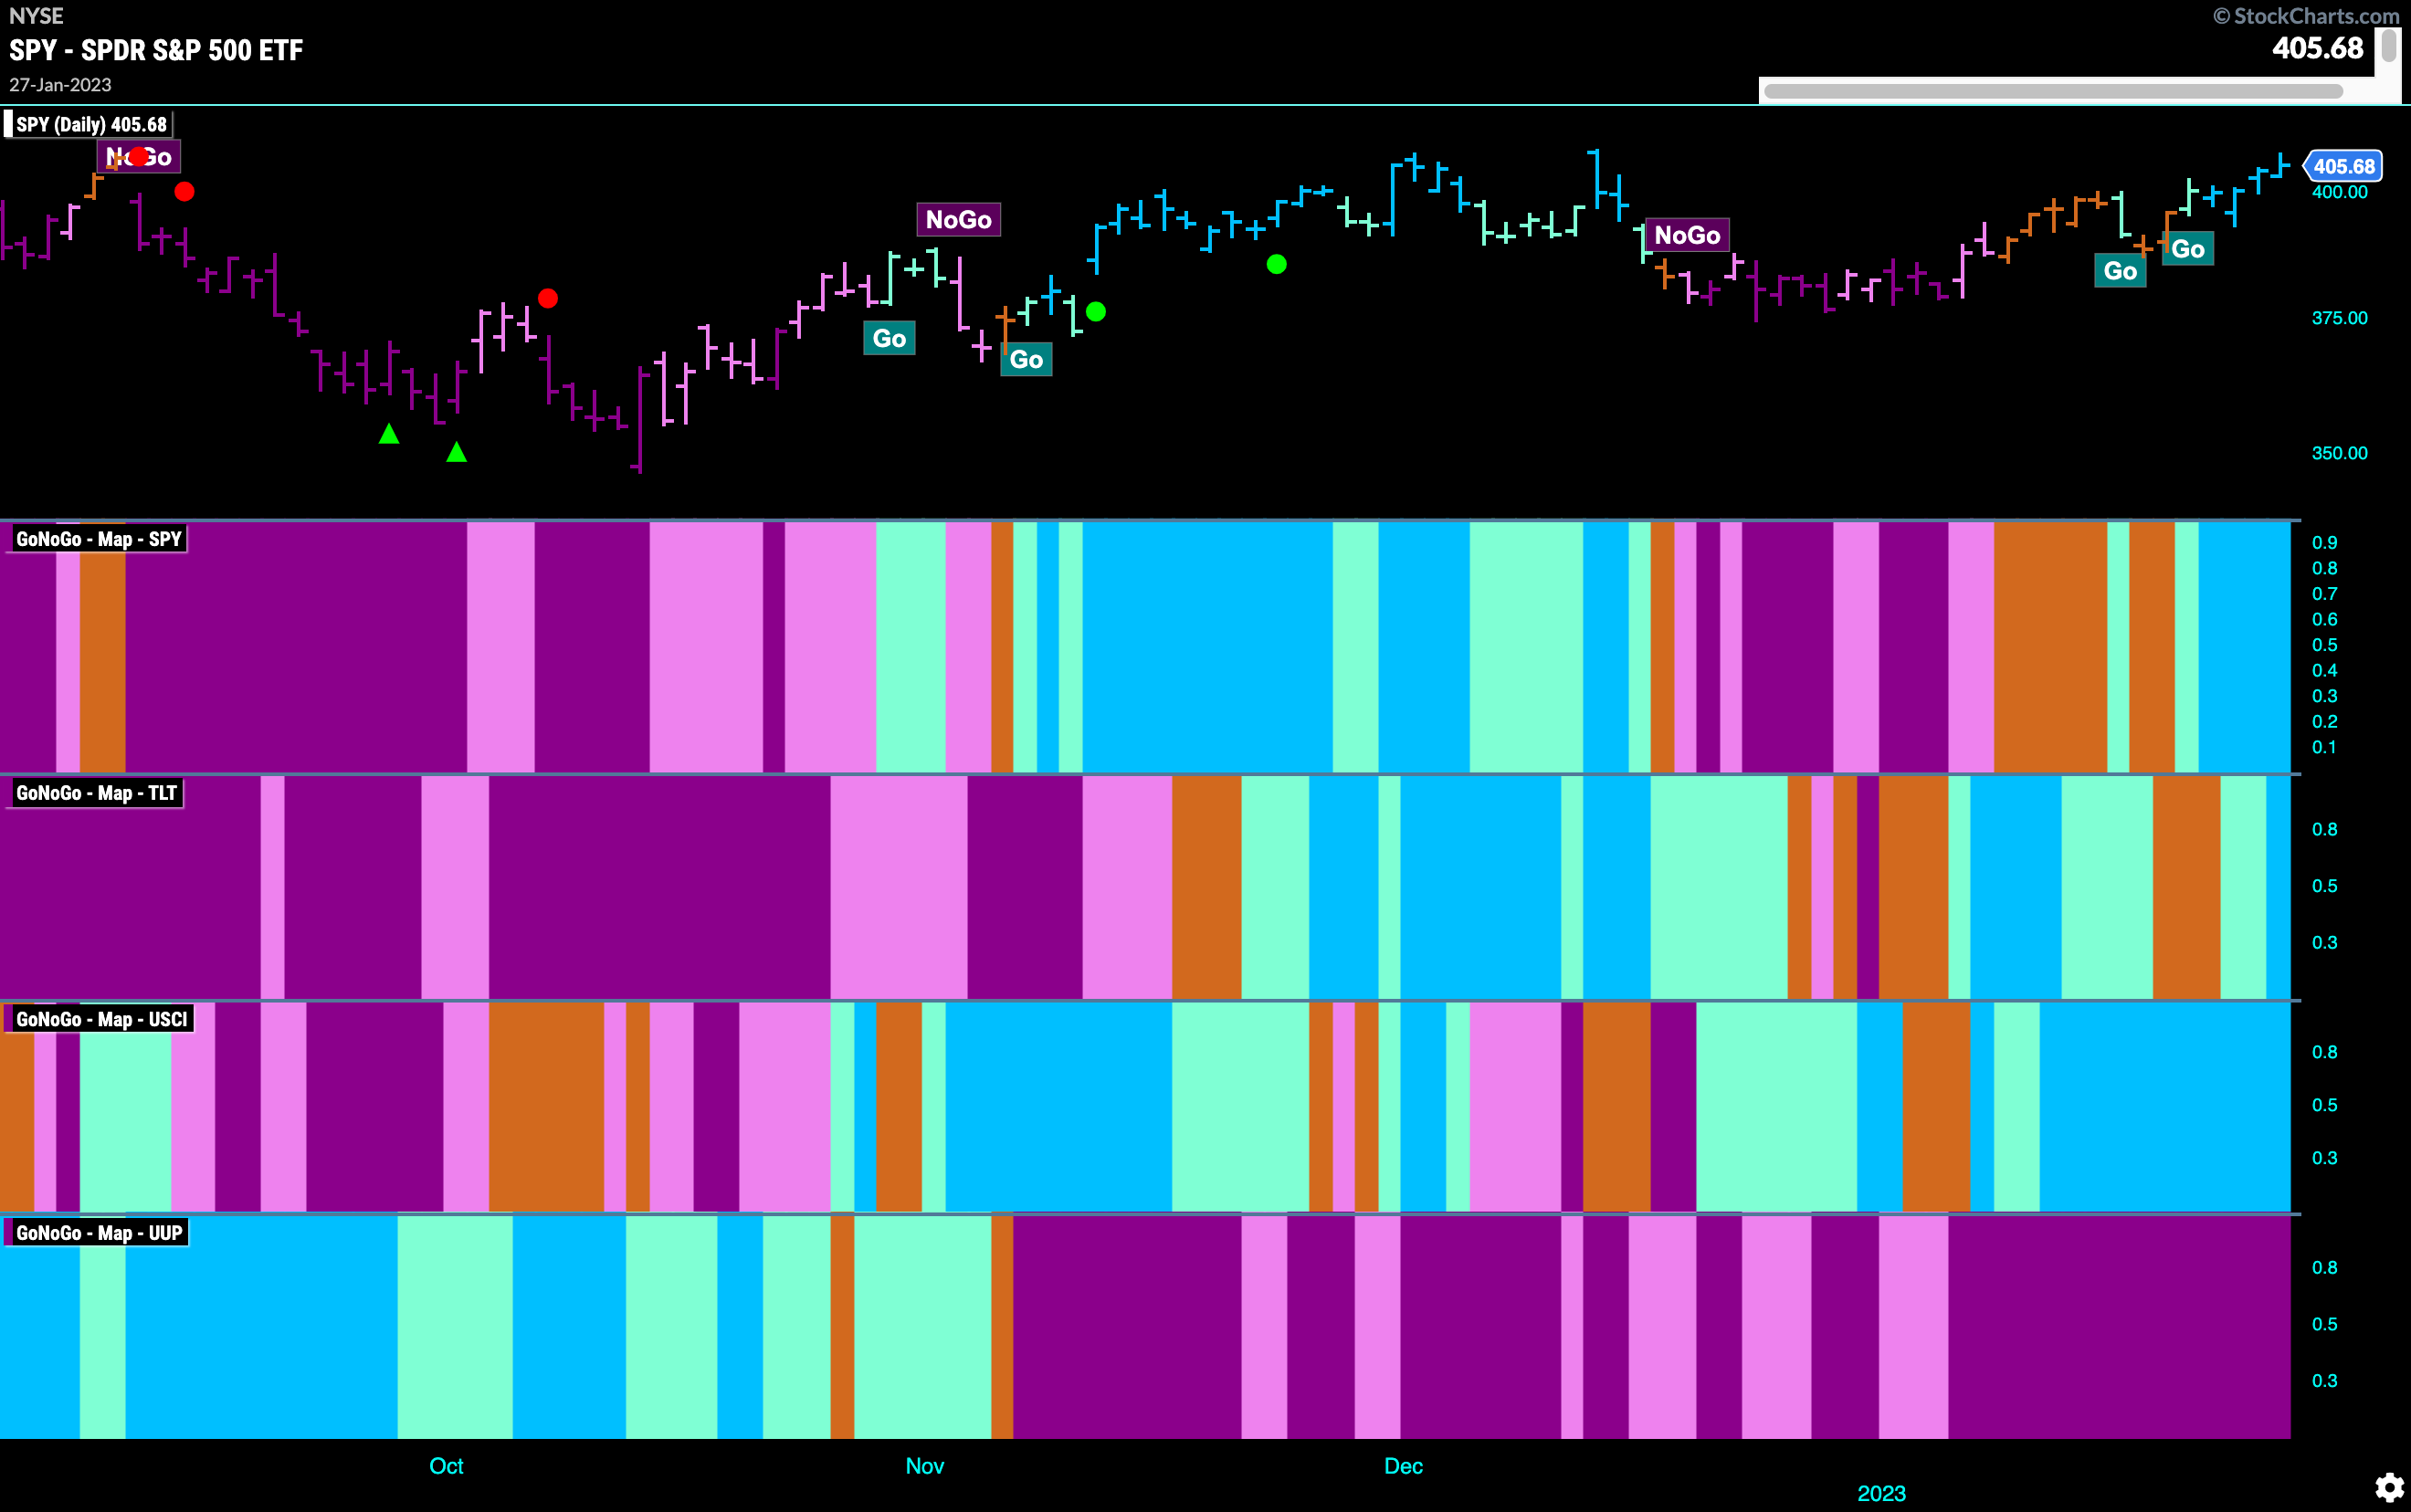
Good morning and welcome to this week’s Flight Path. Let’s take a look at the GoNoGo Asset map below. Equities were able to maintain a “Go” trend this week as we saw a string of strong blue bars. Treasury bond prices also remained in a “Go” and commodities went from strength to strength. The dollar continued to disappoint and painted a string of strong purple “NoGo” bars.
Equities Attempt to Set New Highs
GoNoGo Trend shows that the “Go” trend survived the week and we will watch closely this week as it tries to navigate resistance in the form of prior highs that we see on the chart. With several higher lows in place, there is a chance that price can move higher but we will need to watch. Likewise, GoNoGo Oscillator is trying to break into overbought territory for the first time this year. If it does, perhaps that will give price the push it needs to climb above resistance. 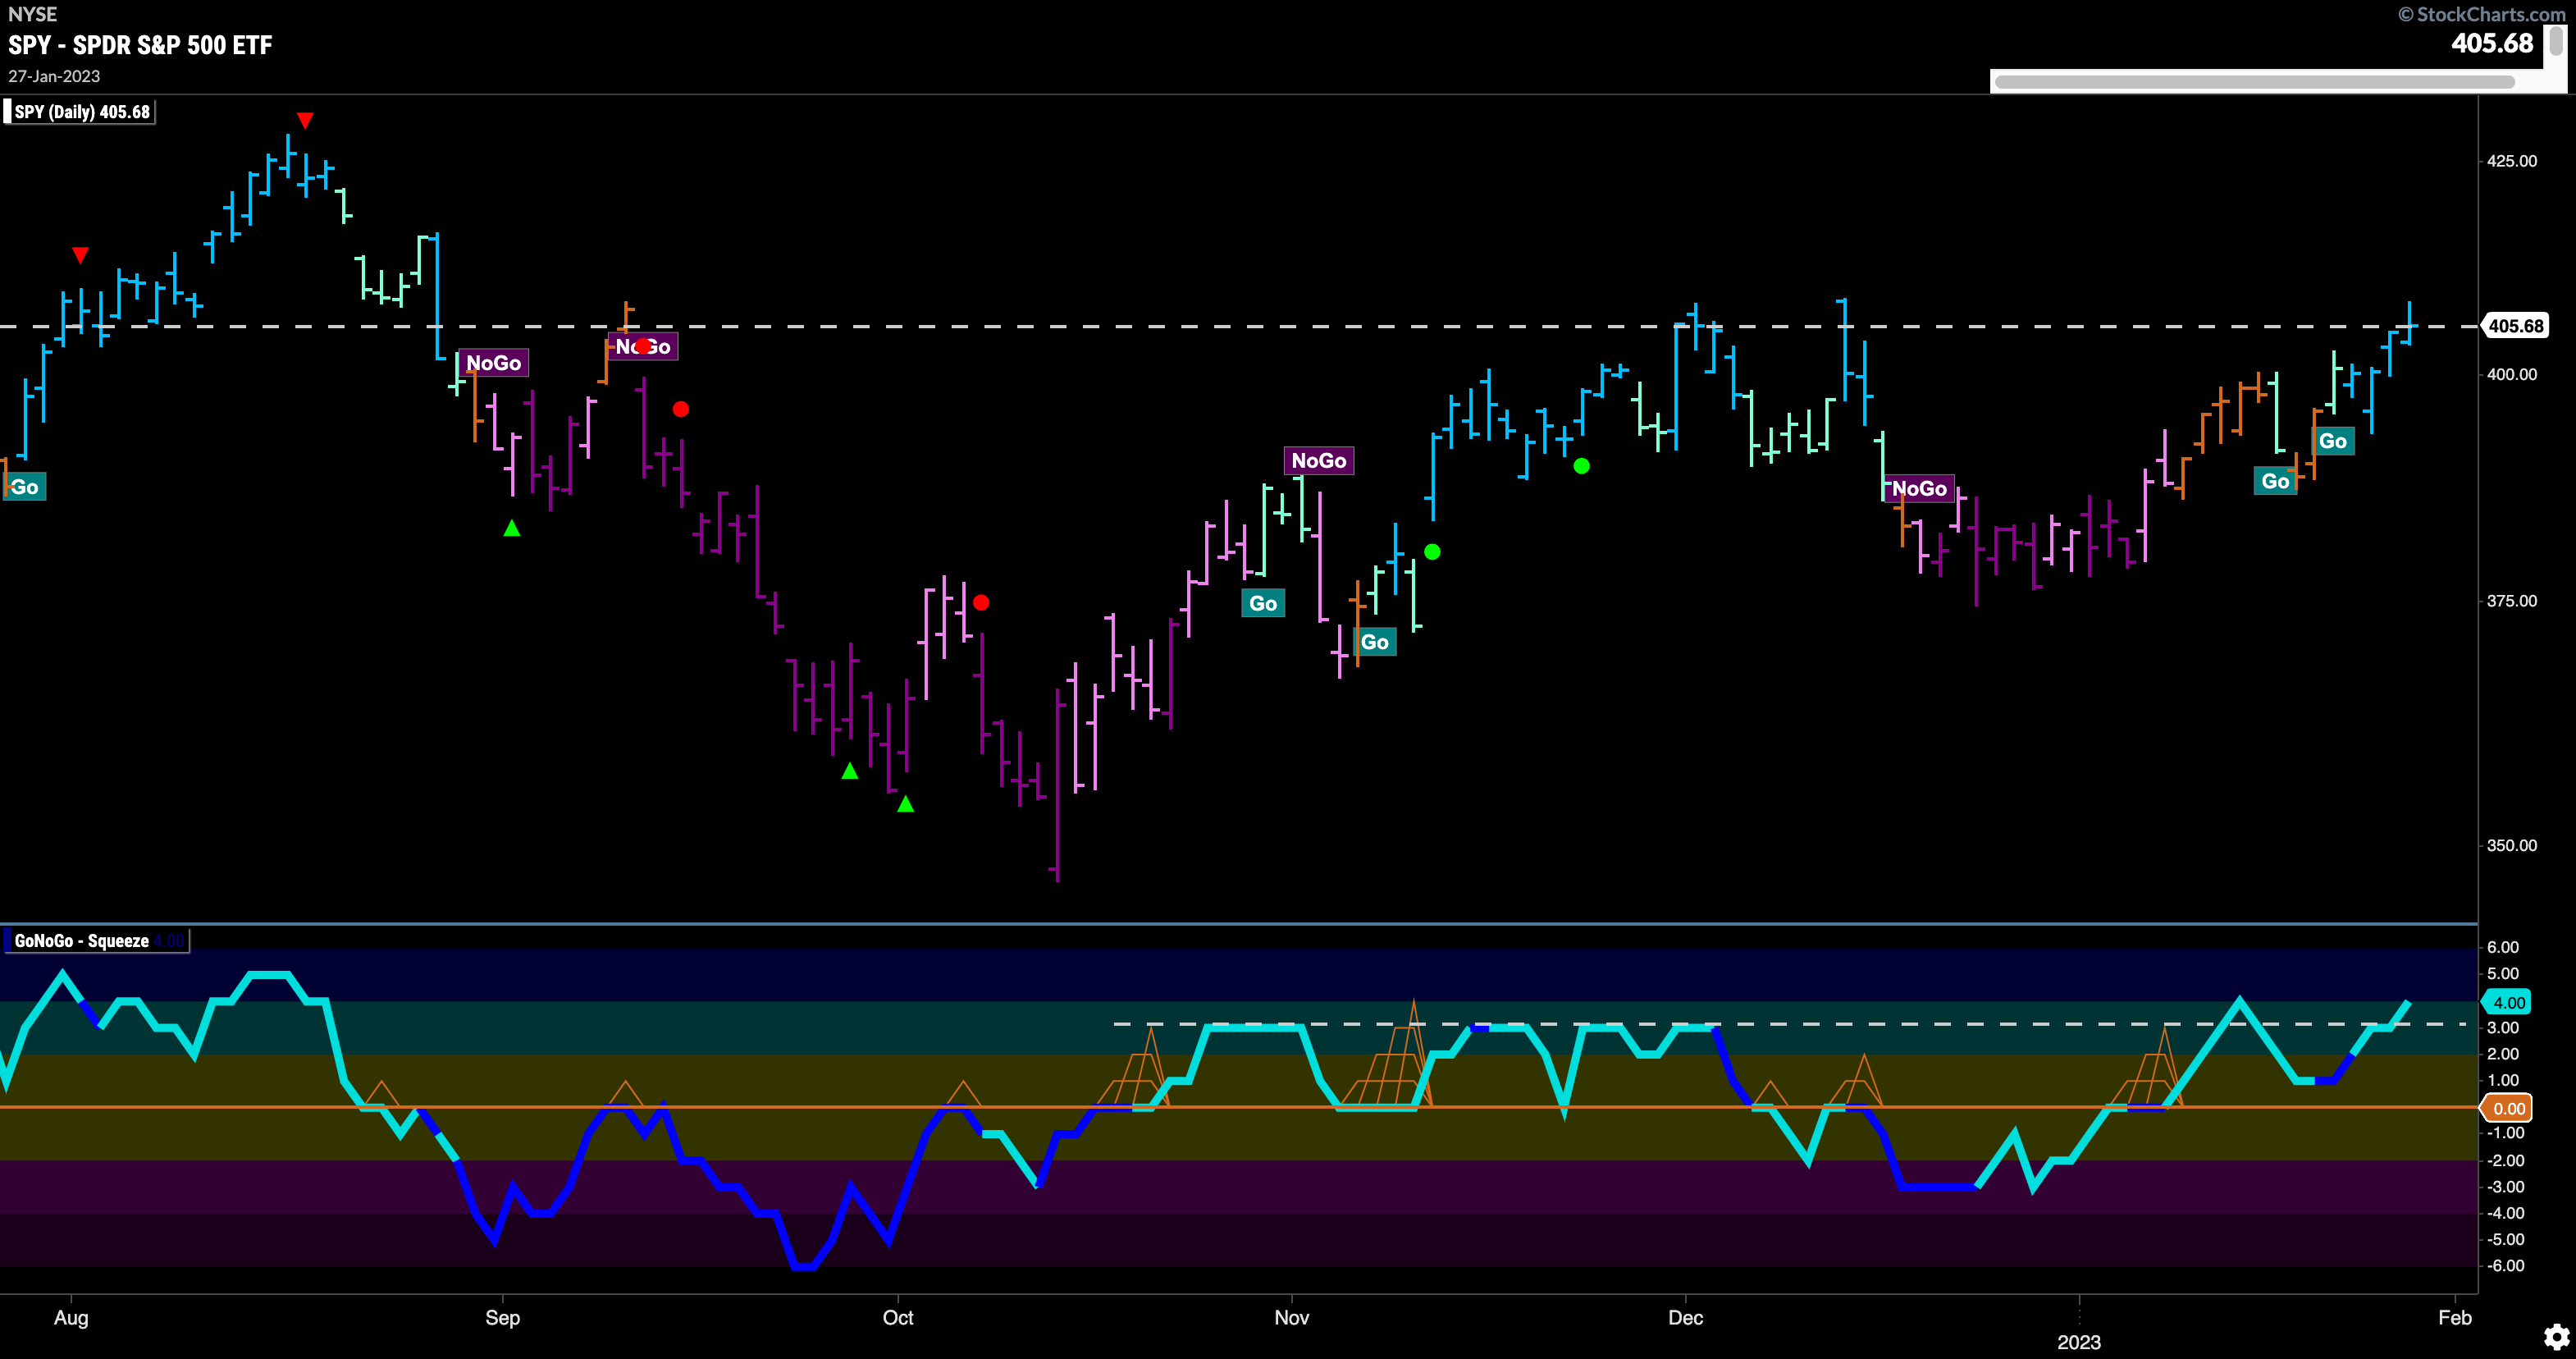
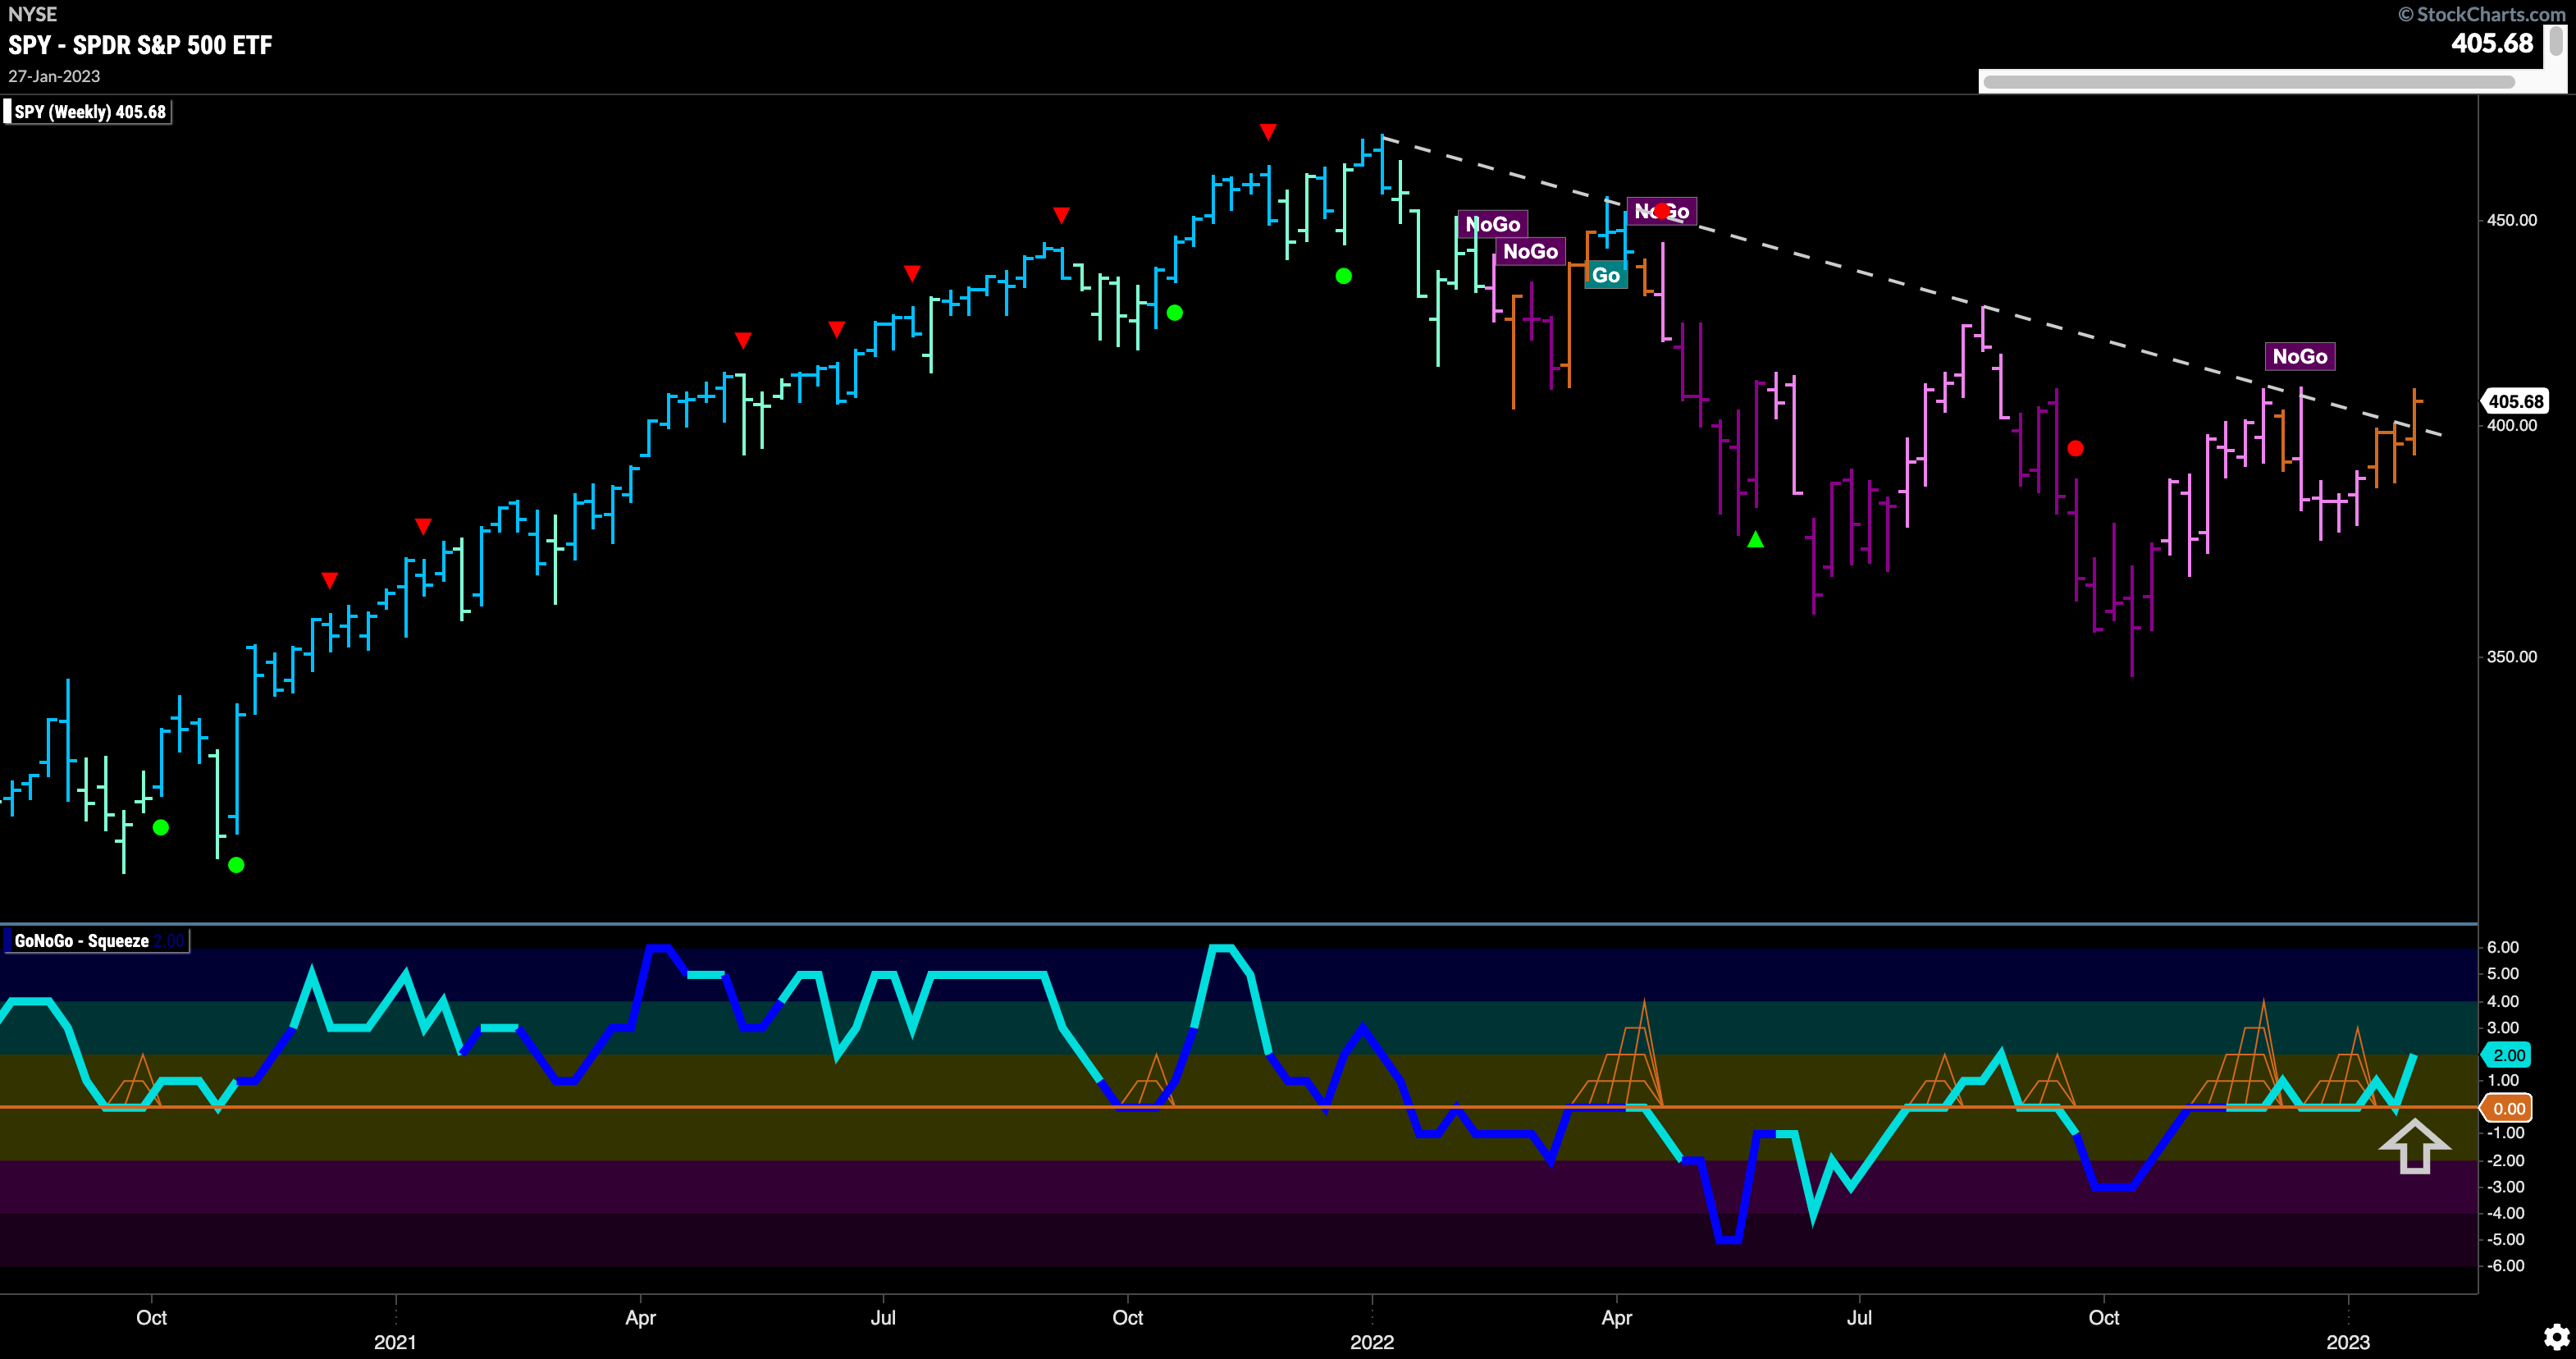
The longer term weekly chart shows a string of amber “Go Fish” bars now as price looks to be above the downward sloping trendline for the first time. More positives can be taken from GoNoGo Oscillator which has been able to find support again at the zero line and is rallying.
Treasury Rates Remain in “NoGo” but Finding Support
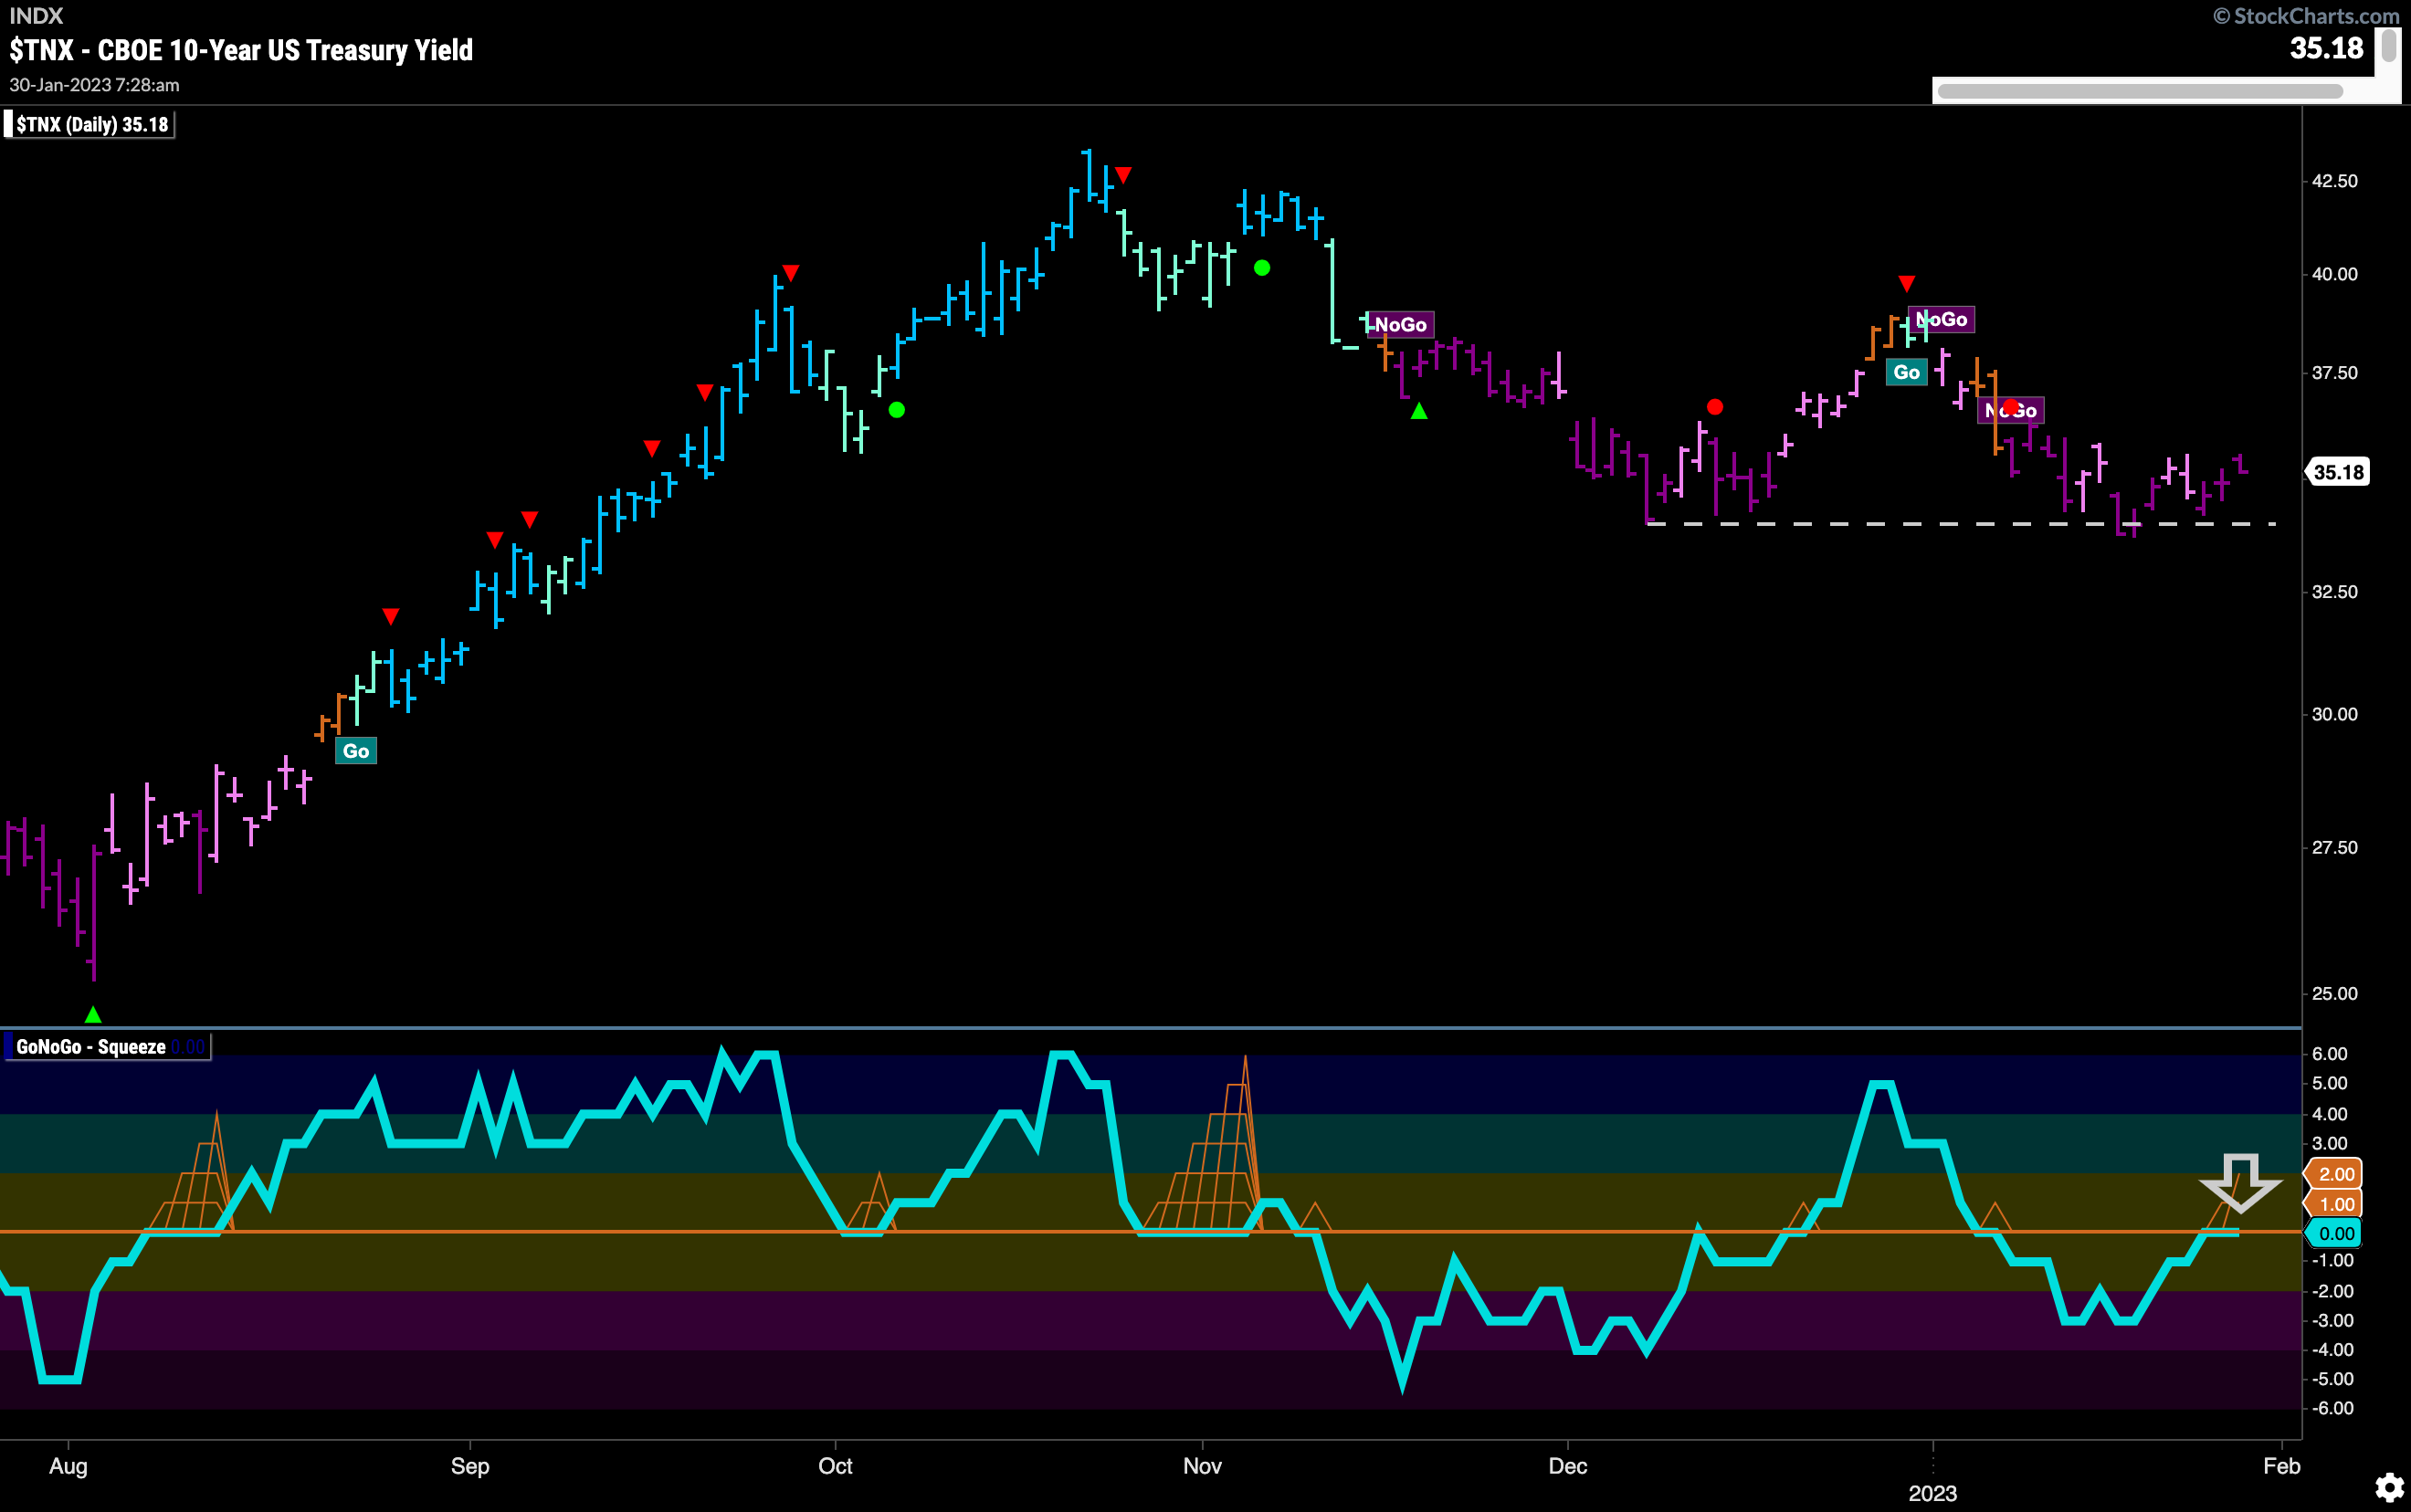
Treasury rates had no trouble painting “NoGo” bars this week but we do see significant support on the chart just below price. GoNoGo Oscillator is testing the zero line from below where we will watch to see if it finds resistance. If it does, we can expect price to make an attempt at new lows. However, a break back into positive territory would indicate buying pressure in the short term.
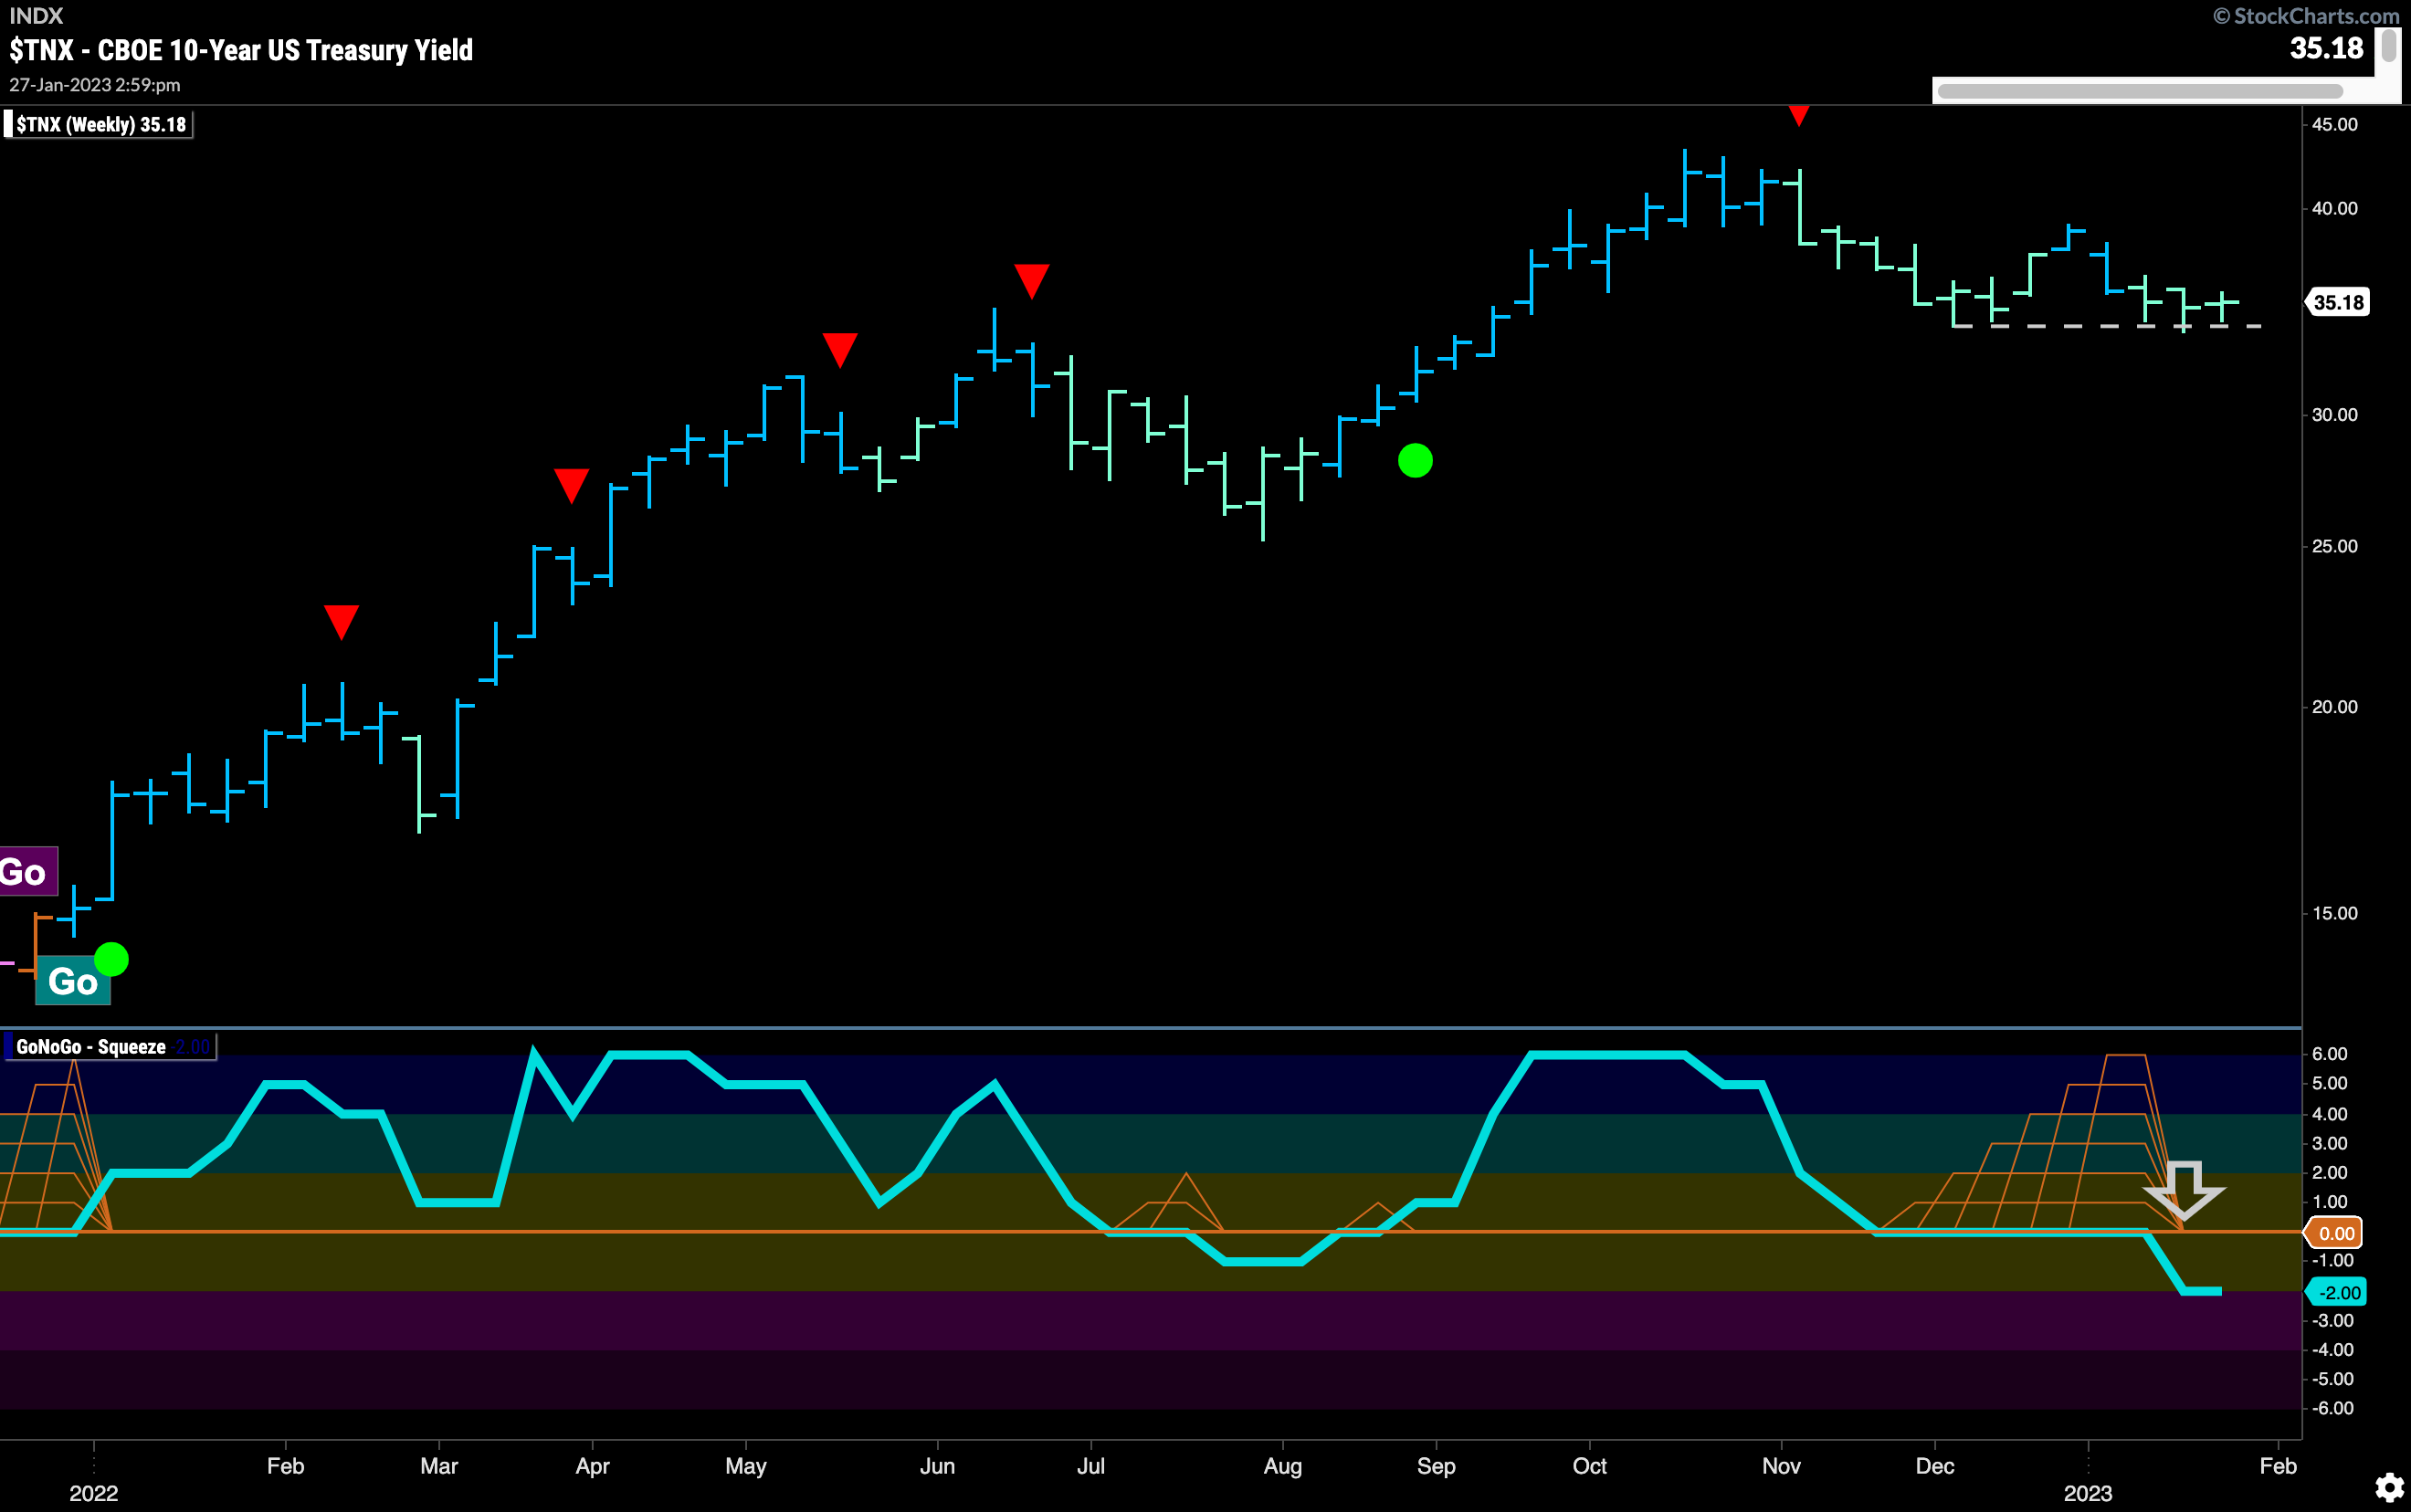
The longer term chart shows the same level of support that we saw on the daily chart. Importantly, we can see that GoNoGo Oscillator has broken out of a Max GoNoGo Squeeze into negative territory. This tells us that momentum is not on the side of the “Go” trend at the moment.
The Dollar Consolidates below Resistance
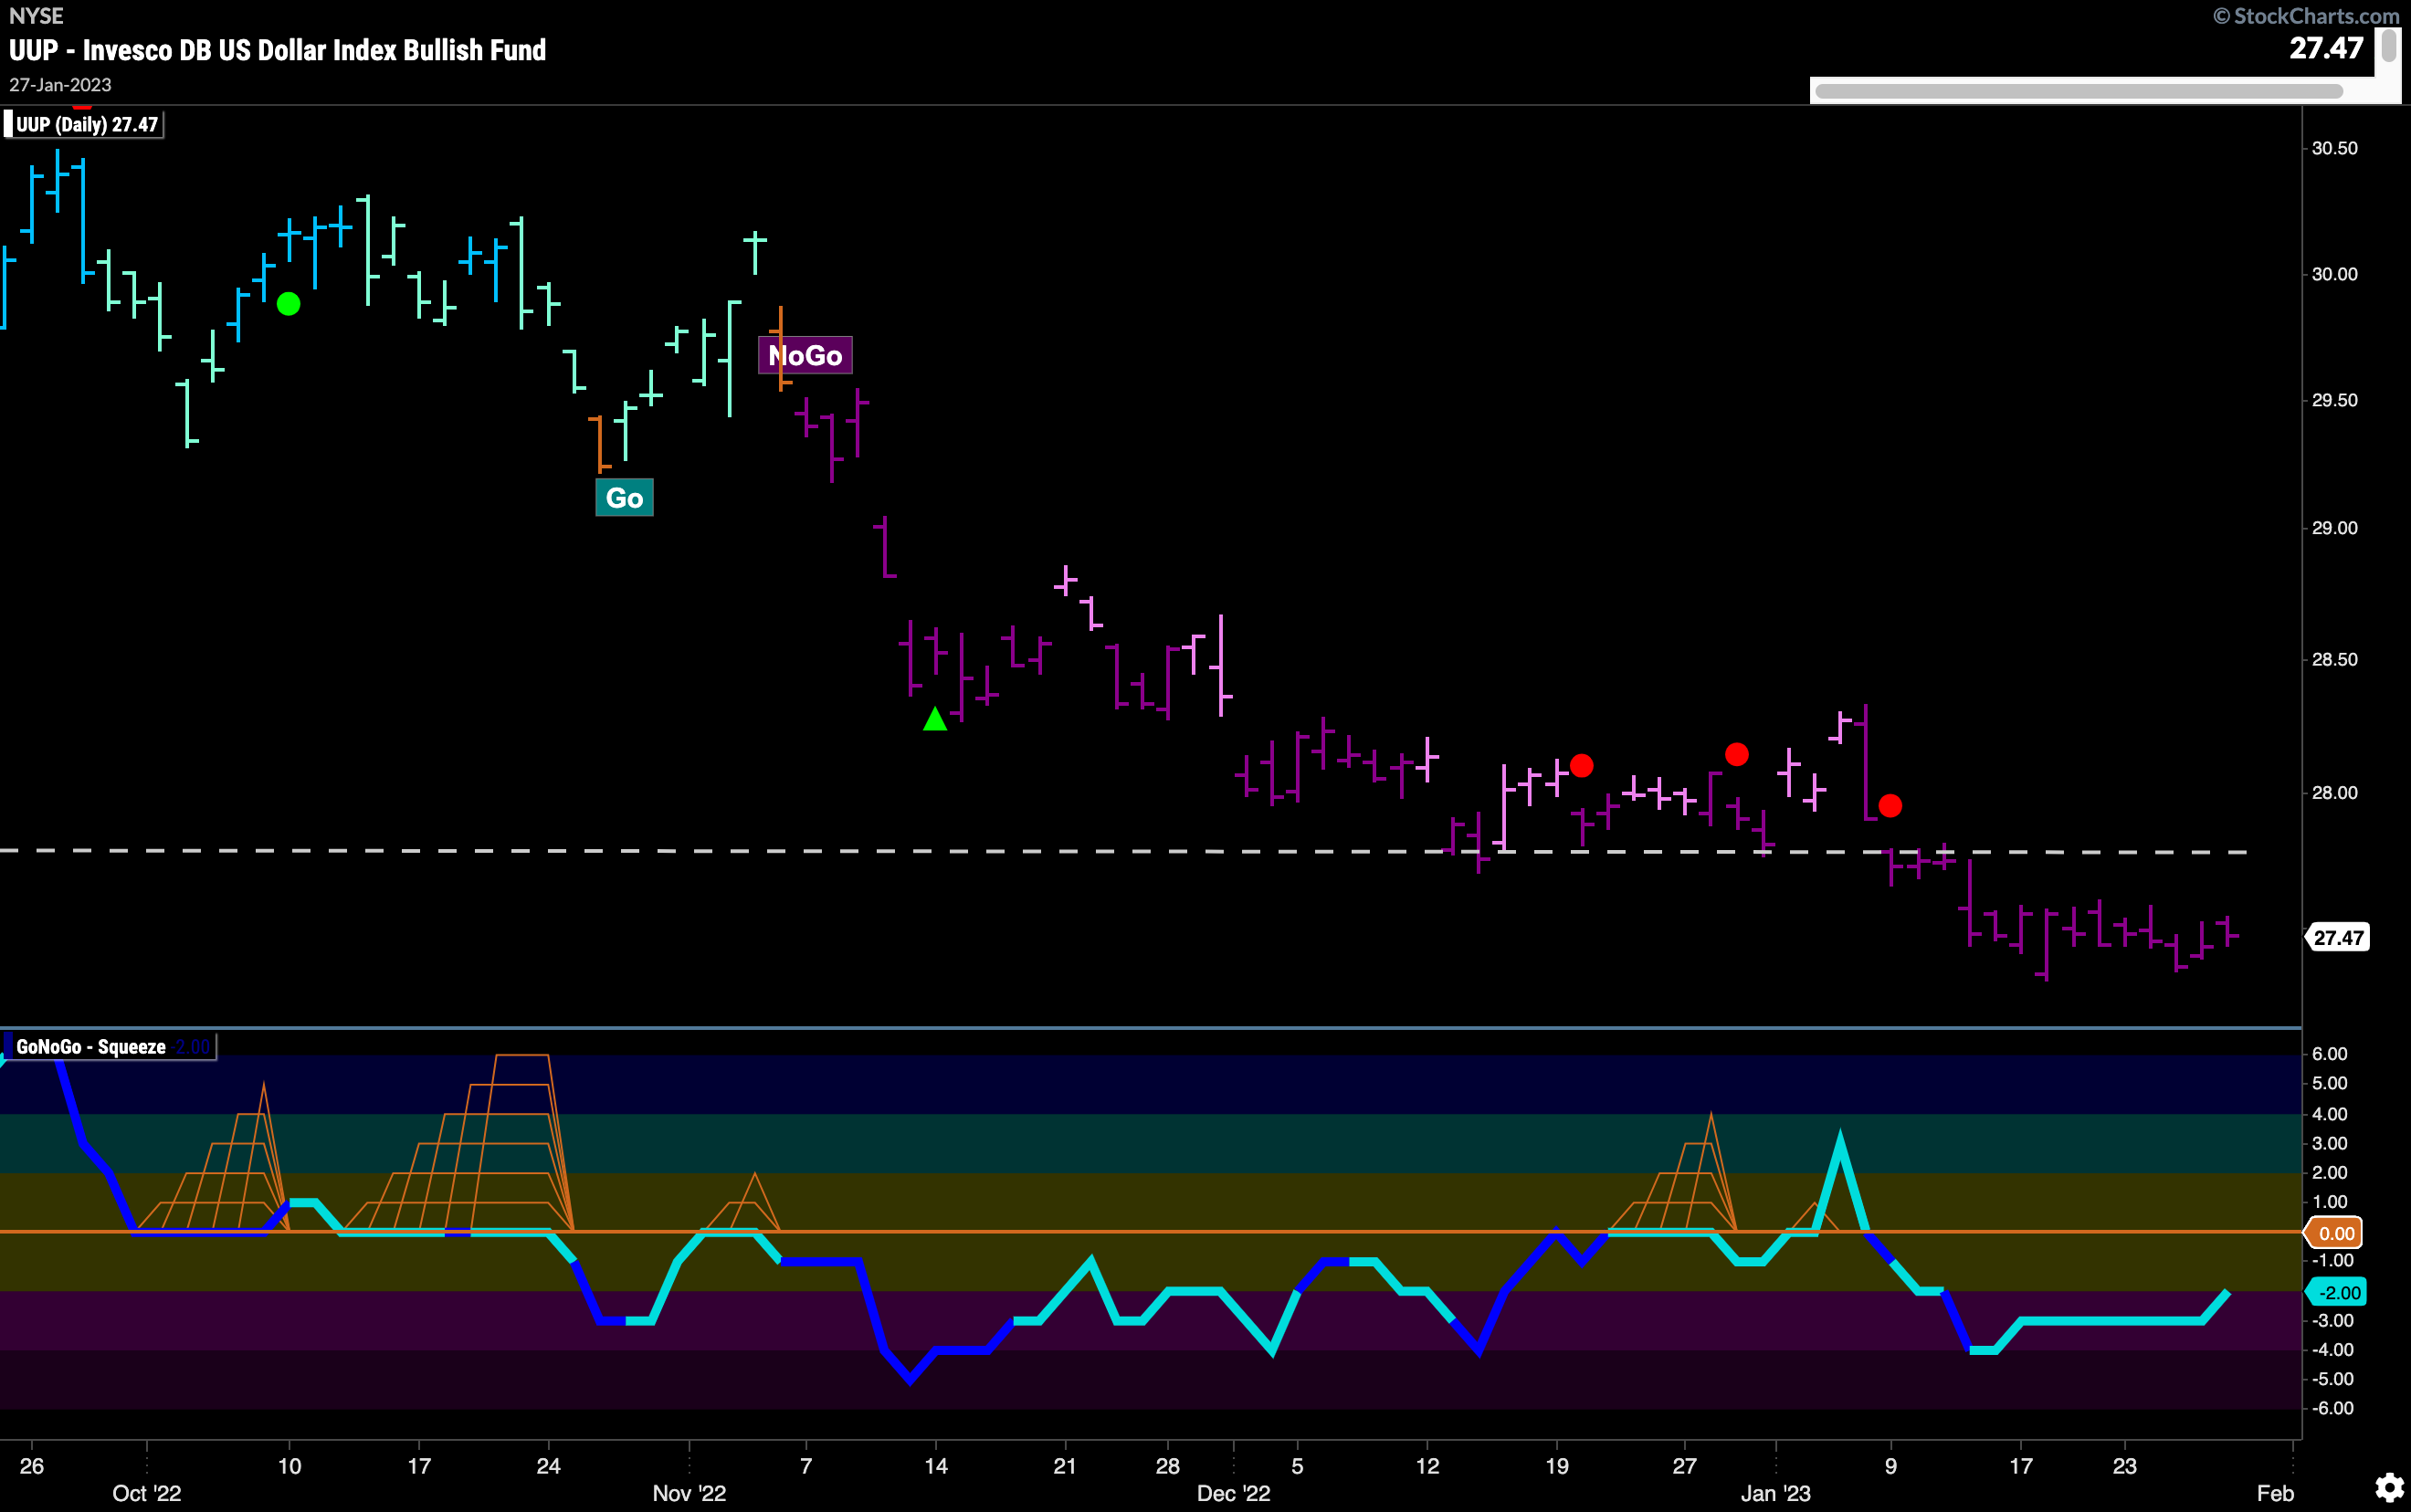
Prices have consolidated below a level which should now hold as resistance going forward. We see uninterrupted strong purple “NoGo” bars and GoNoGo Oscillator in negative territory but not yet oversold. We will need to see some significant change before we worry about the health of the “NoGo” trend in the dollar.
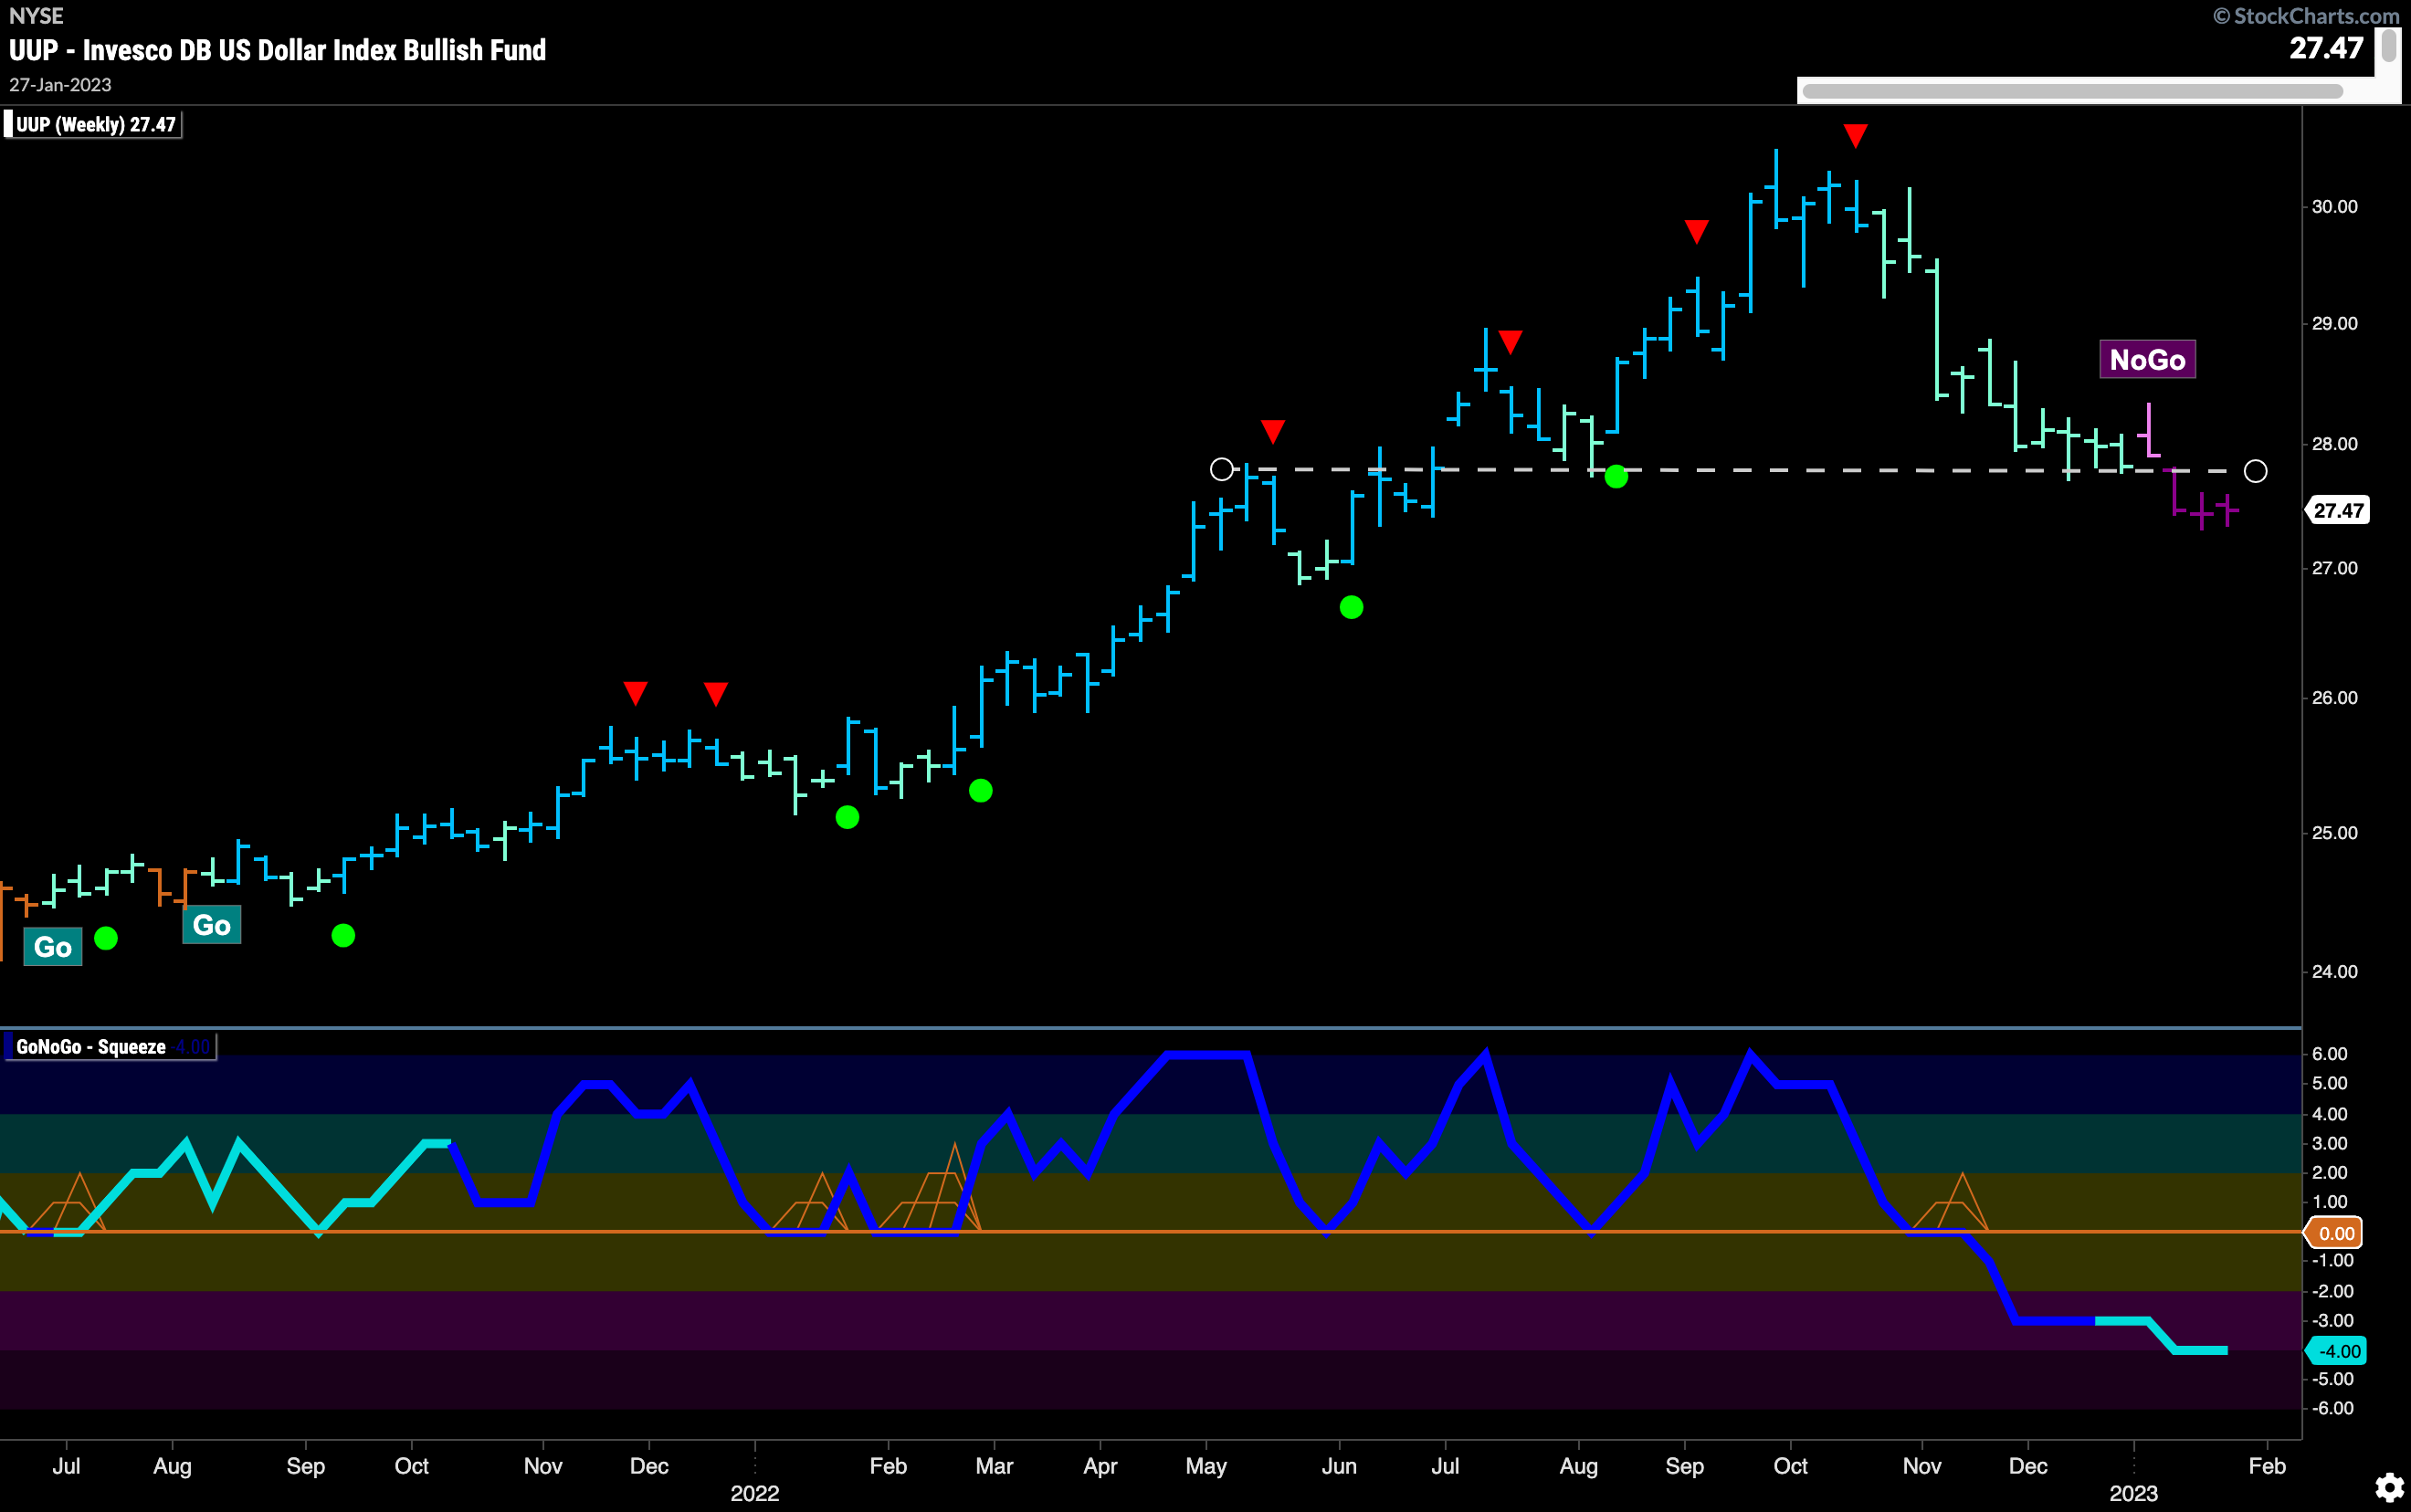
On the longer term chart of the greenback, we can see that the new “NoGo” trend is now trading below a level that should act as resistance. GoNoGo Oscillator, having broken below the zero line as price trend weakened, remains in negative territory but not yet oversold.
$GLD Sets New High
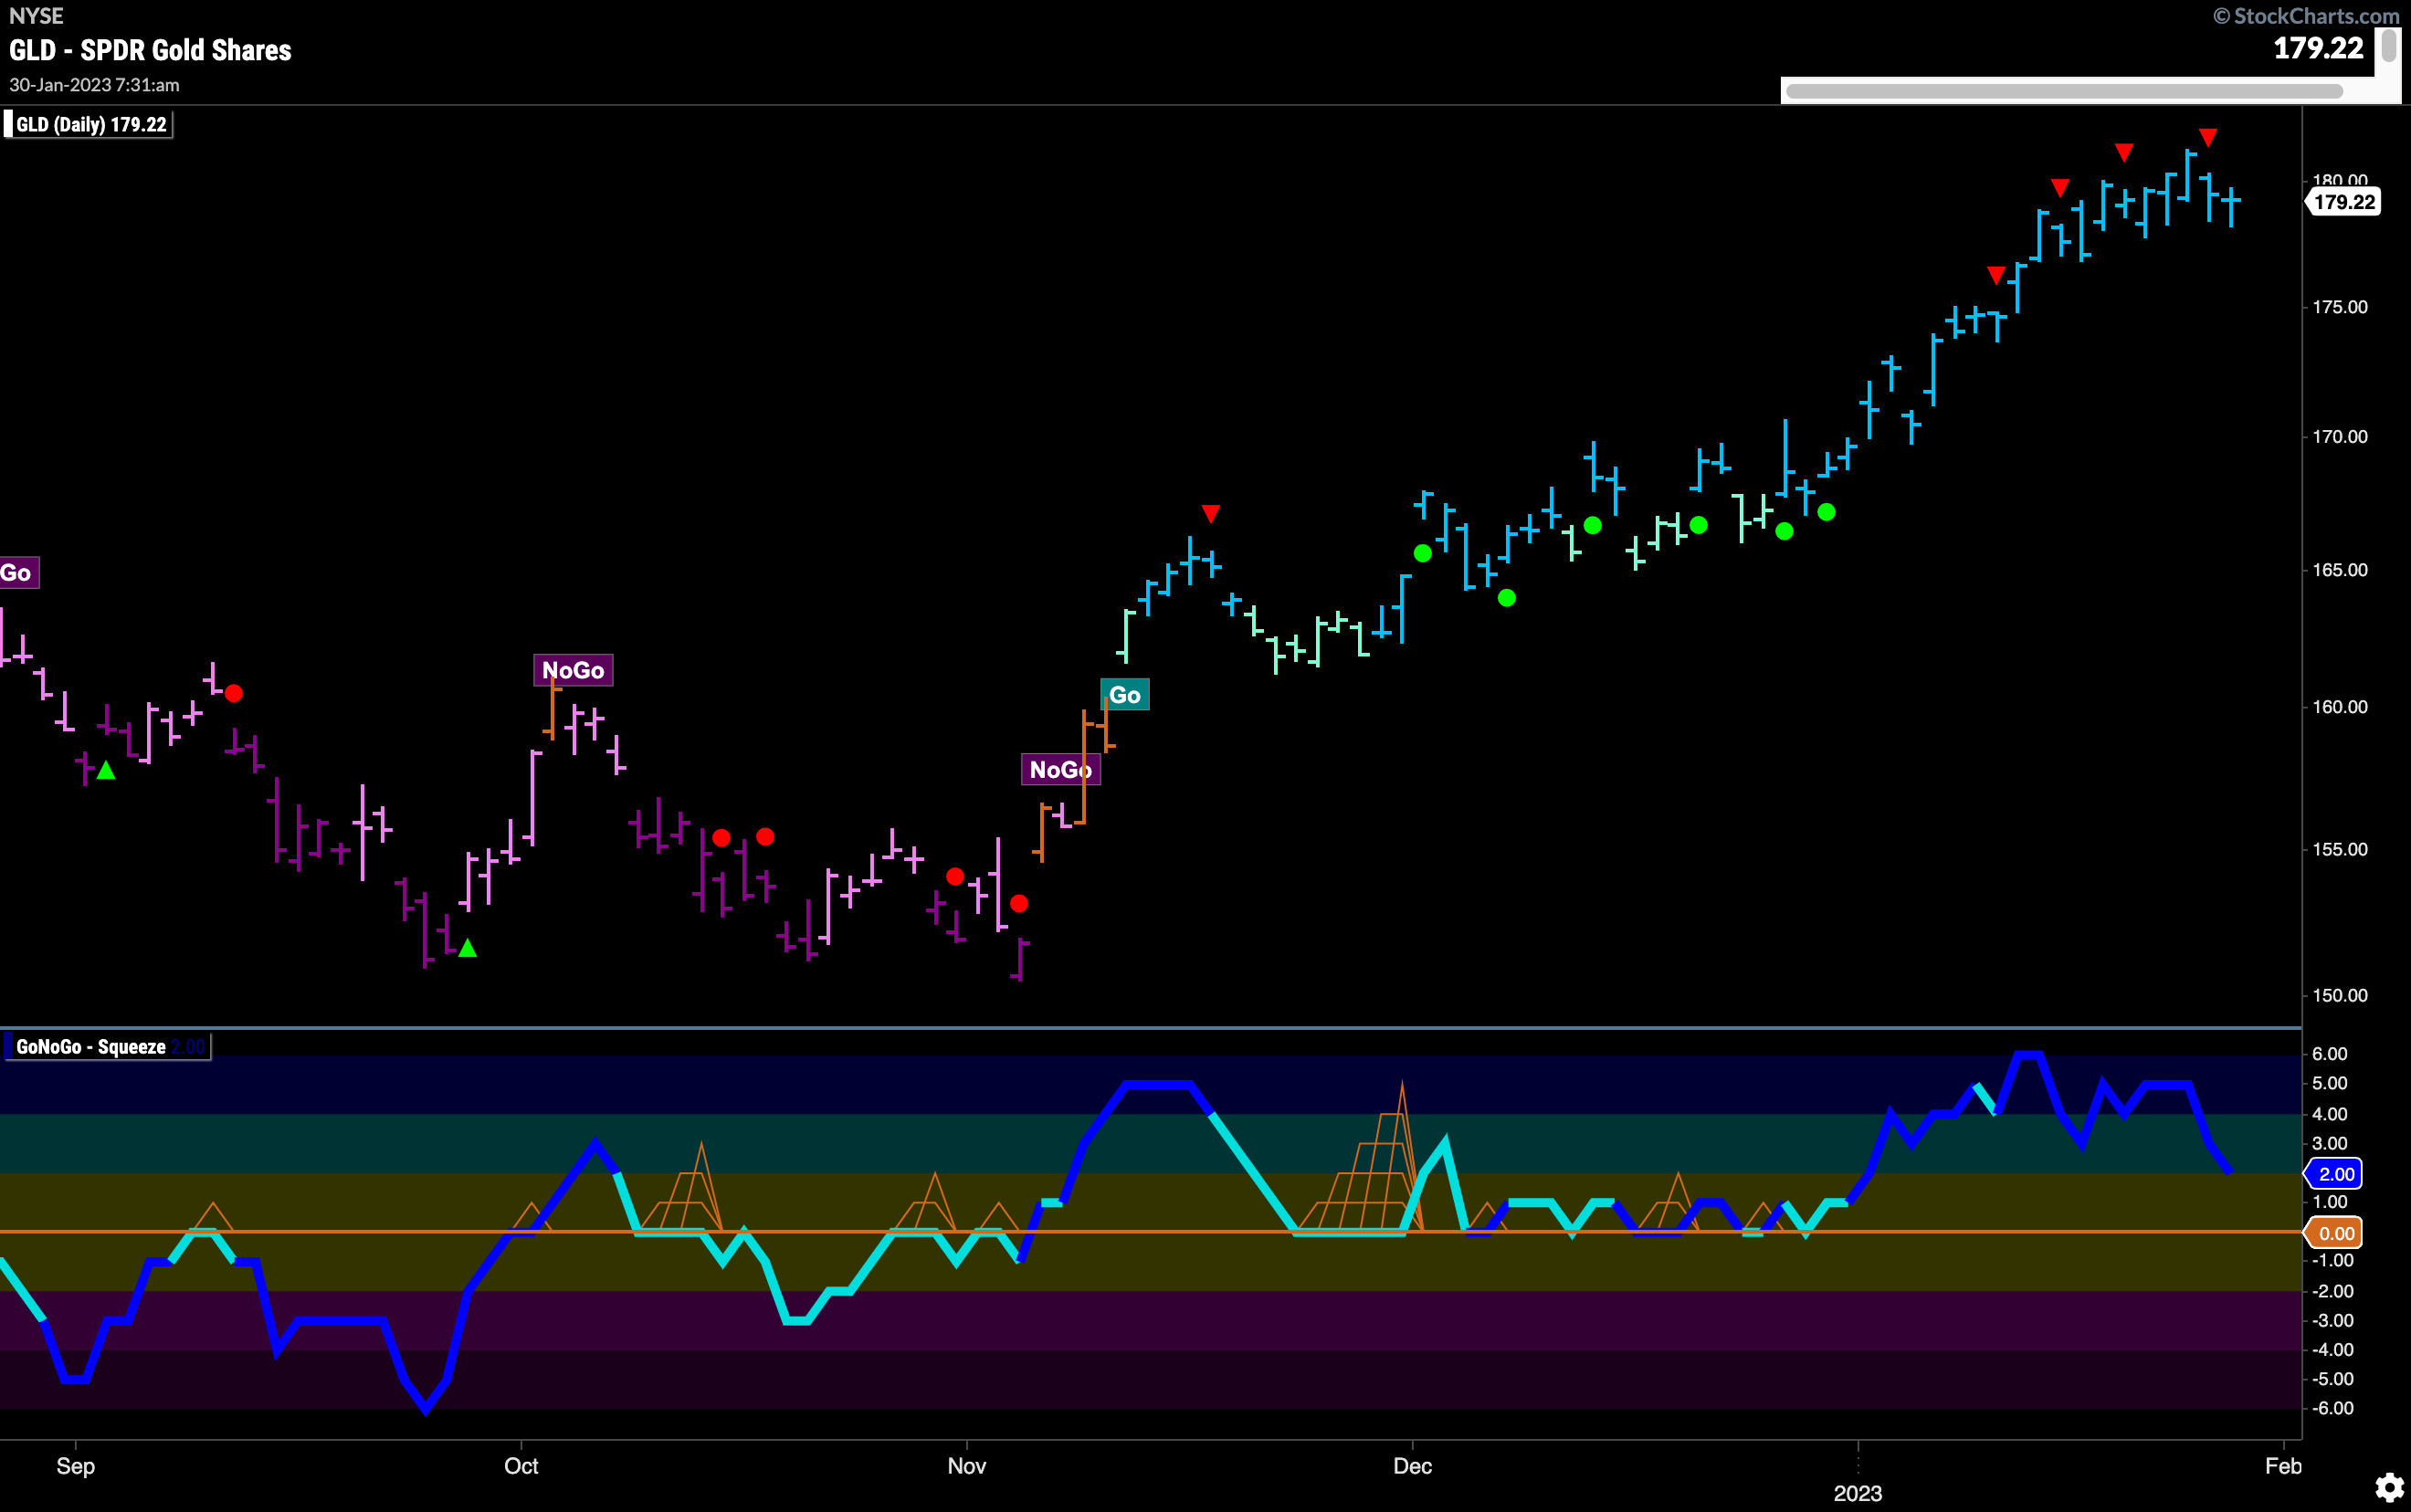
Gold prices saw another high this week as GoNoGo Trend continued to paint uninterrupted strong blue “Go” bars. We do see several Go Countertrend Correction Icons (red arrows) as momentum has been very strong but now is cooling off and the oscillator is moving toward the zero line. This would suggest that in the short term price may struggle to go higher.
USO Maintains Sideways Movement
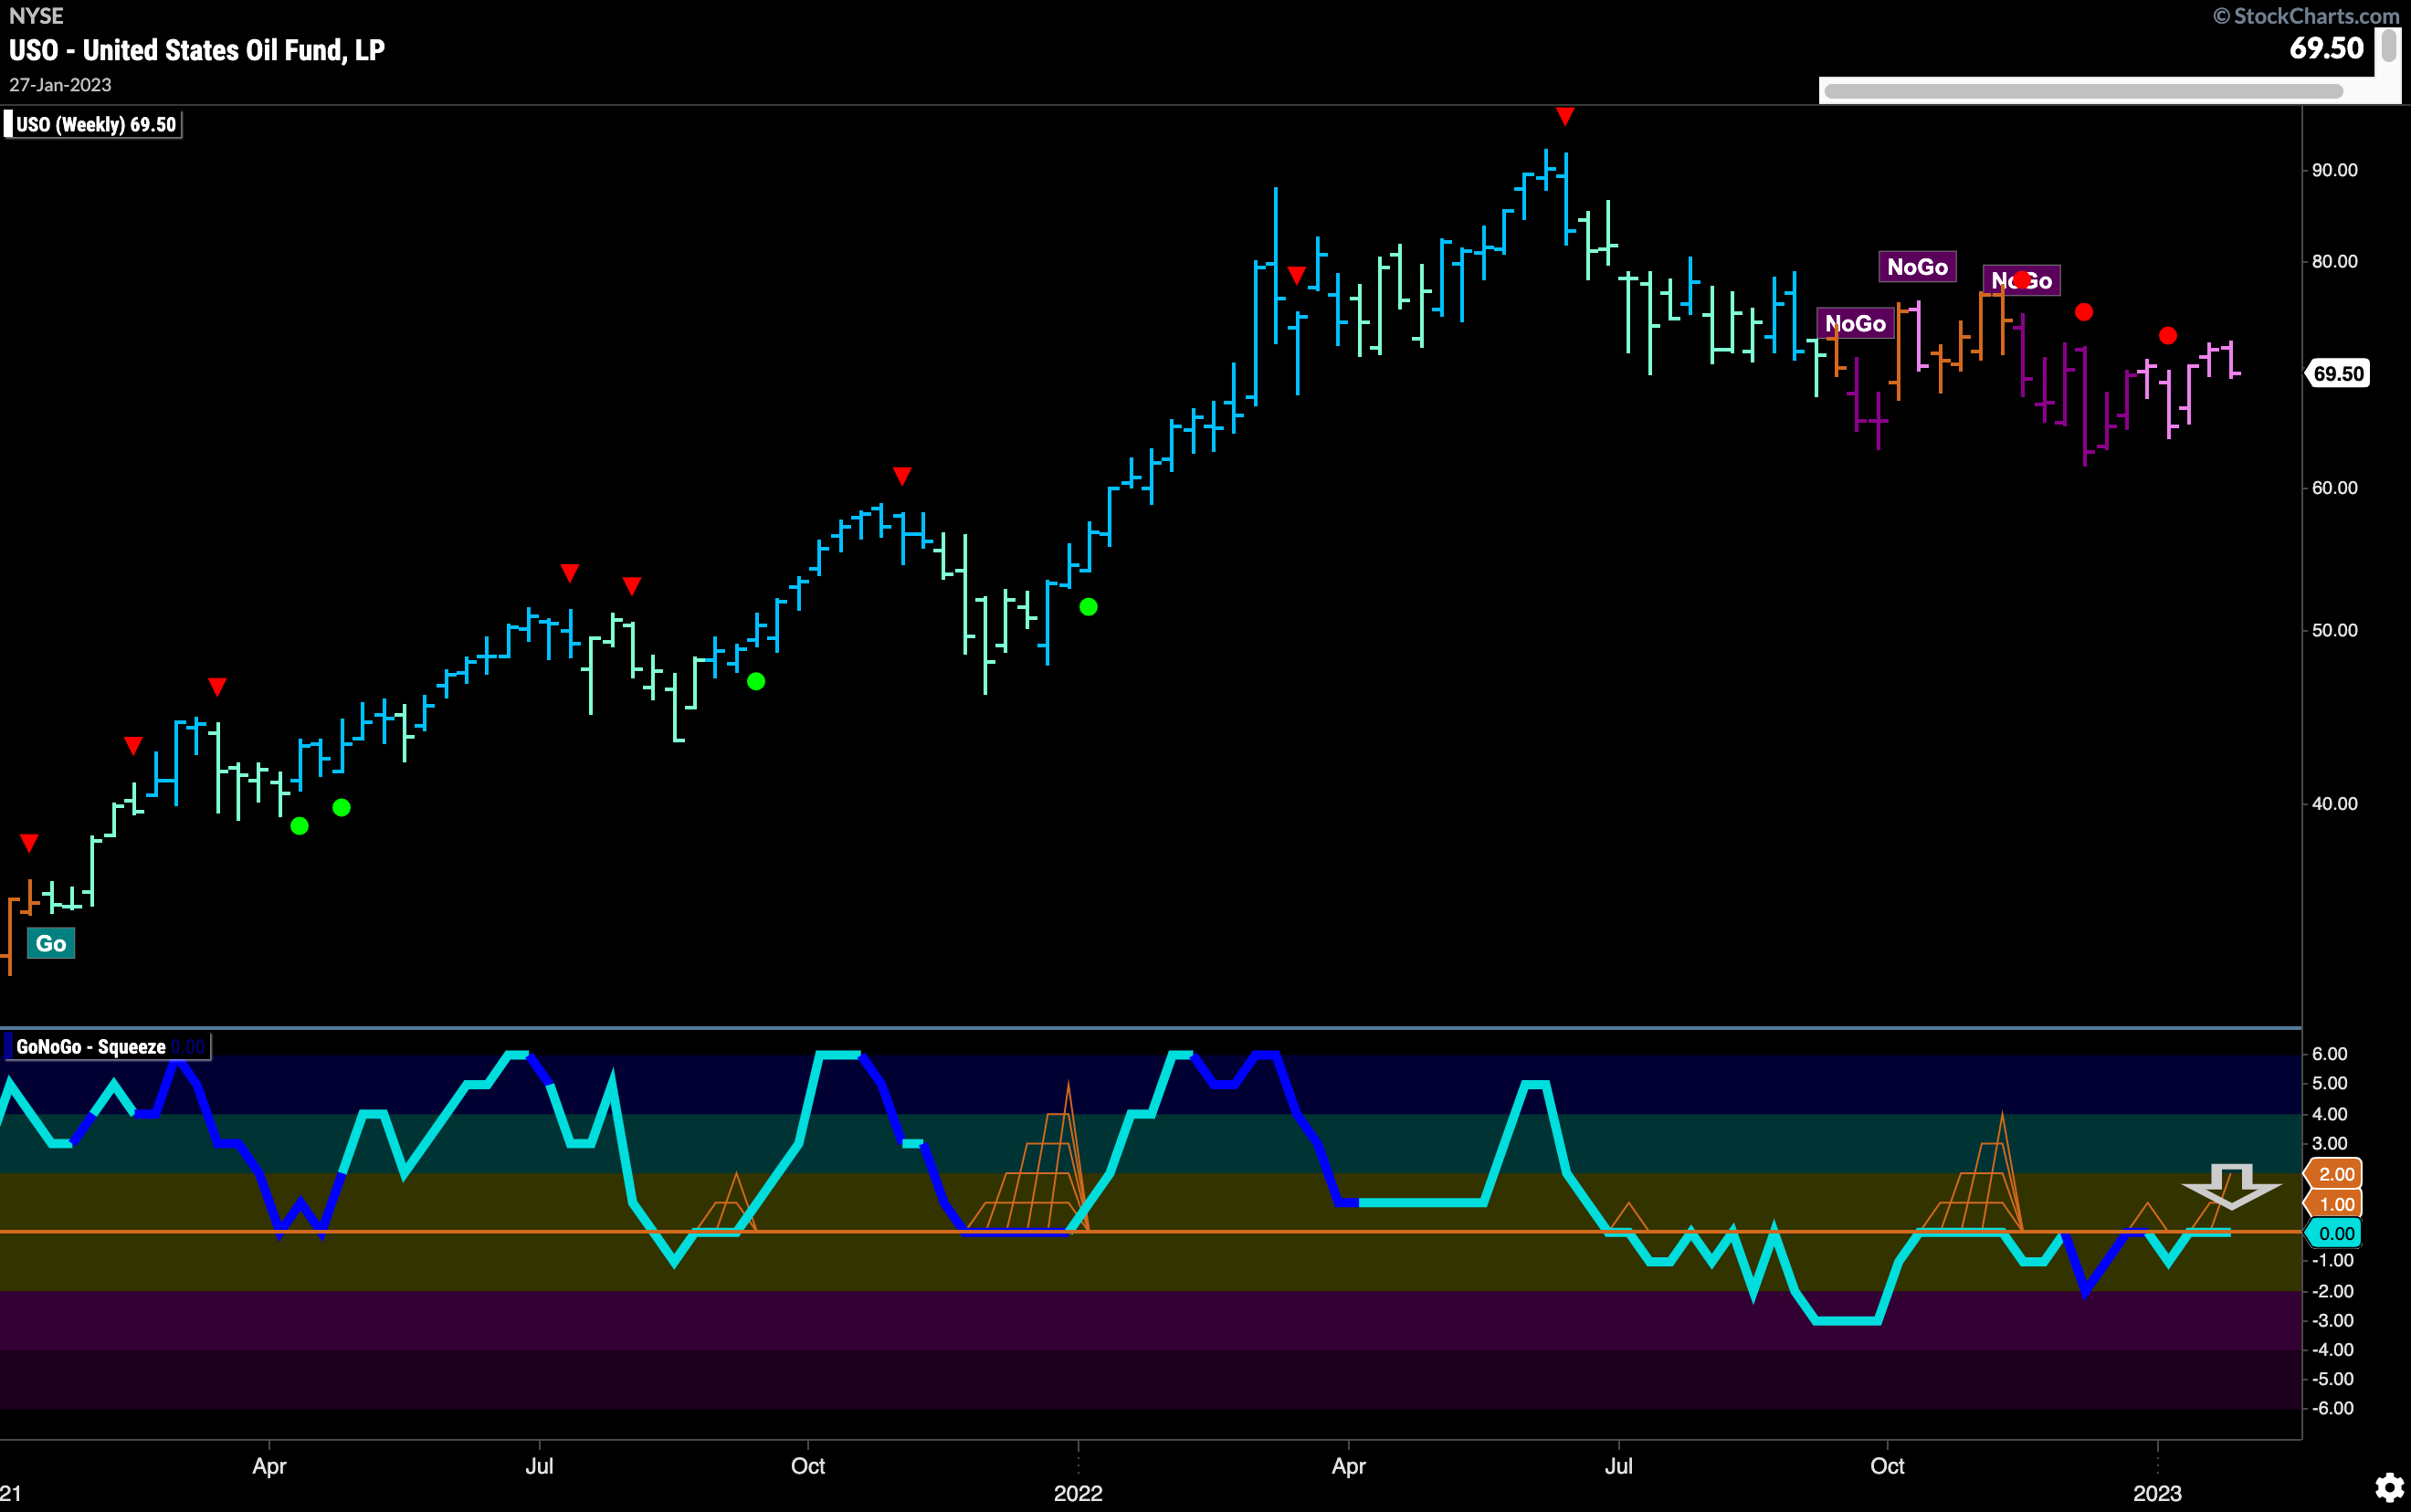
$USO on a weekly chart shows little change. The GoNoGo Trend shows that we are in a weak “NoGo” trend but that we are still below the most recent lower high. There is clearly some support below however and we will need to watch GoNoGo Oscillator to see in which direction it moves. Currently, it is testing the zero line from below.
Sector RelMap
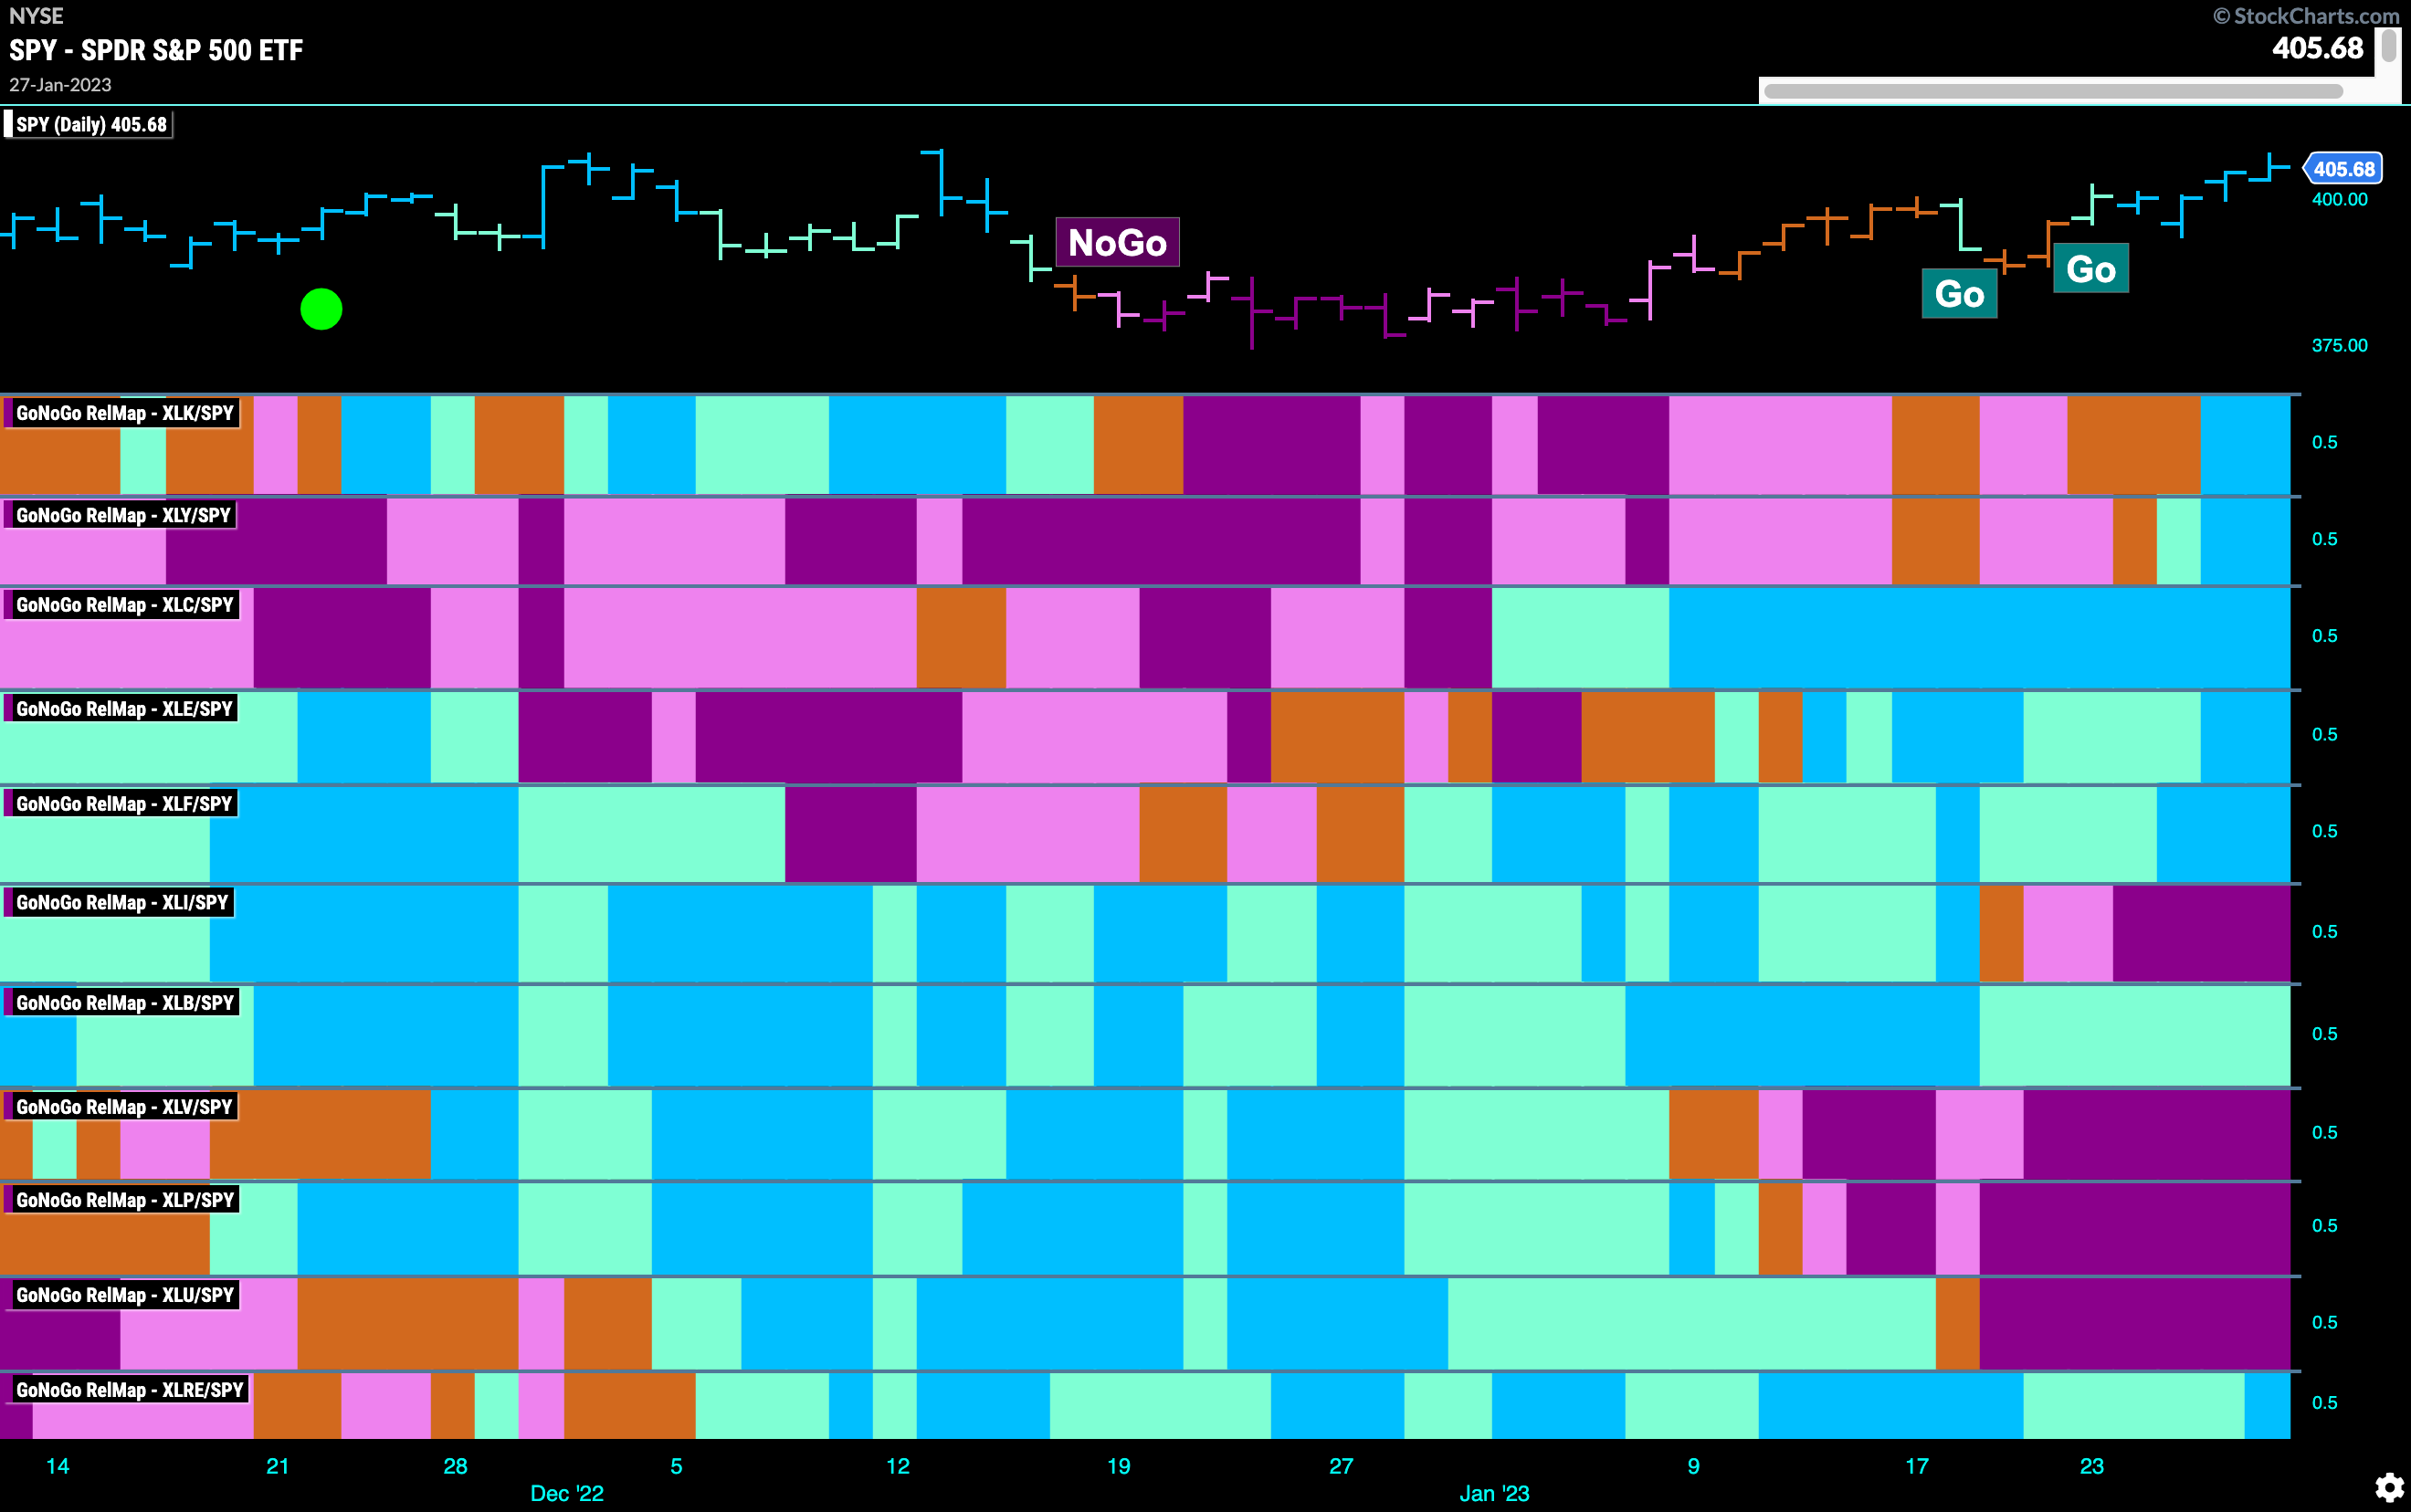
Below is the GoNoGo Sector RelMap. This GoNoGo RelMap applies the GoNoGo Trend to the relative strength ratios of the sectors to the base index. Looking at this map, we can quickly see where the relative outperformance is coming from as well as which sectors are lagging on a relative basis. 7 sectors are outperforming the base this week. $XLK, $XLY, $XLC, $XLE, $XLF, $XLB, and $XLRE, are painting “Go” bars.
The Discretionary Sector Starting to Look Strong
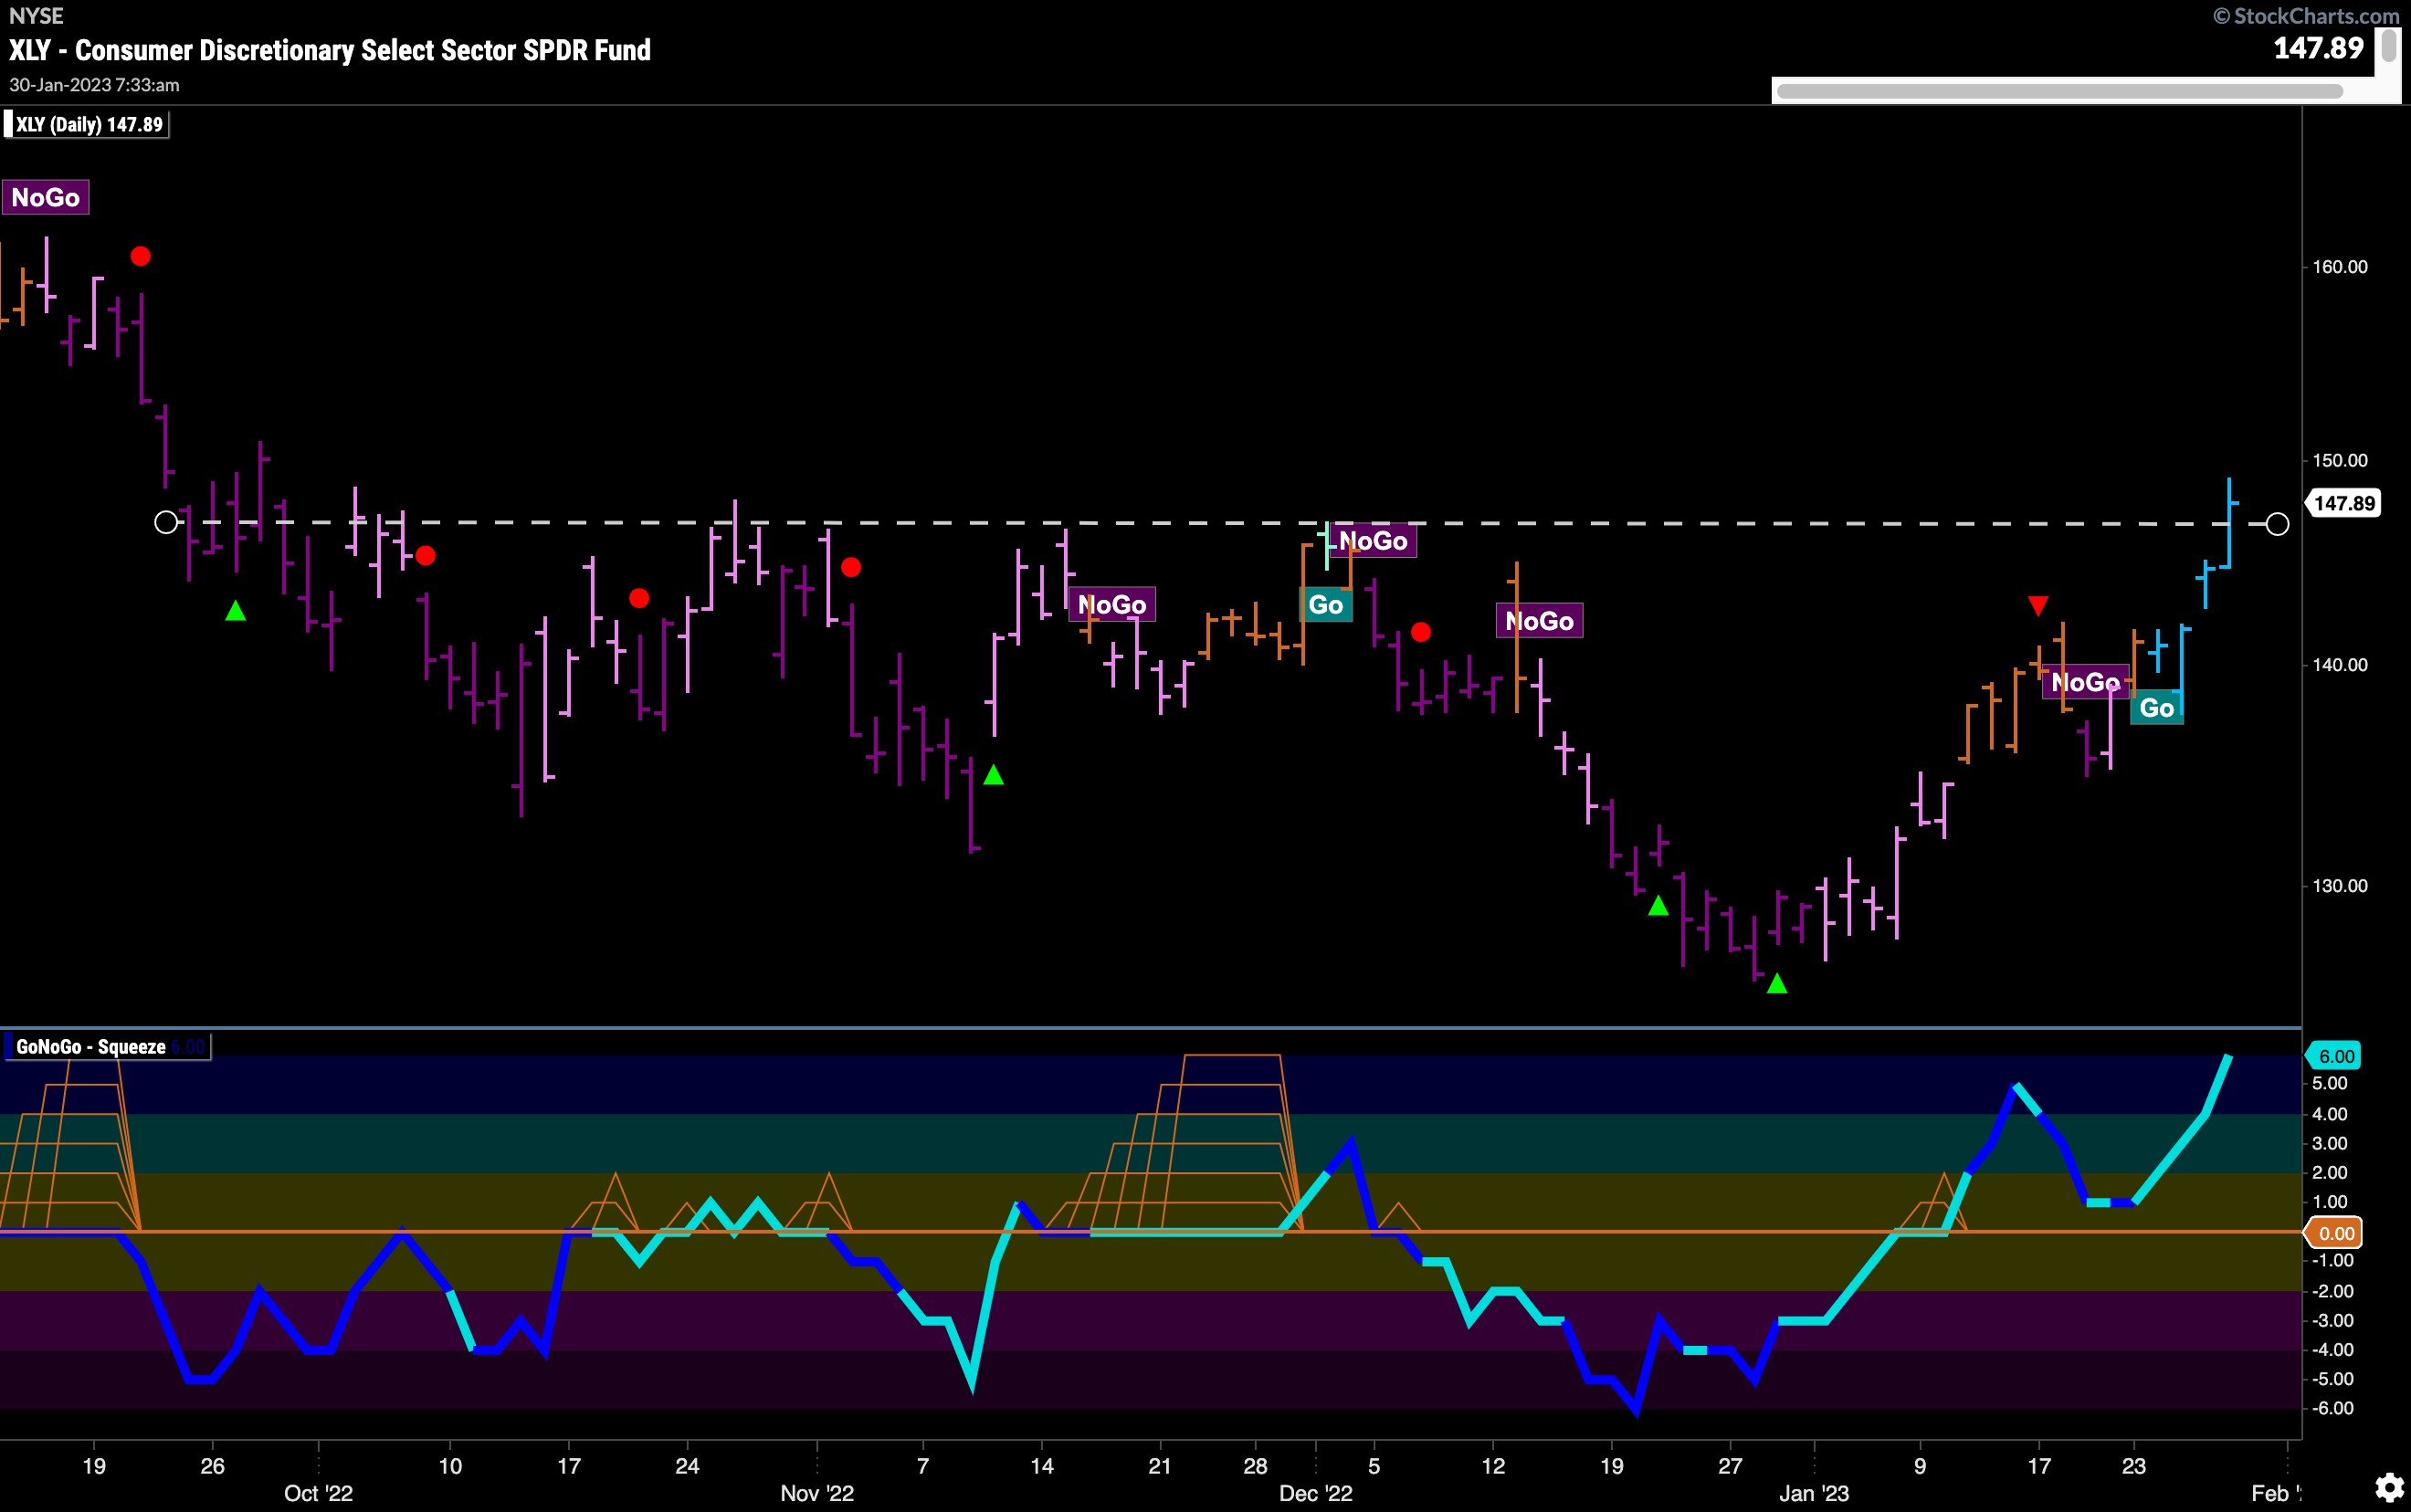
An important level on the chart looks to be being tested right now. GoNoGo Trend shows a string of strong blue “Go” bars as price fights to break higher than significant resistance. GoNoGo Oscillator broke into positive territory ahead of this trend change and after moving close to zero has moved sharply higher again.
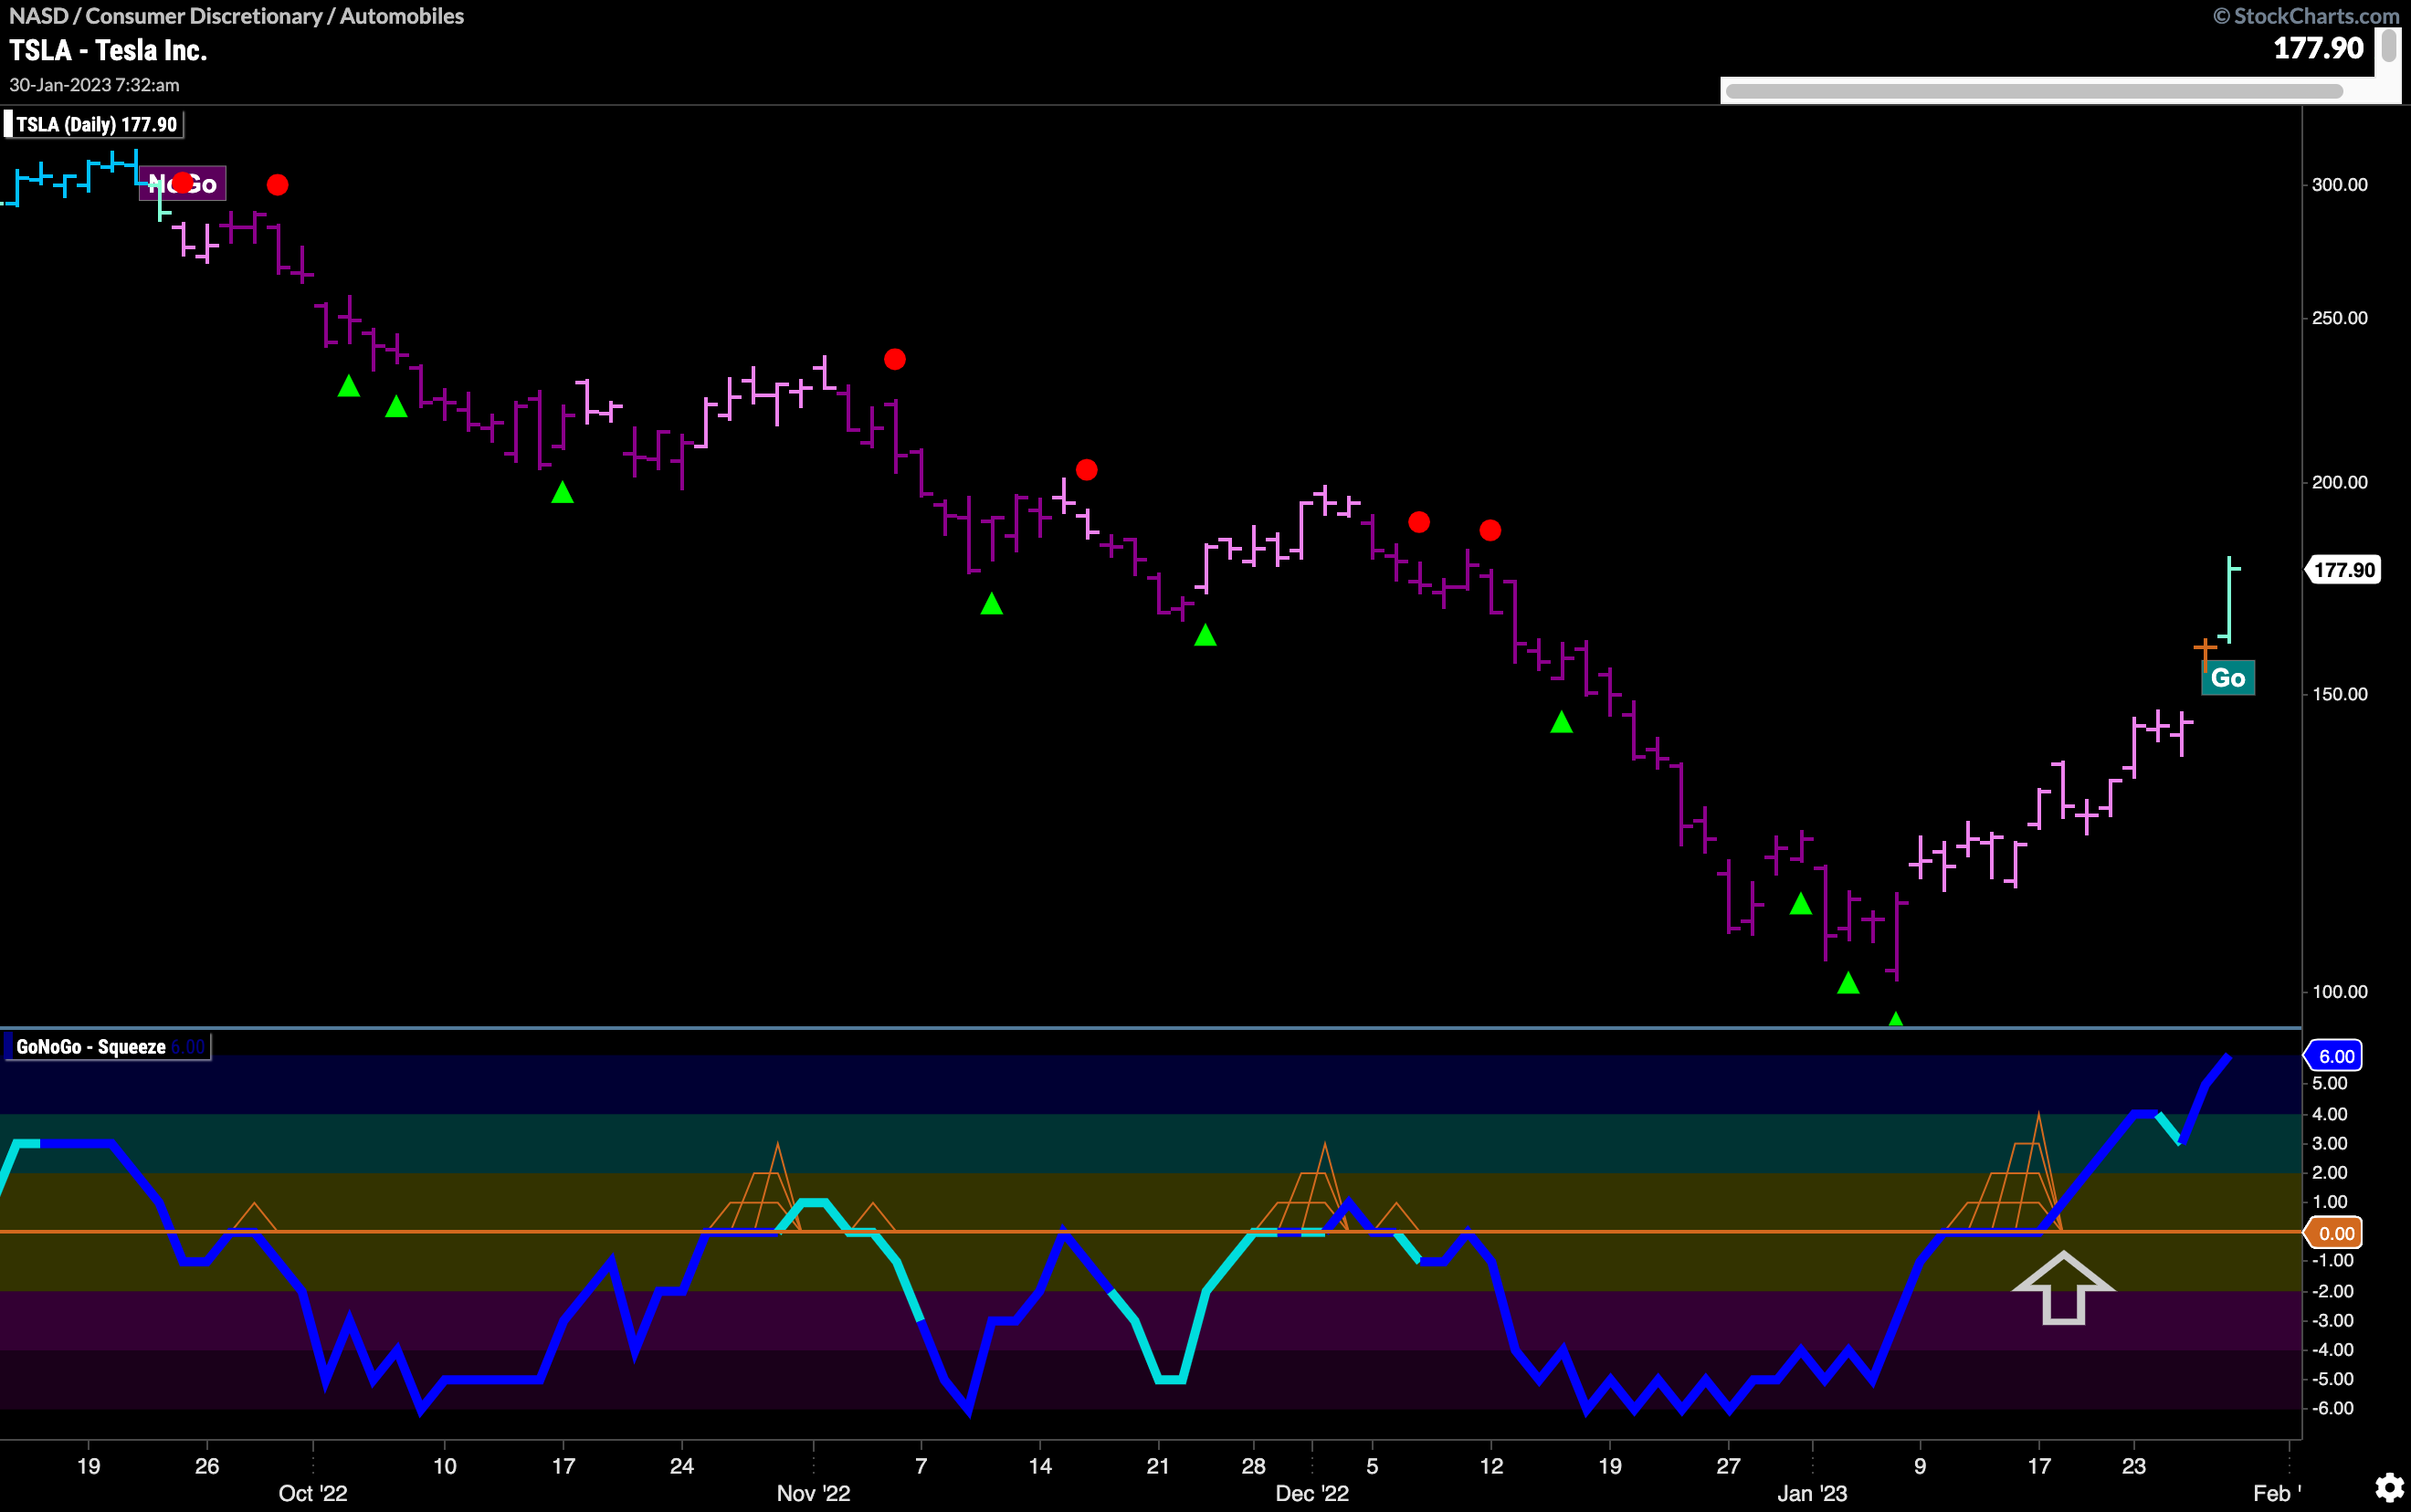
Tesla Turning Around
The chart below shows $TSLA and we see a fresh “Go” identified. After rallying strongly off the lows, we first saw GoNoGo Oscillator break above the zero line on heavy volume. This has been followed by first “Go” bar. We will watch closely as price navigates the congestion that we can see from the middle of the chart. However, the trend has changed and momentum is positive.
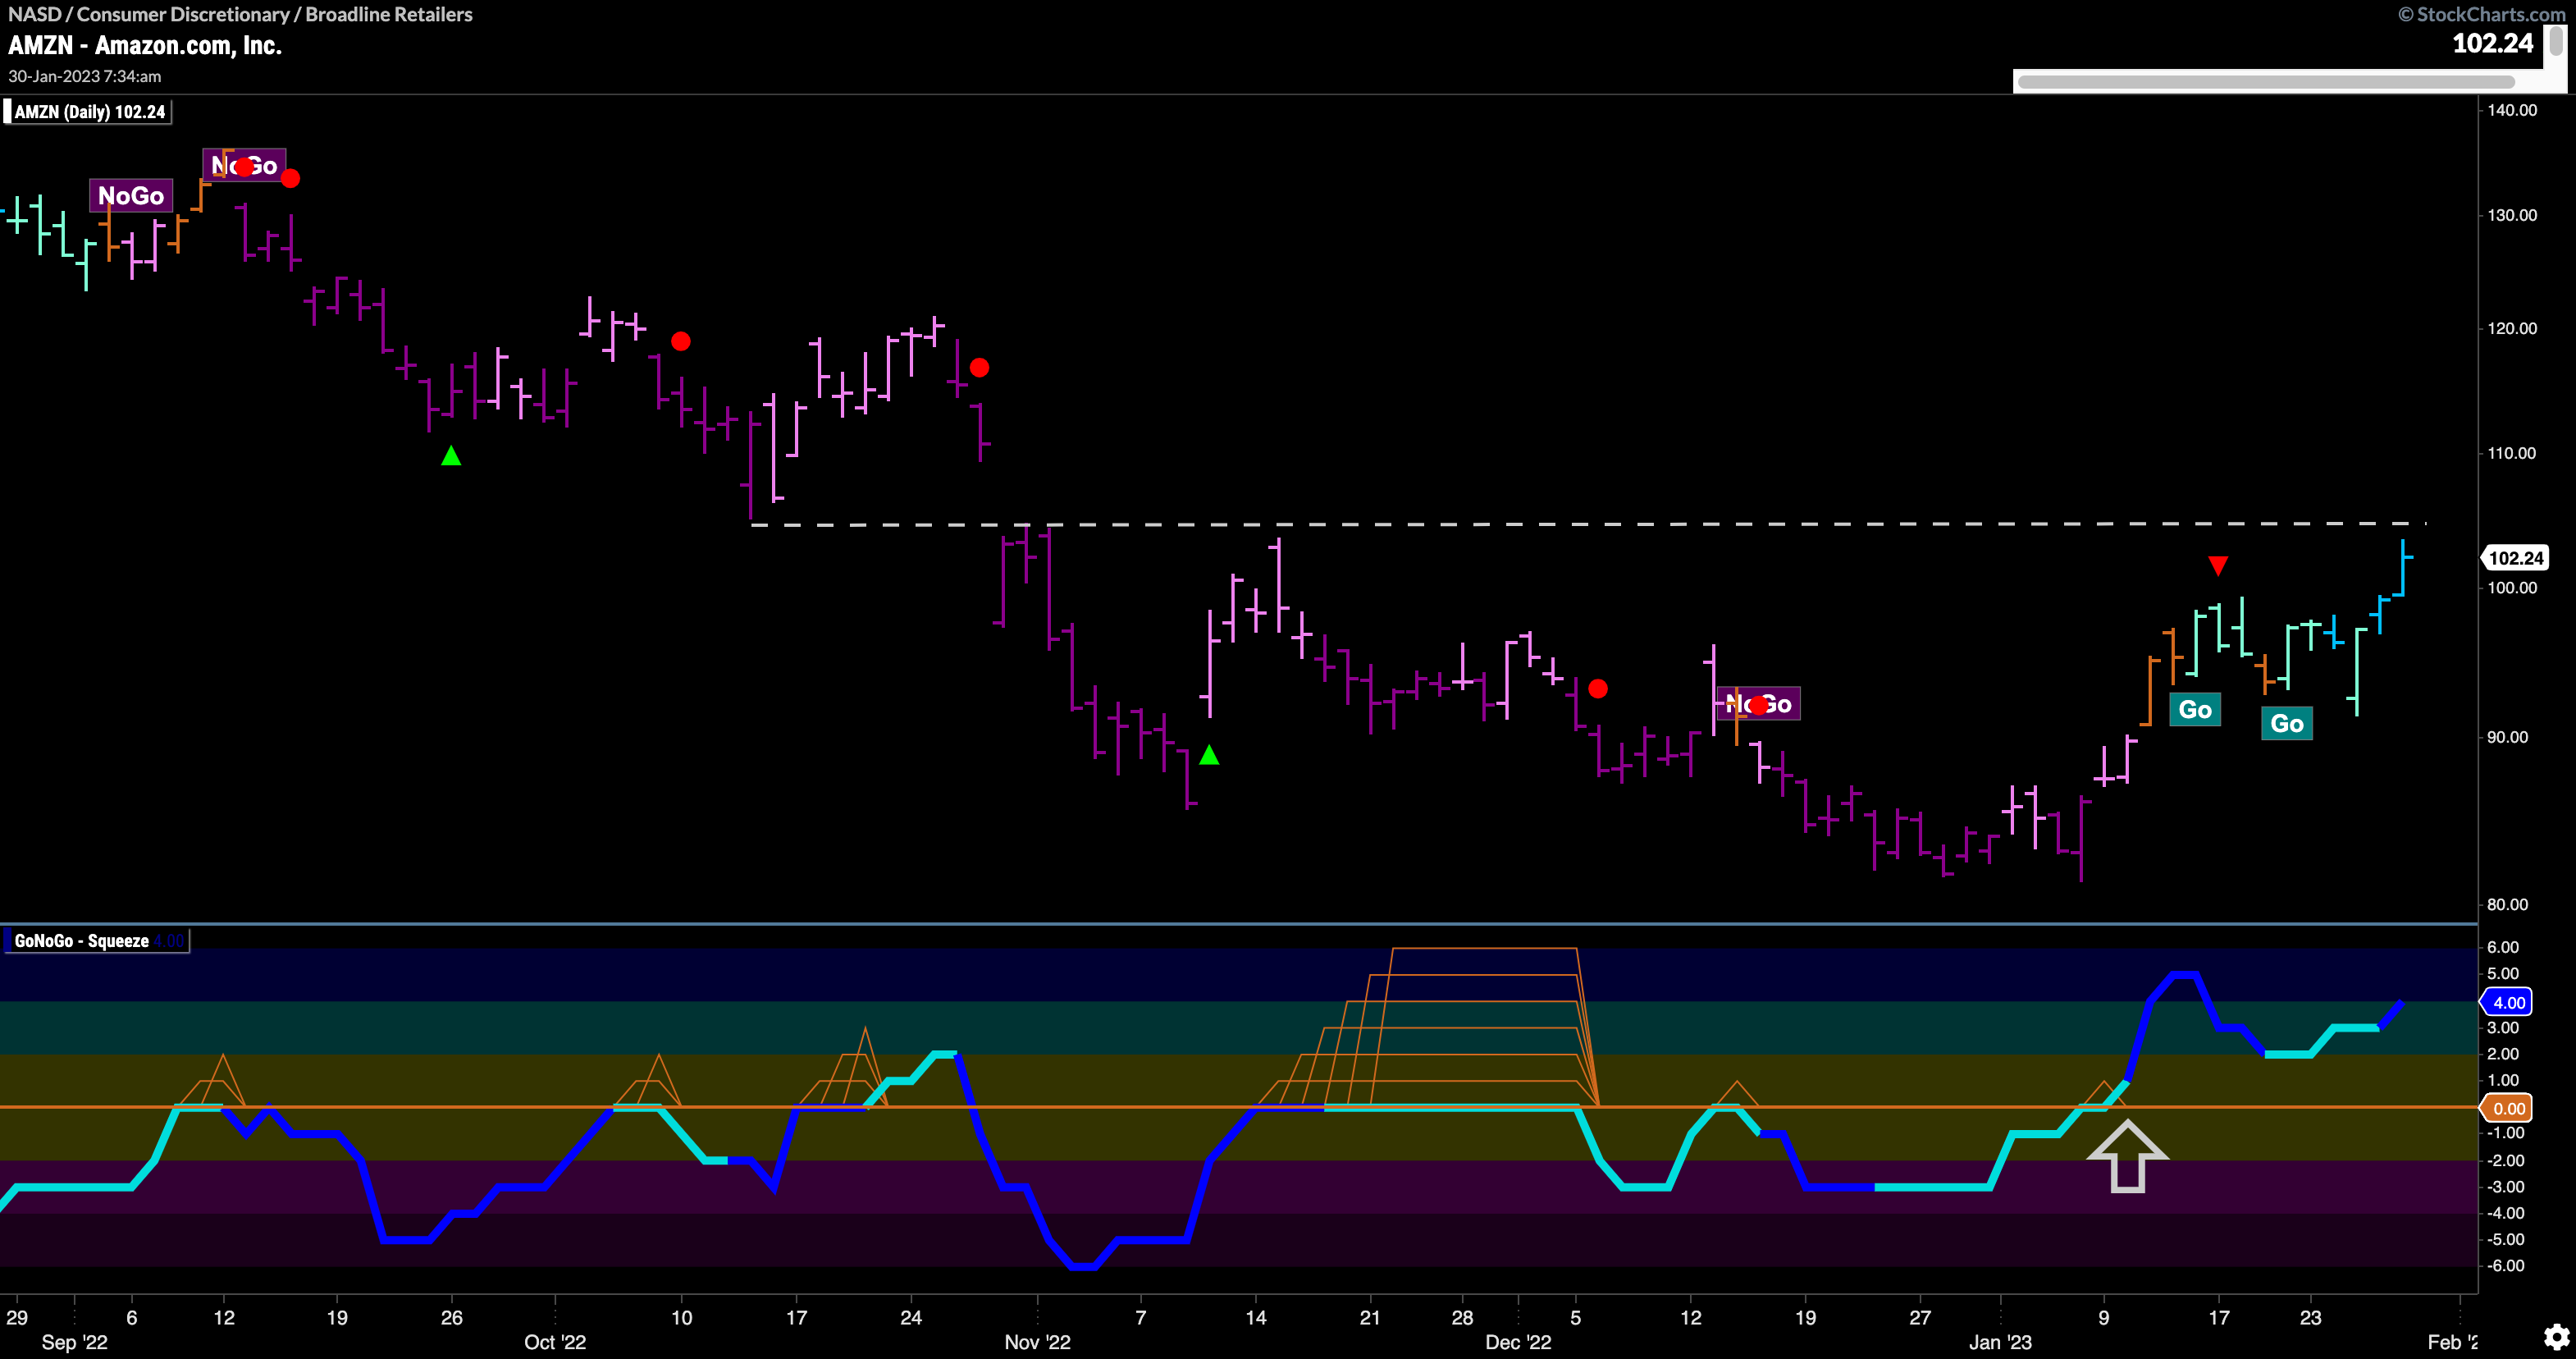
$AMZN Trying to Climb Higher
$AMZN is another stock in the newly outperforming discretionary sector that is looking to make moves. Having seen GoNoGo Oscillator break above the zero line earlier in the month we then saw a “Go” trend identified which has persisted for a few weeks. Now, as that trend strengthens, we see that it is running up against resistance from prior highs and lows. We will watch to see if there is enough momentum for price to break higher and continue in its “Go” trend.
