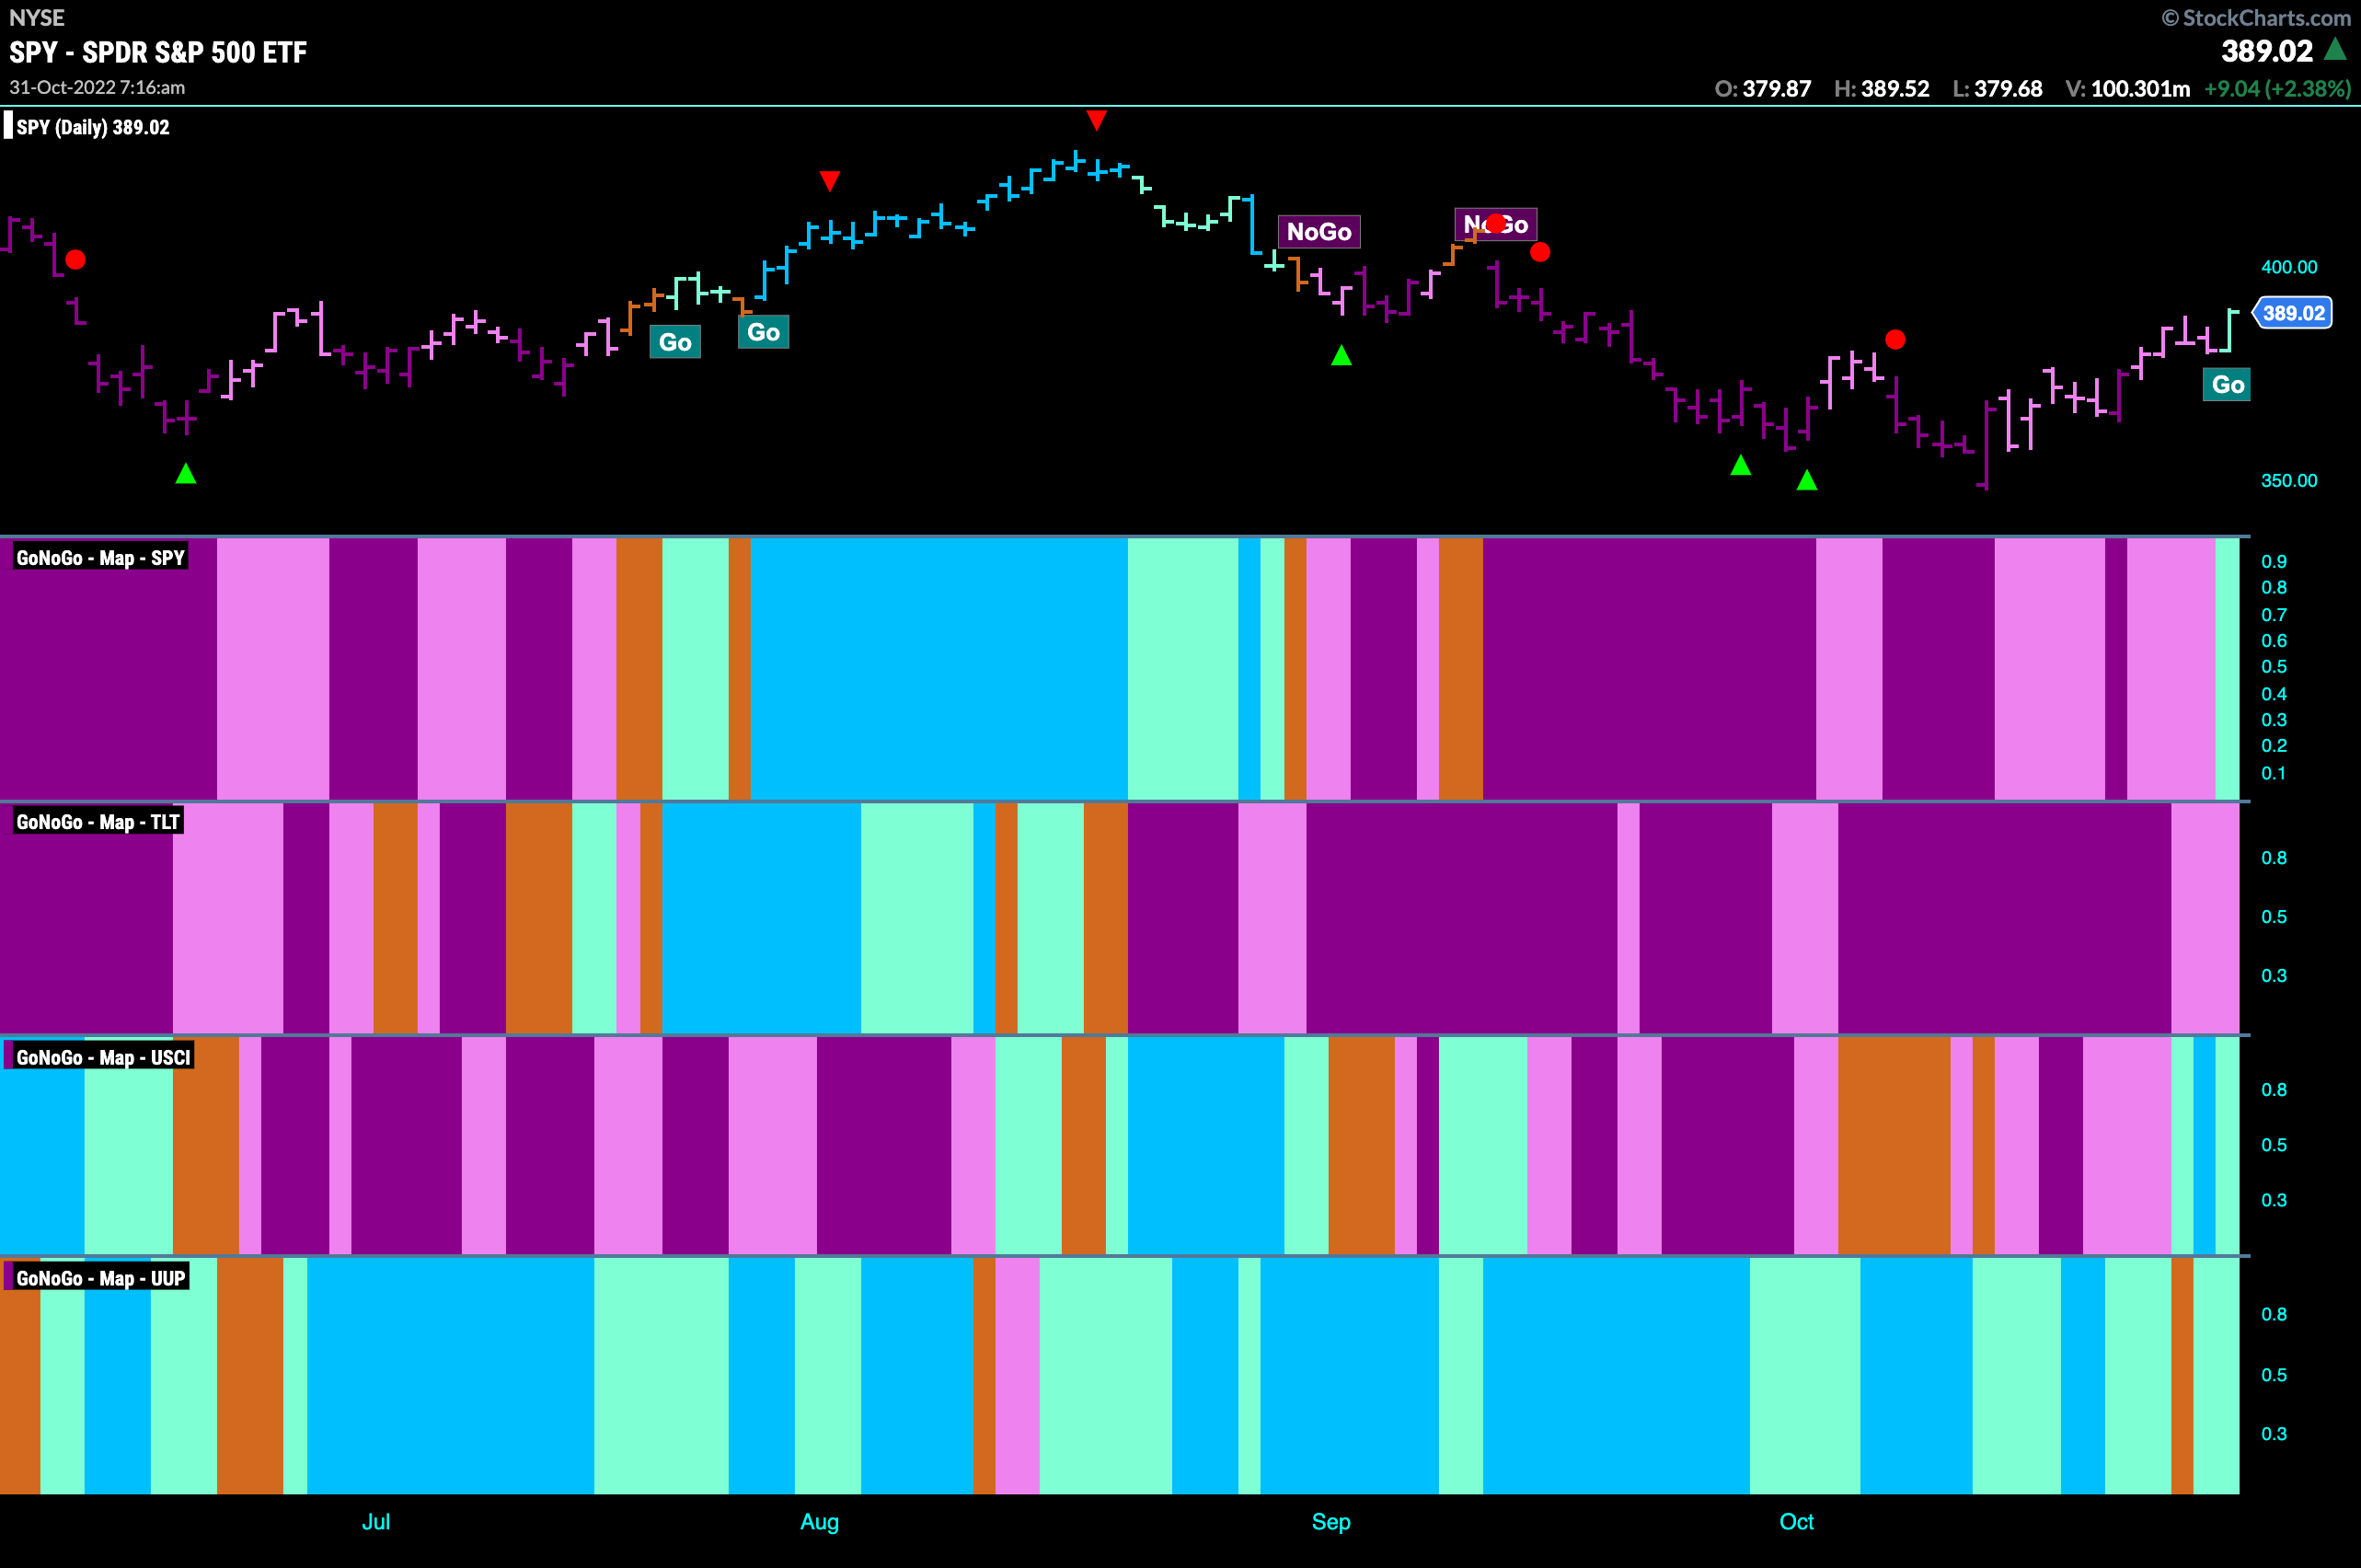
Good morning and welcome to this week’s Flight Path. Let’s take a look at the GoNoGo Asset map below. What is this we see? I spy a “Go” trend in equities as well as commodities. We will look this week to see if these new trends can find some stability. Treasury bond prices remain in “NoGo” albeit painting weaker pink bars and the dollar was able to rebound after a midweek amber “Go Fish” bar. We will look at dollar price action shortly.
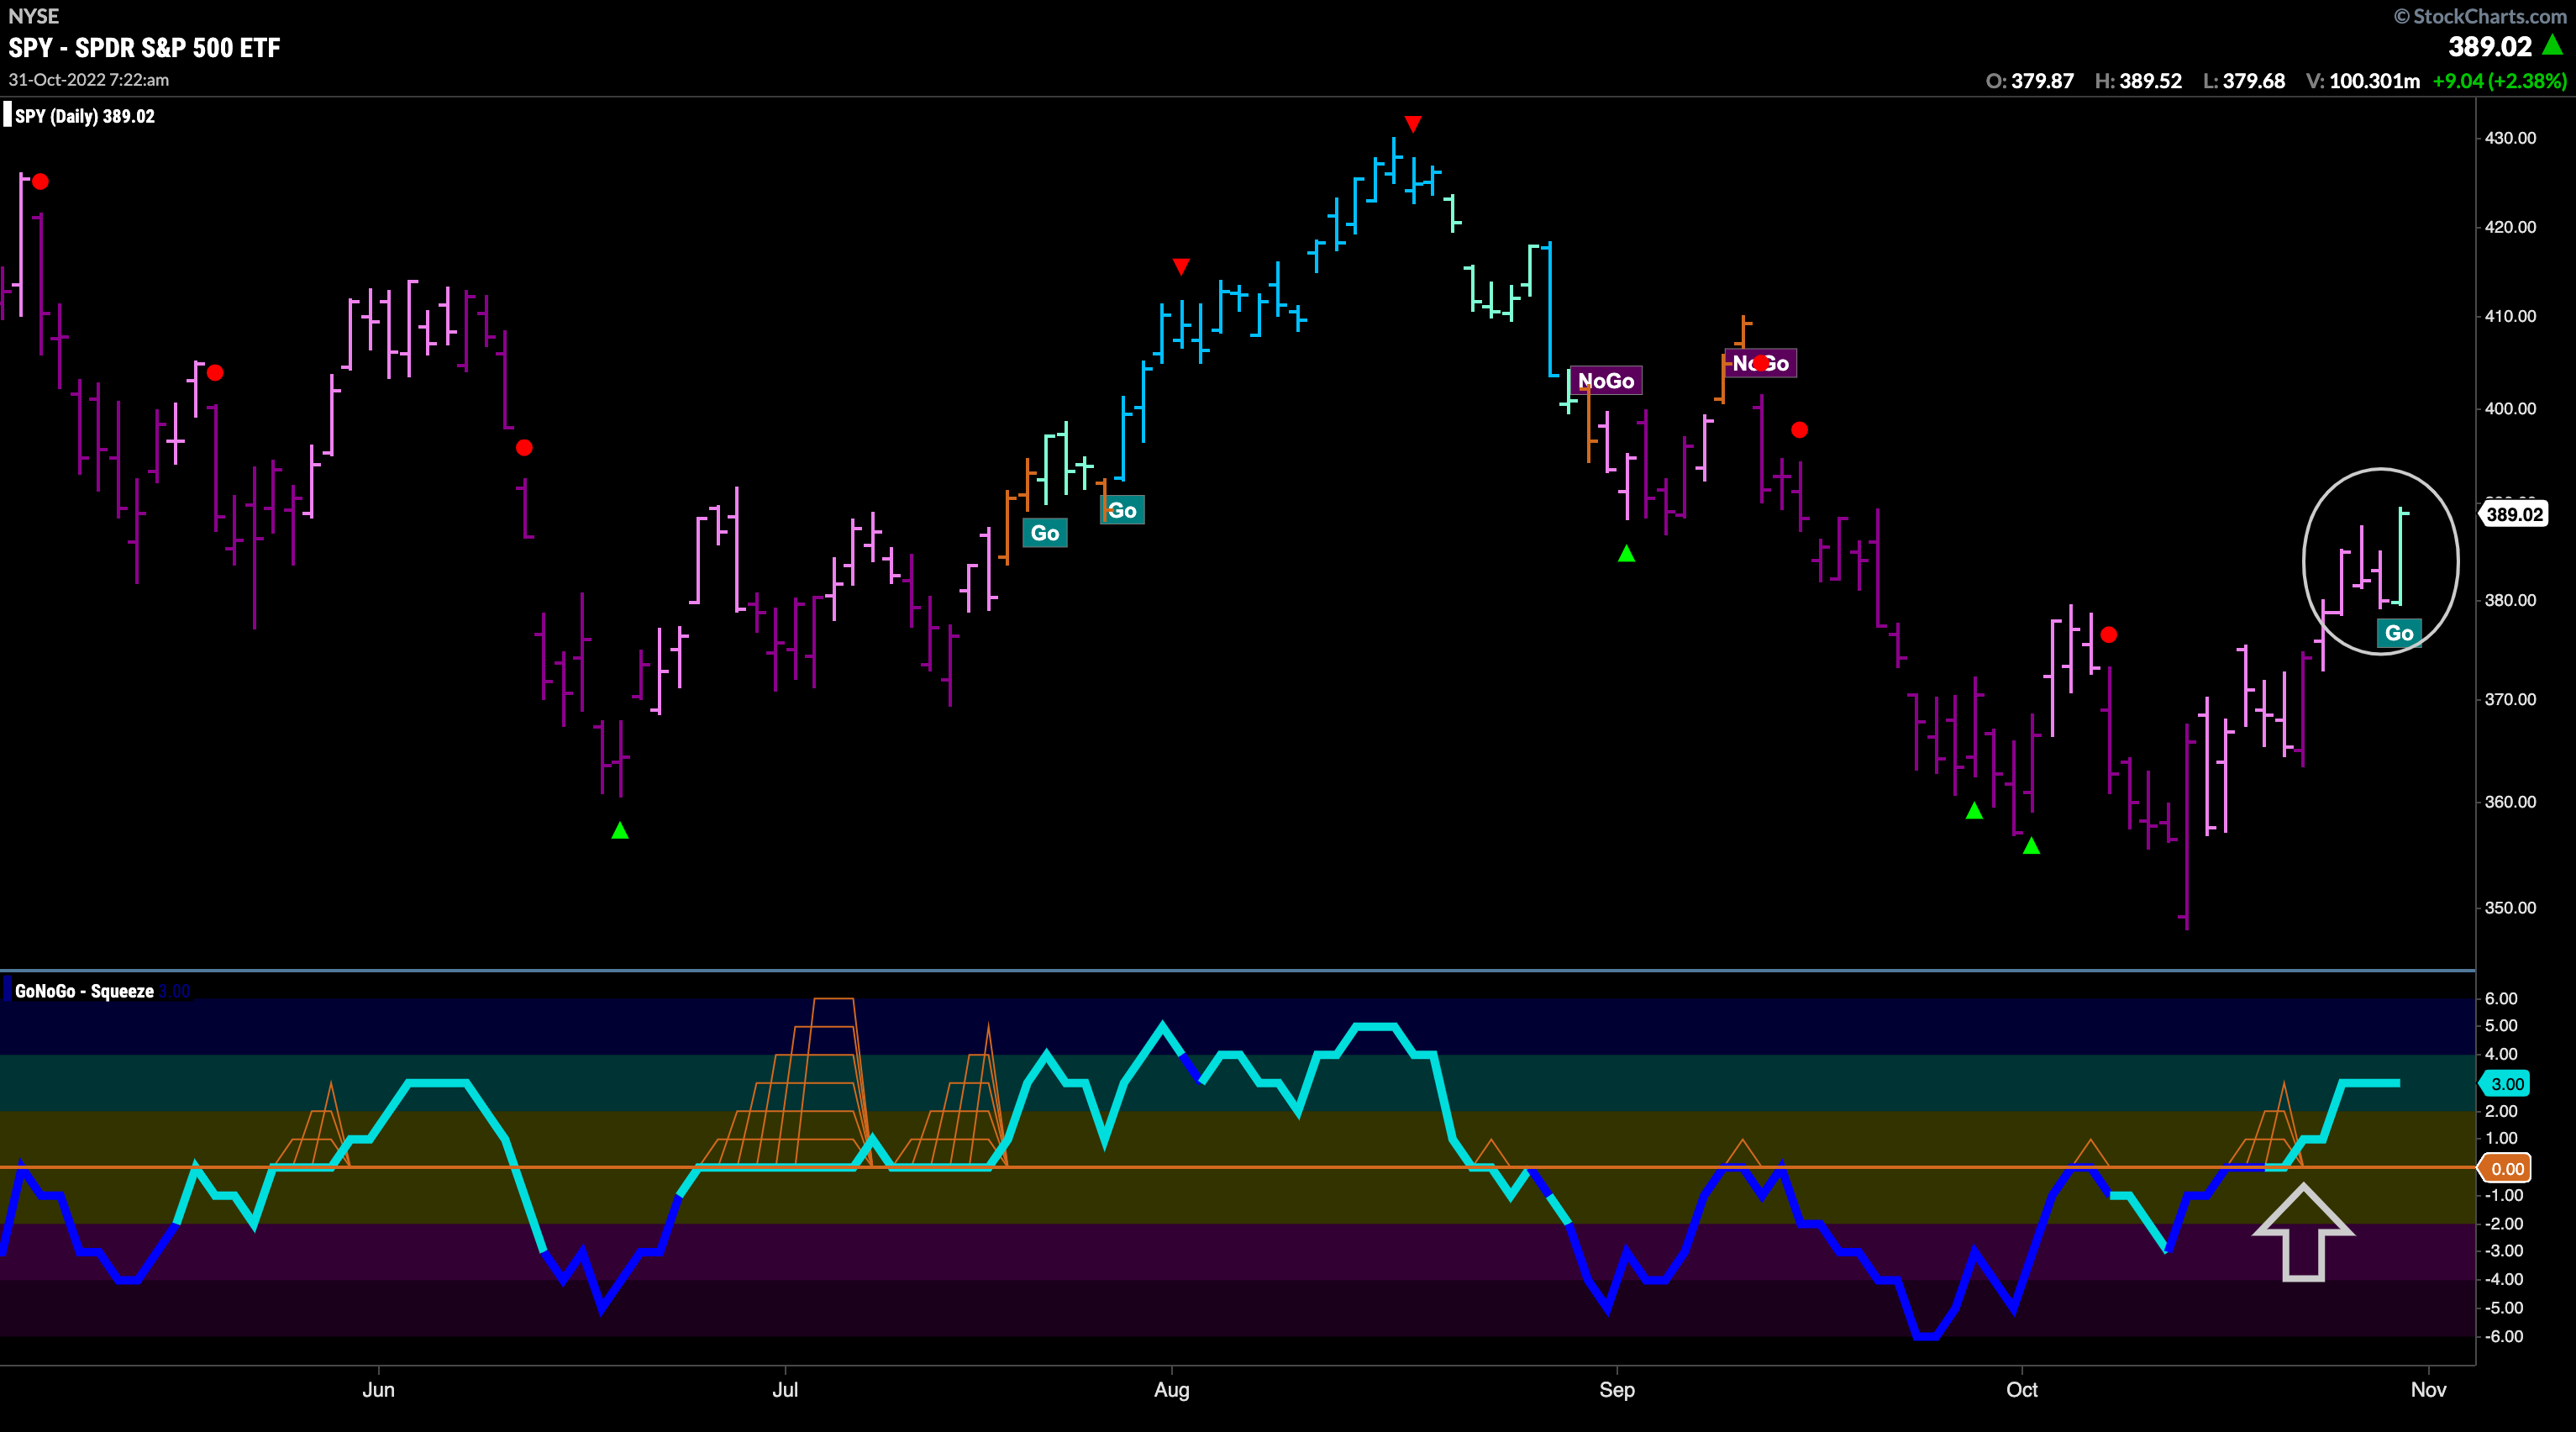
S&P 500 Paints First “Go” bar
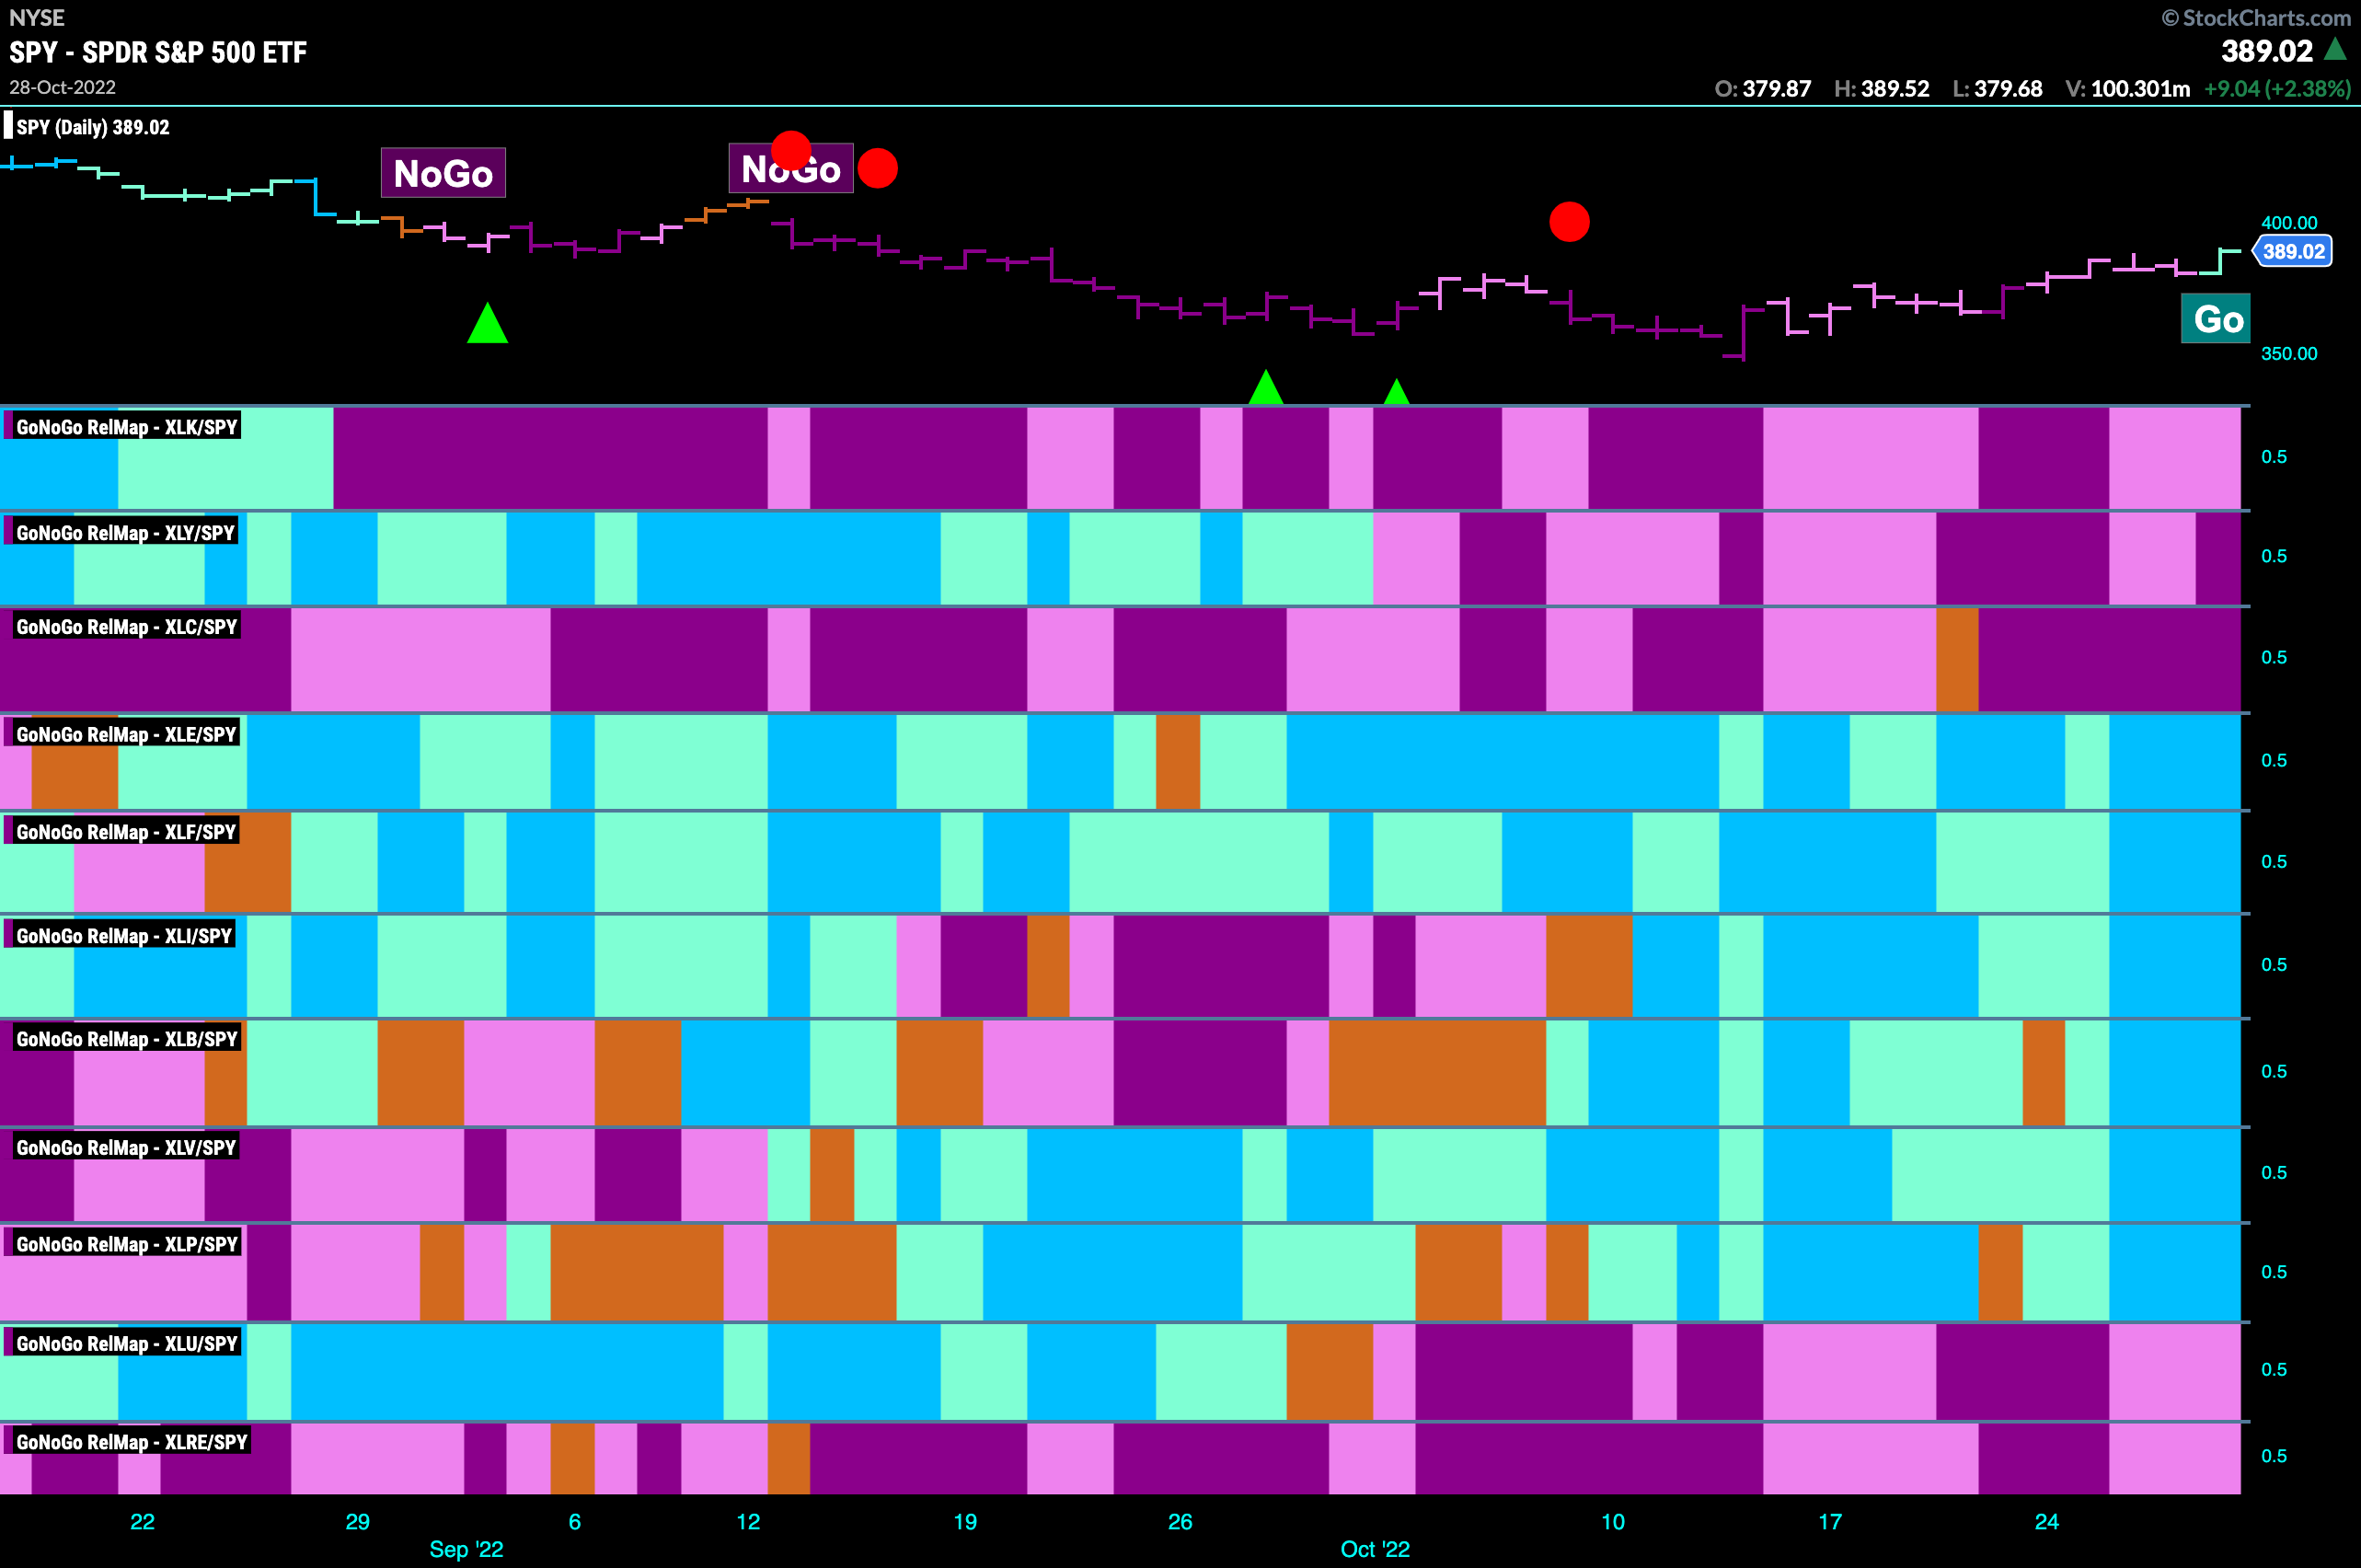
This week saw price action follow through after GoNoGo Oscillator broke through the zero line into positive territory a week ago. As price rallied off the mid October lows we saw GoNoGo Oscillator burst above zero. This gave price the momentum it needed to move higher and now we see the beginning of a “Go” trend in equities on a daily basis.
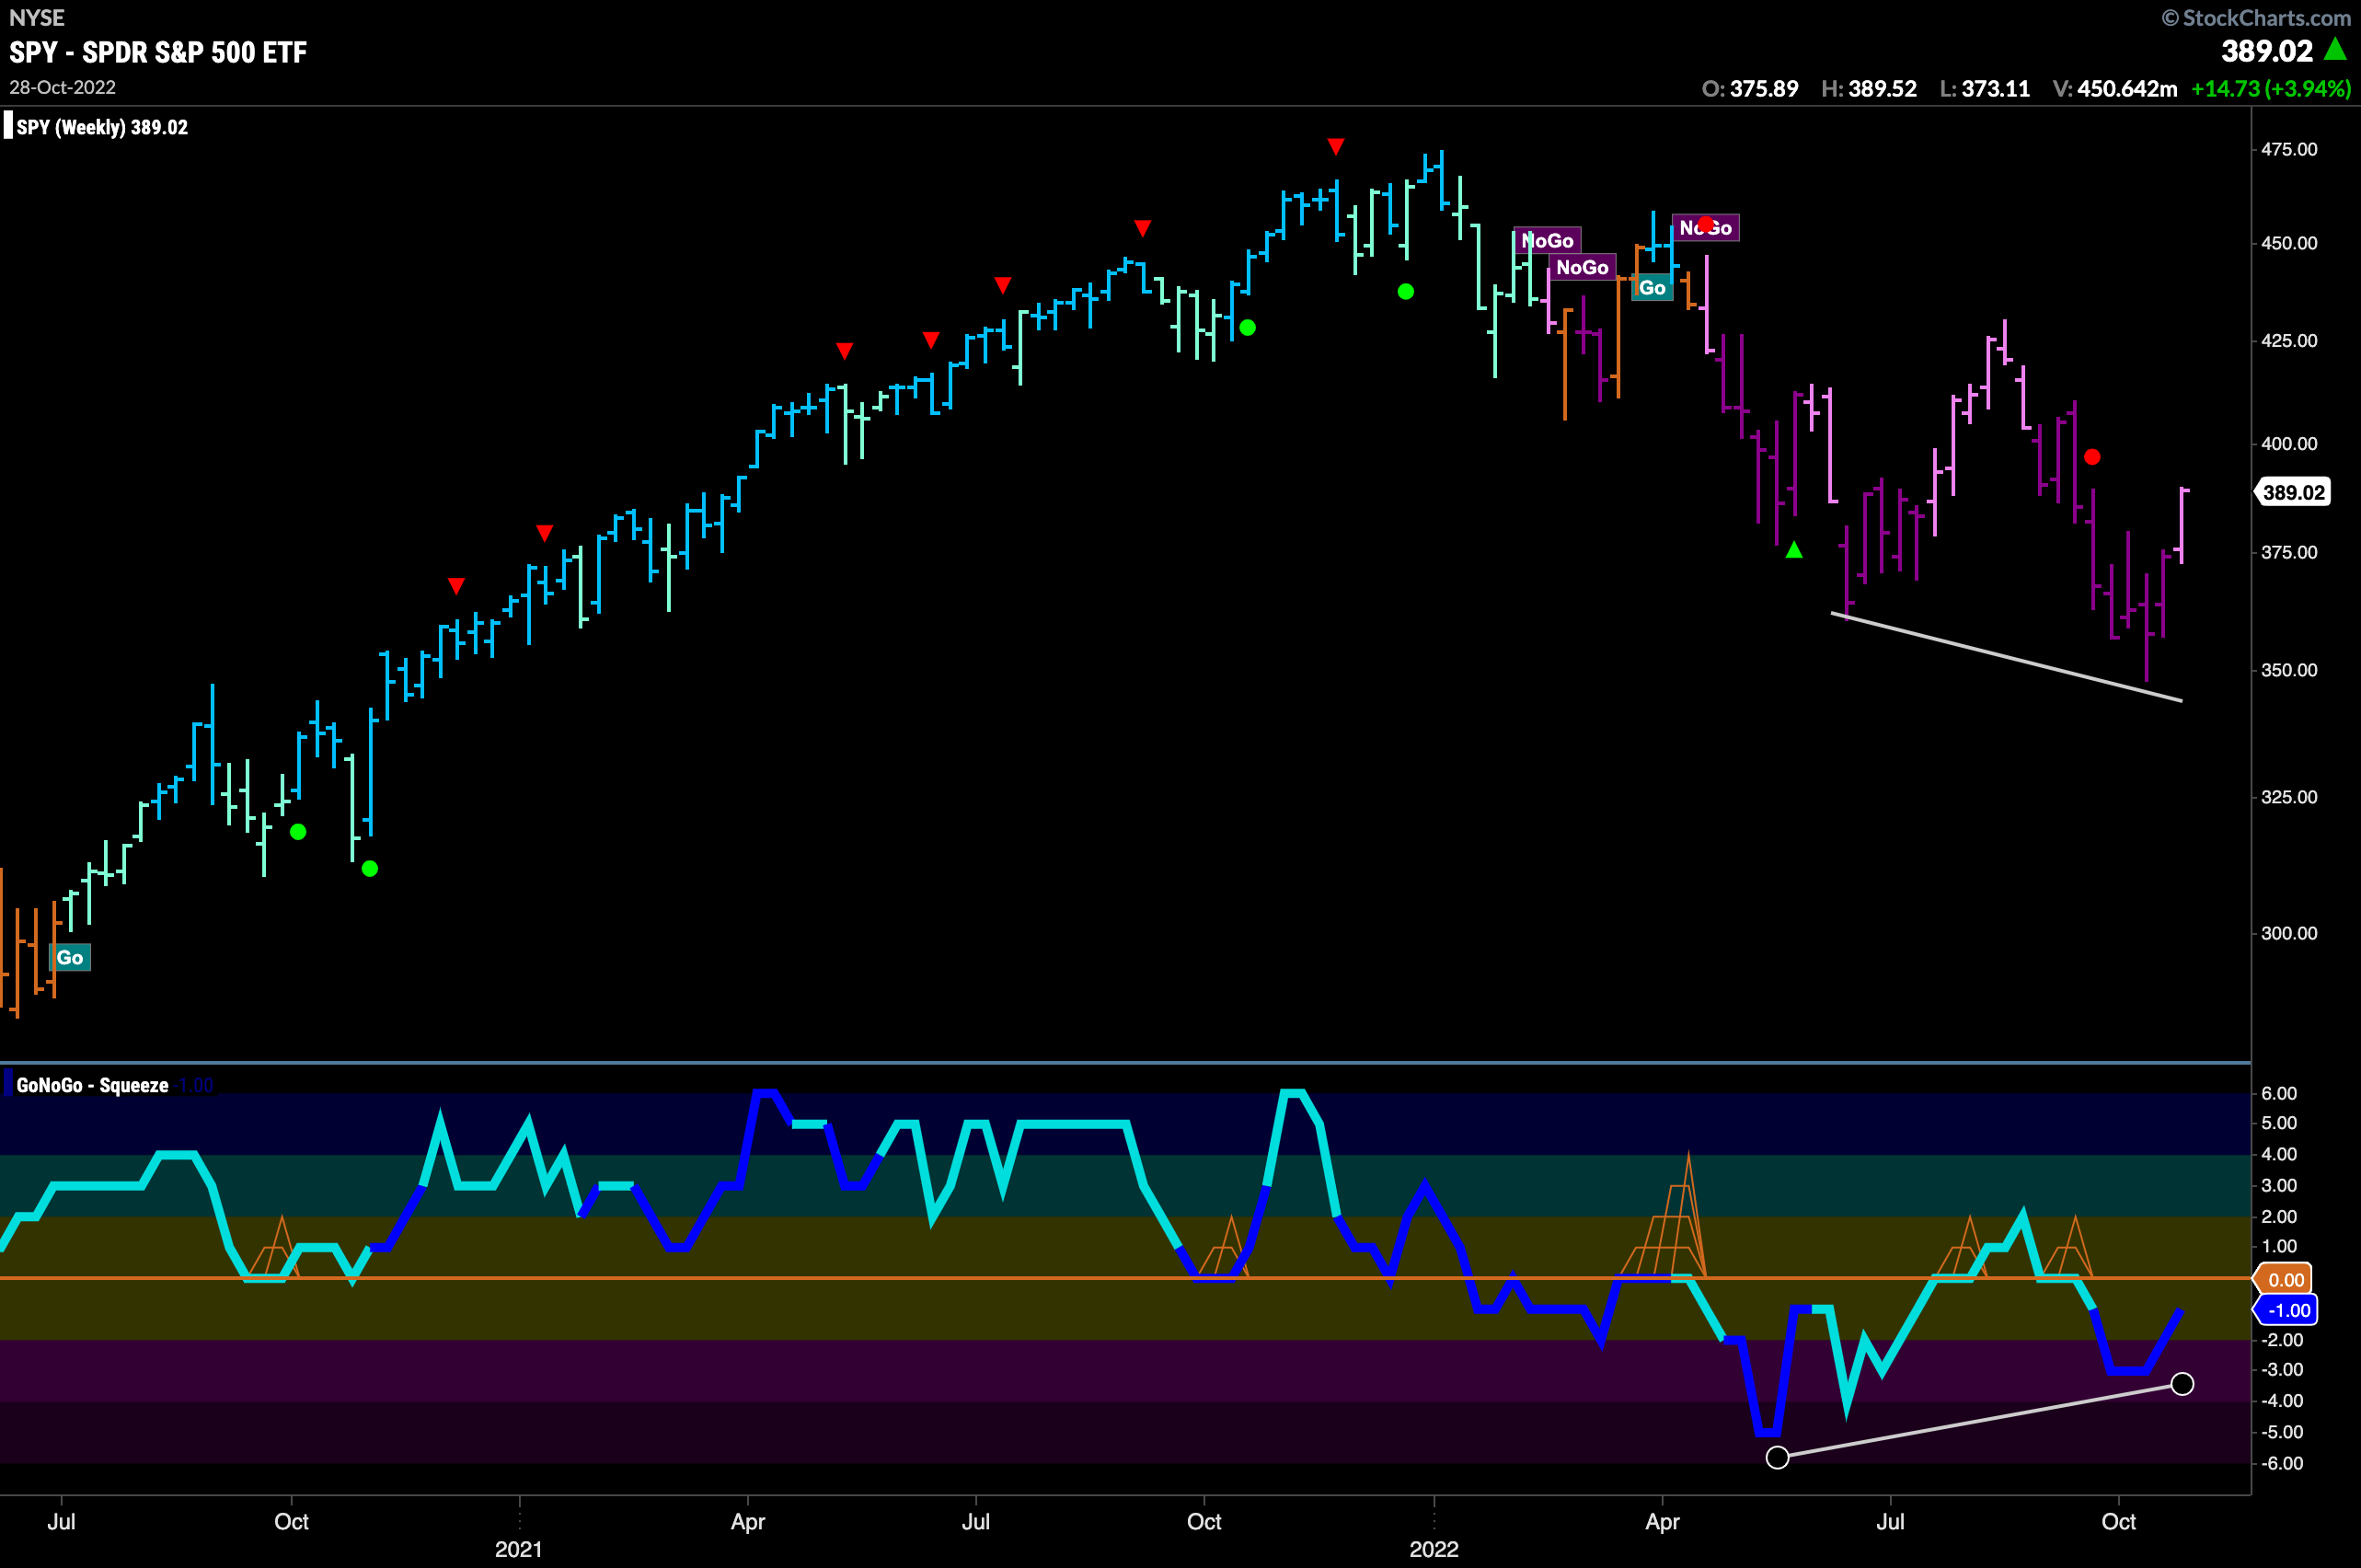
Of course, this year has been defined by “relief rallies” and not “Go” trends. We will keep the daily price action in context as we look at the weekly chart and see that the “NoGo” is still in place having just made a new lower low. The last week’s bar ended pink, showing some weakness in the “NoGo” trend and those looking to be bullish will spot the divergence between price and the oscillator. We will need to see GoNoGo Oscillator break above the zero line to be able to consider this larger time frame “NoGo” in real trouble.
Treasury Rates Cool
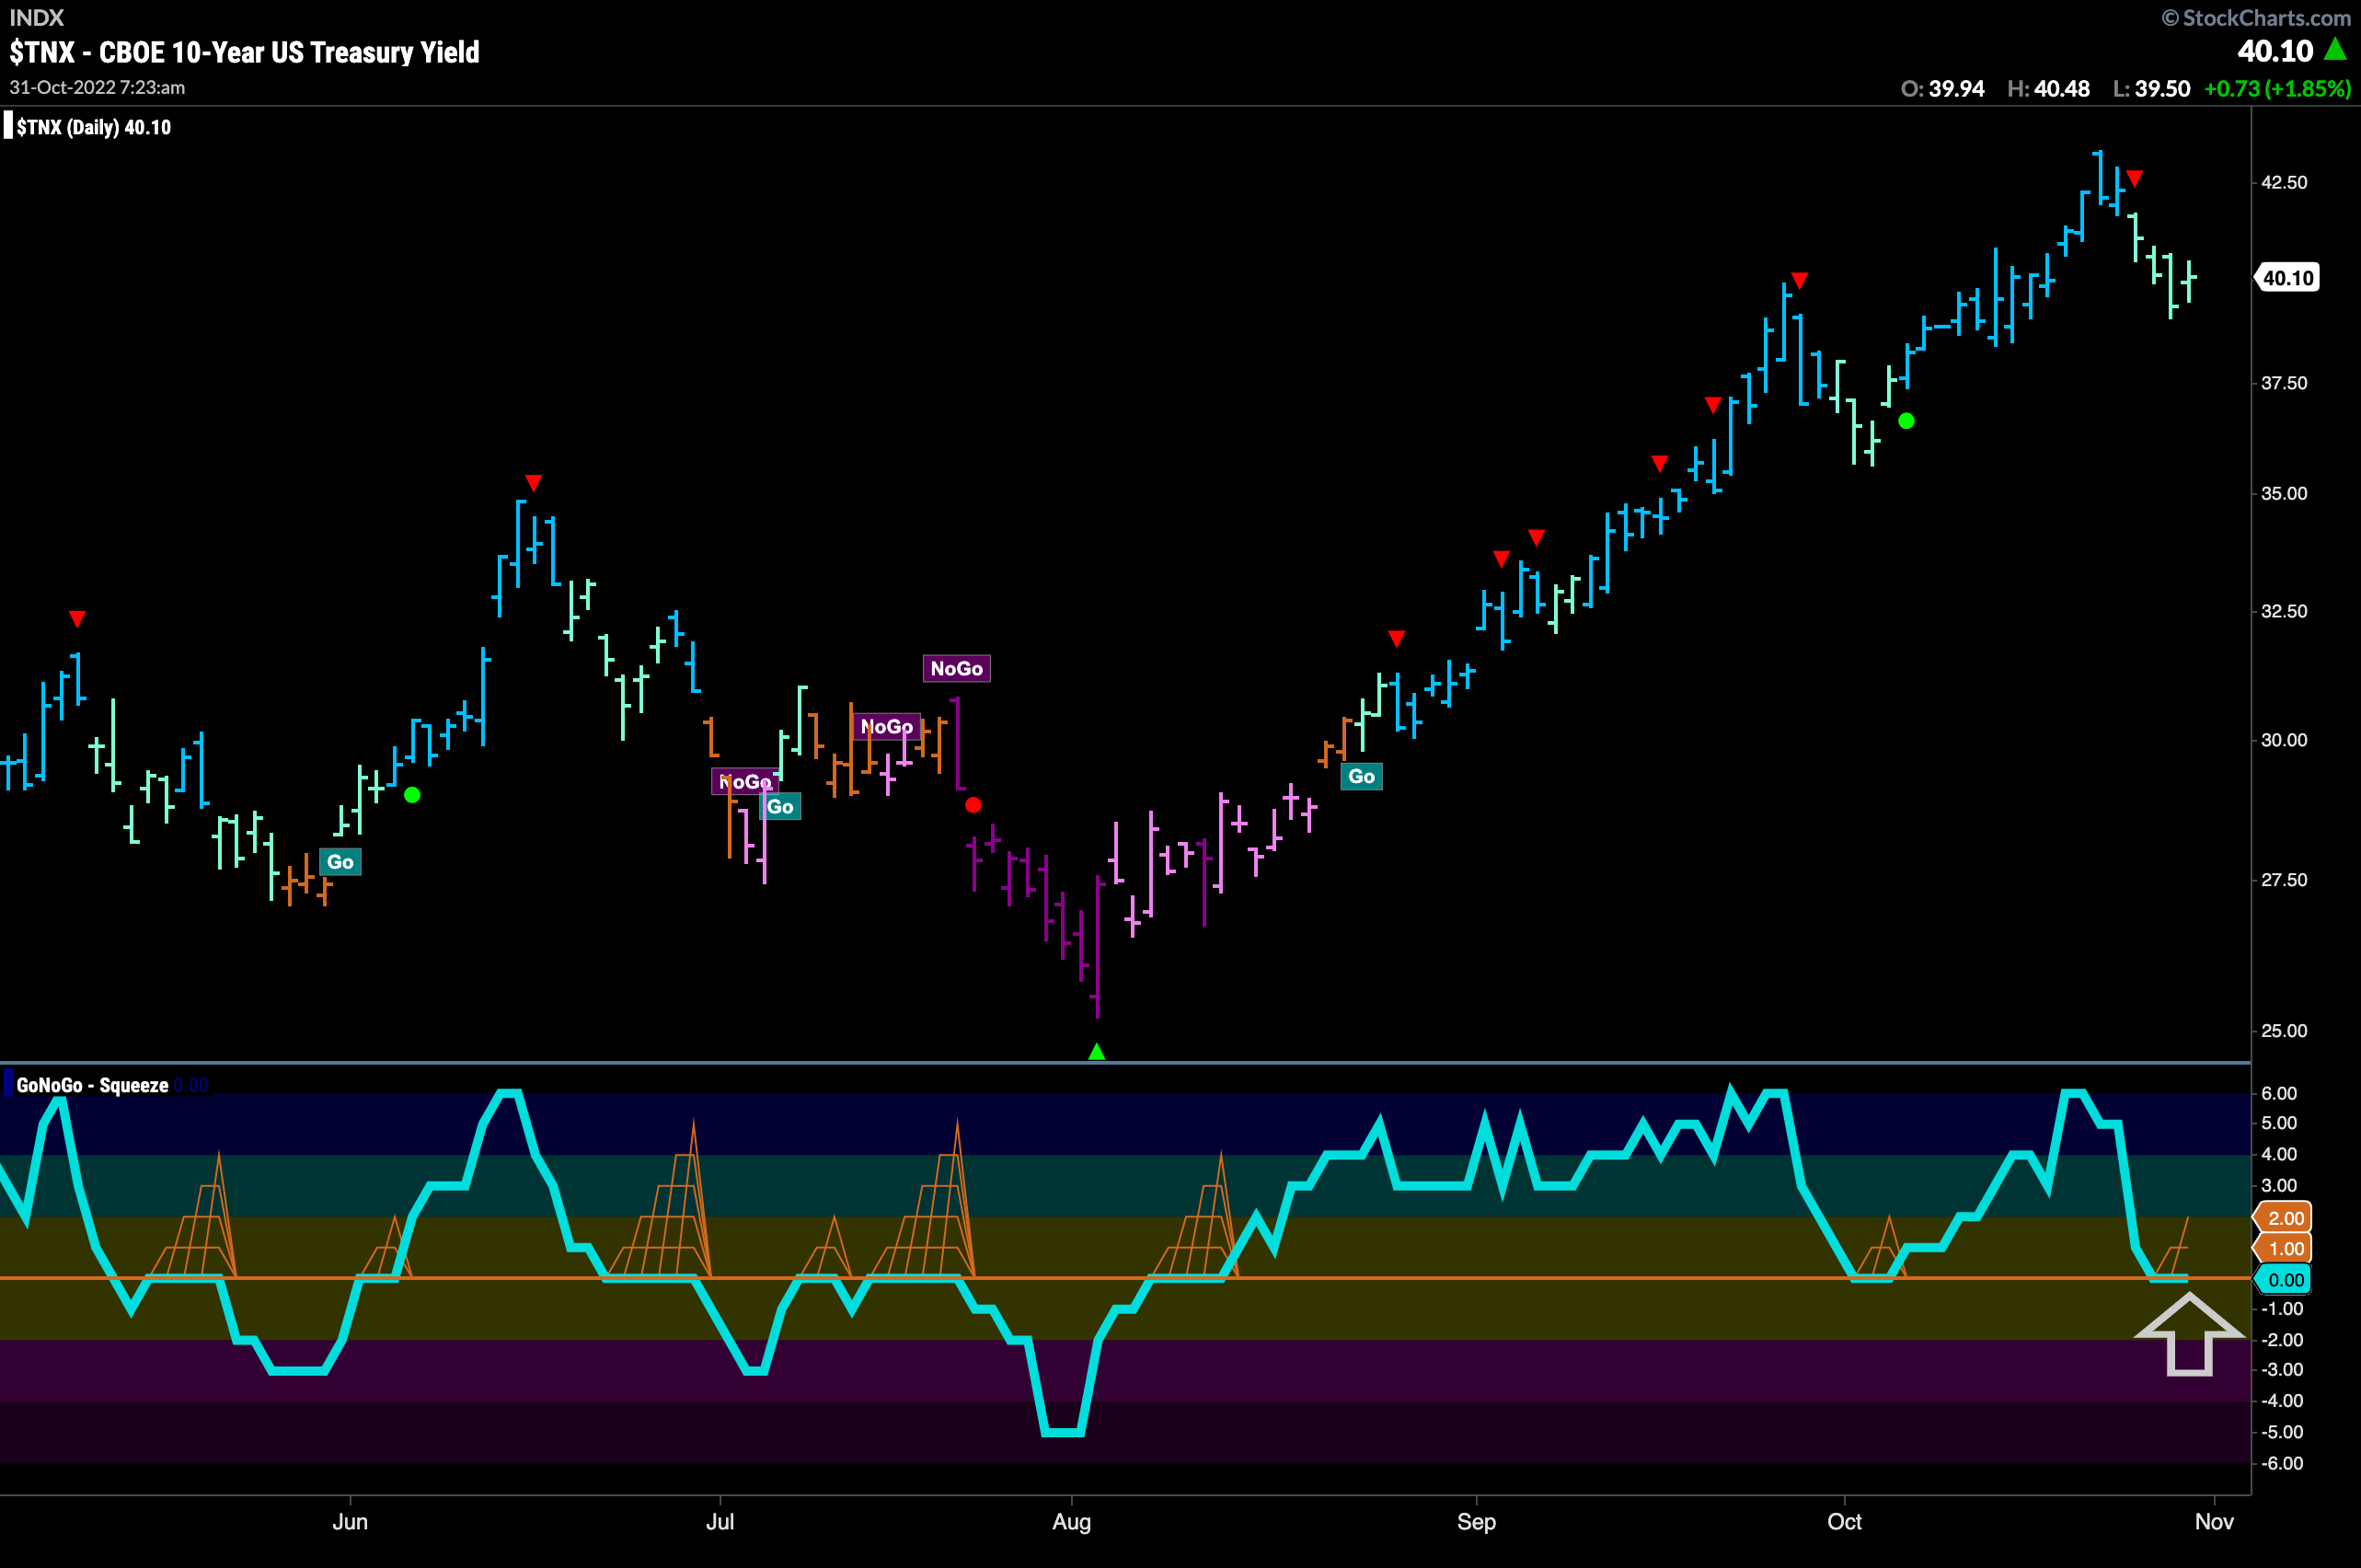
Treasury rates hit a new high a week ago and have fallen from that level this week. GoNoGo Oscillator has crashed quickly to the zero line where we will look to see if we find support. As long as the oscillator finds support at zero we can consider the trend healthy and except further price movement higher.
Dollar in Fight to Hold on to “Go” Trend
We saw last week the reduced volatility that led to the climbing grid of the GoNoGo Squeeze reach a max. We saw GoNoGo Oscillator break out of that Max Squeeze to the downside this week. This is not a healthy sign for the “Go” trend and indeed we saw an amber “Go Fish” bar of uncertainty this week. However, it seems that price may have found support at the September highs for now.

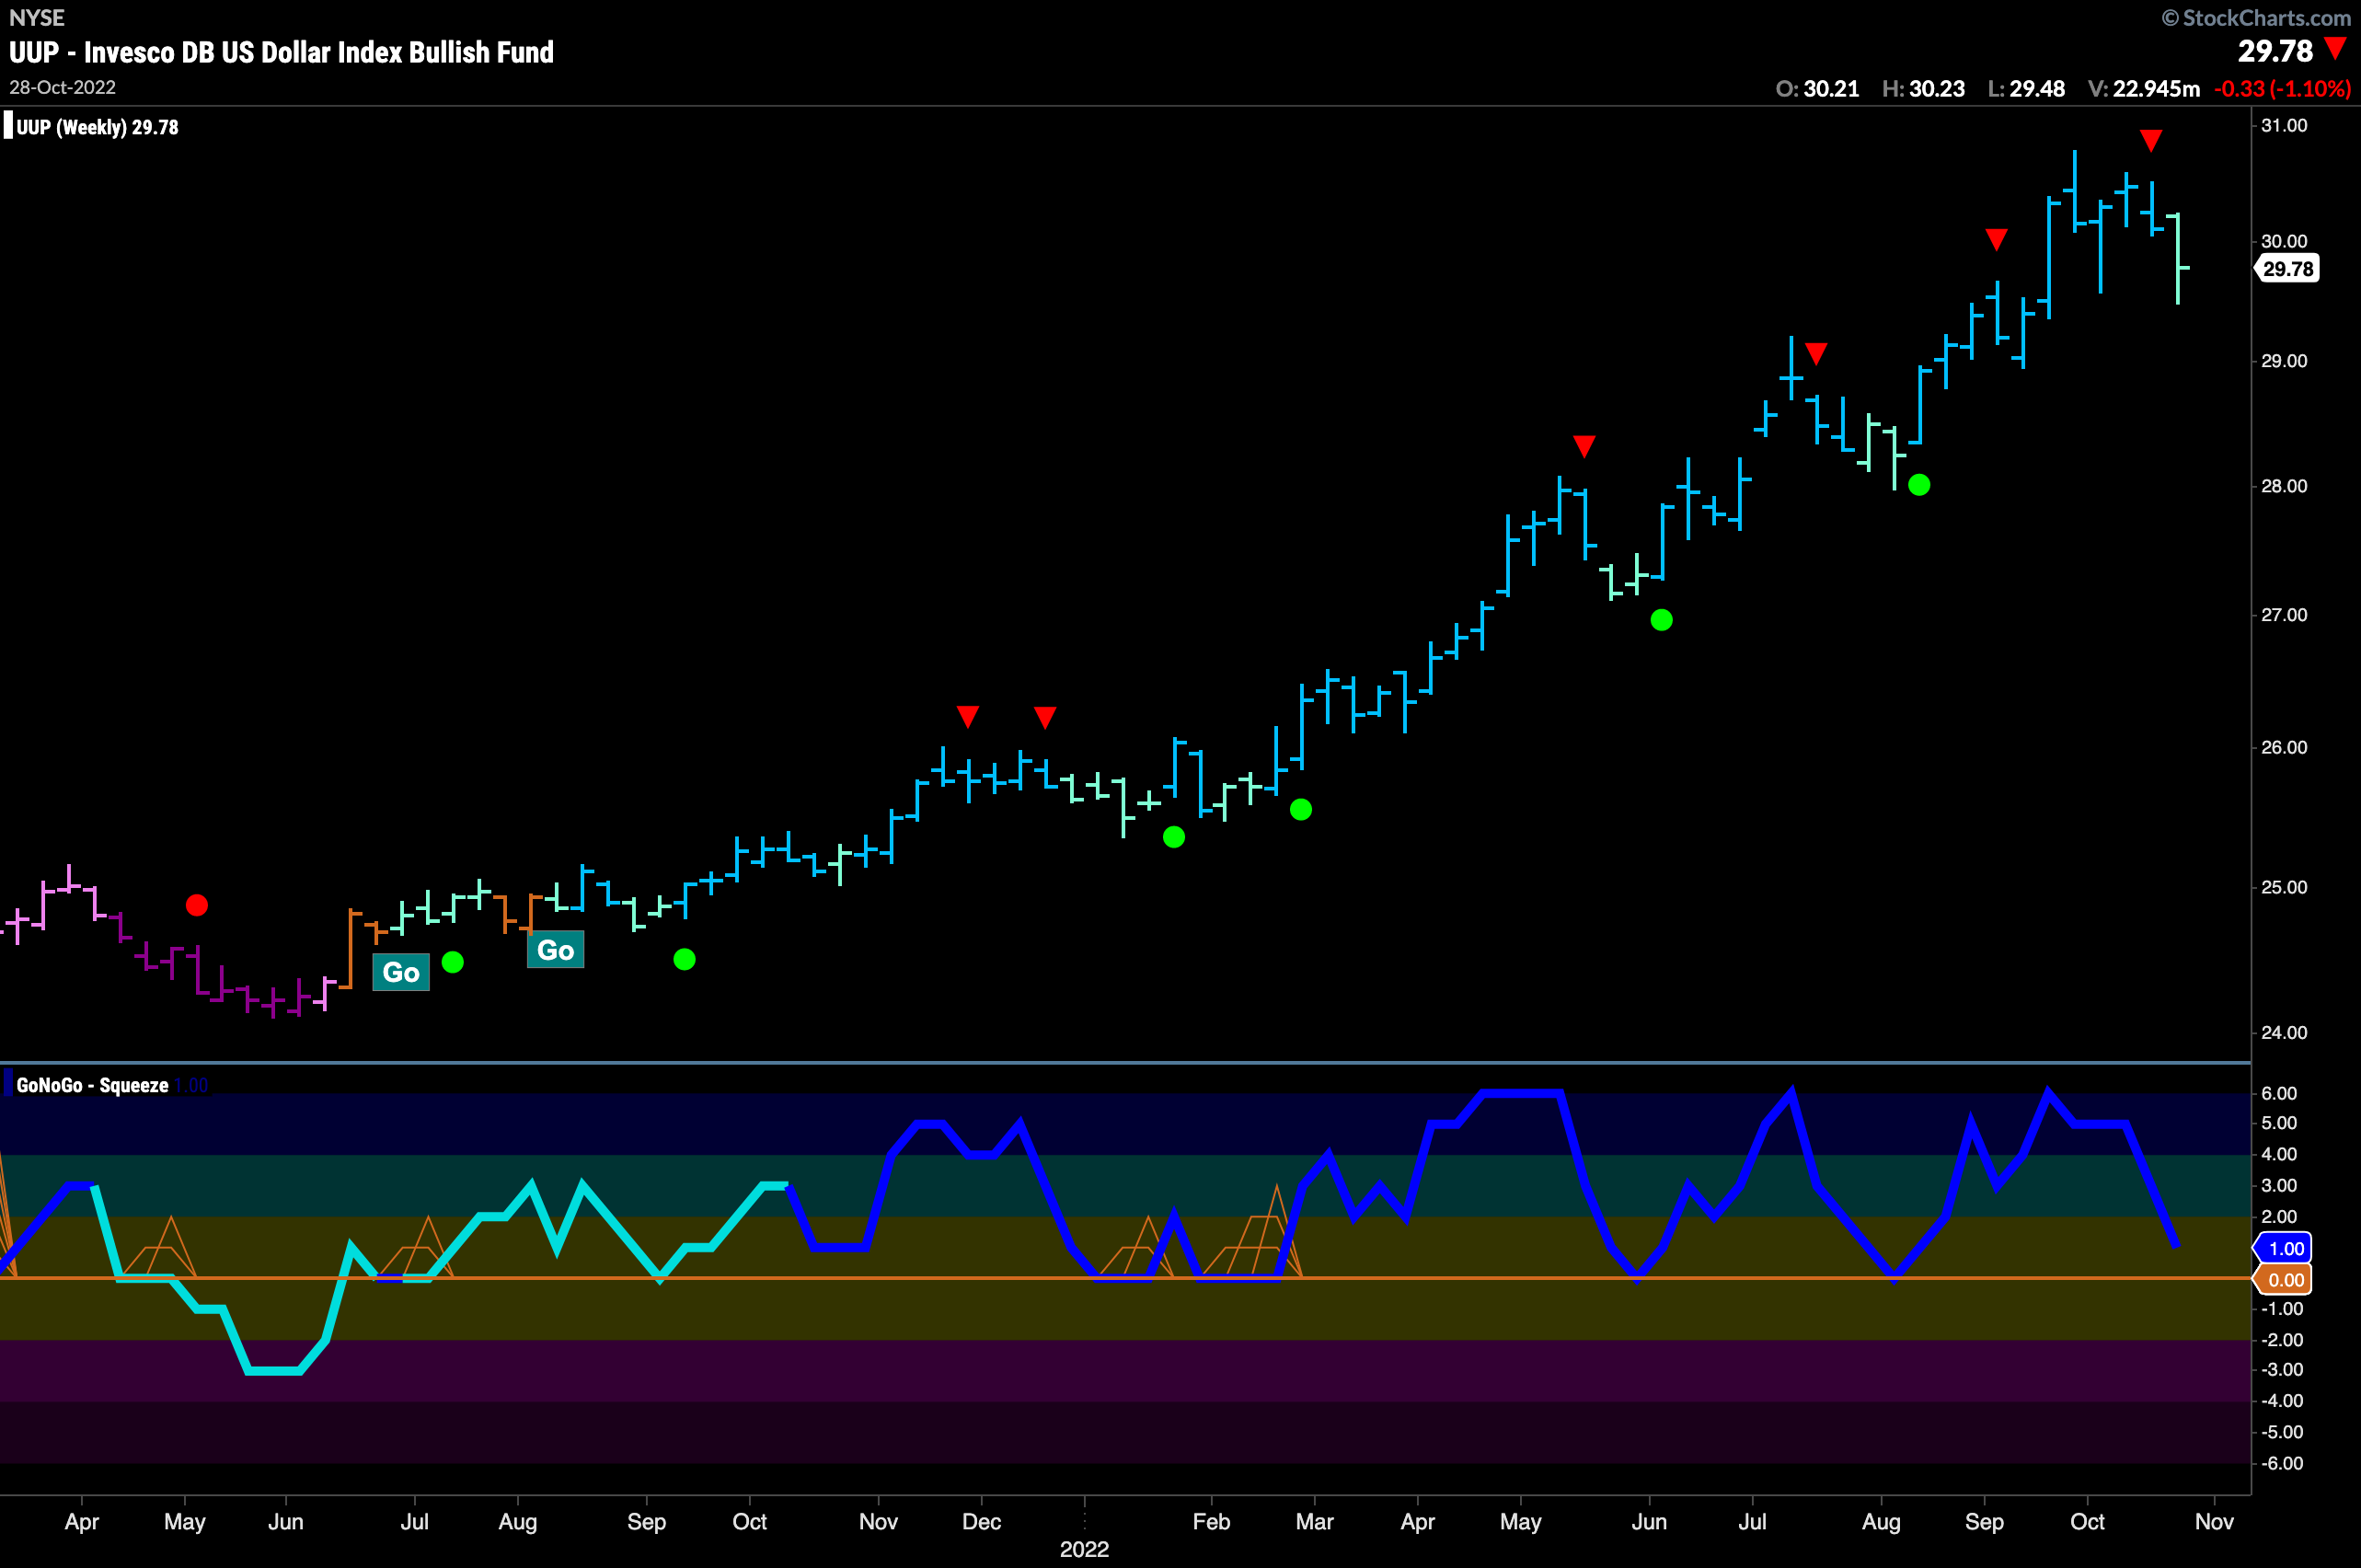
Taking a look at the weekly chart we can see that this daily price movement is in the context of a very robust larger “Go” trend. We do see a weaker aqua “Go” bar and GoNoGo Oscillator falling toward the zero line. We will watch closely to see if support is found at the zero line on this larger time frame chart.
Oil Emerges to Paint “Go” bars
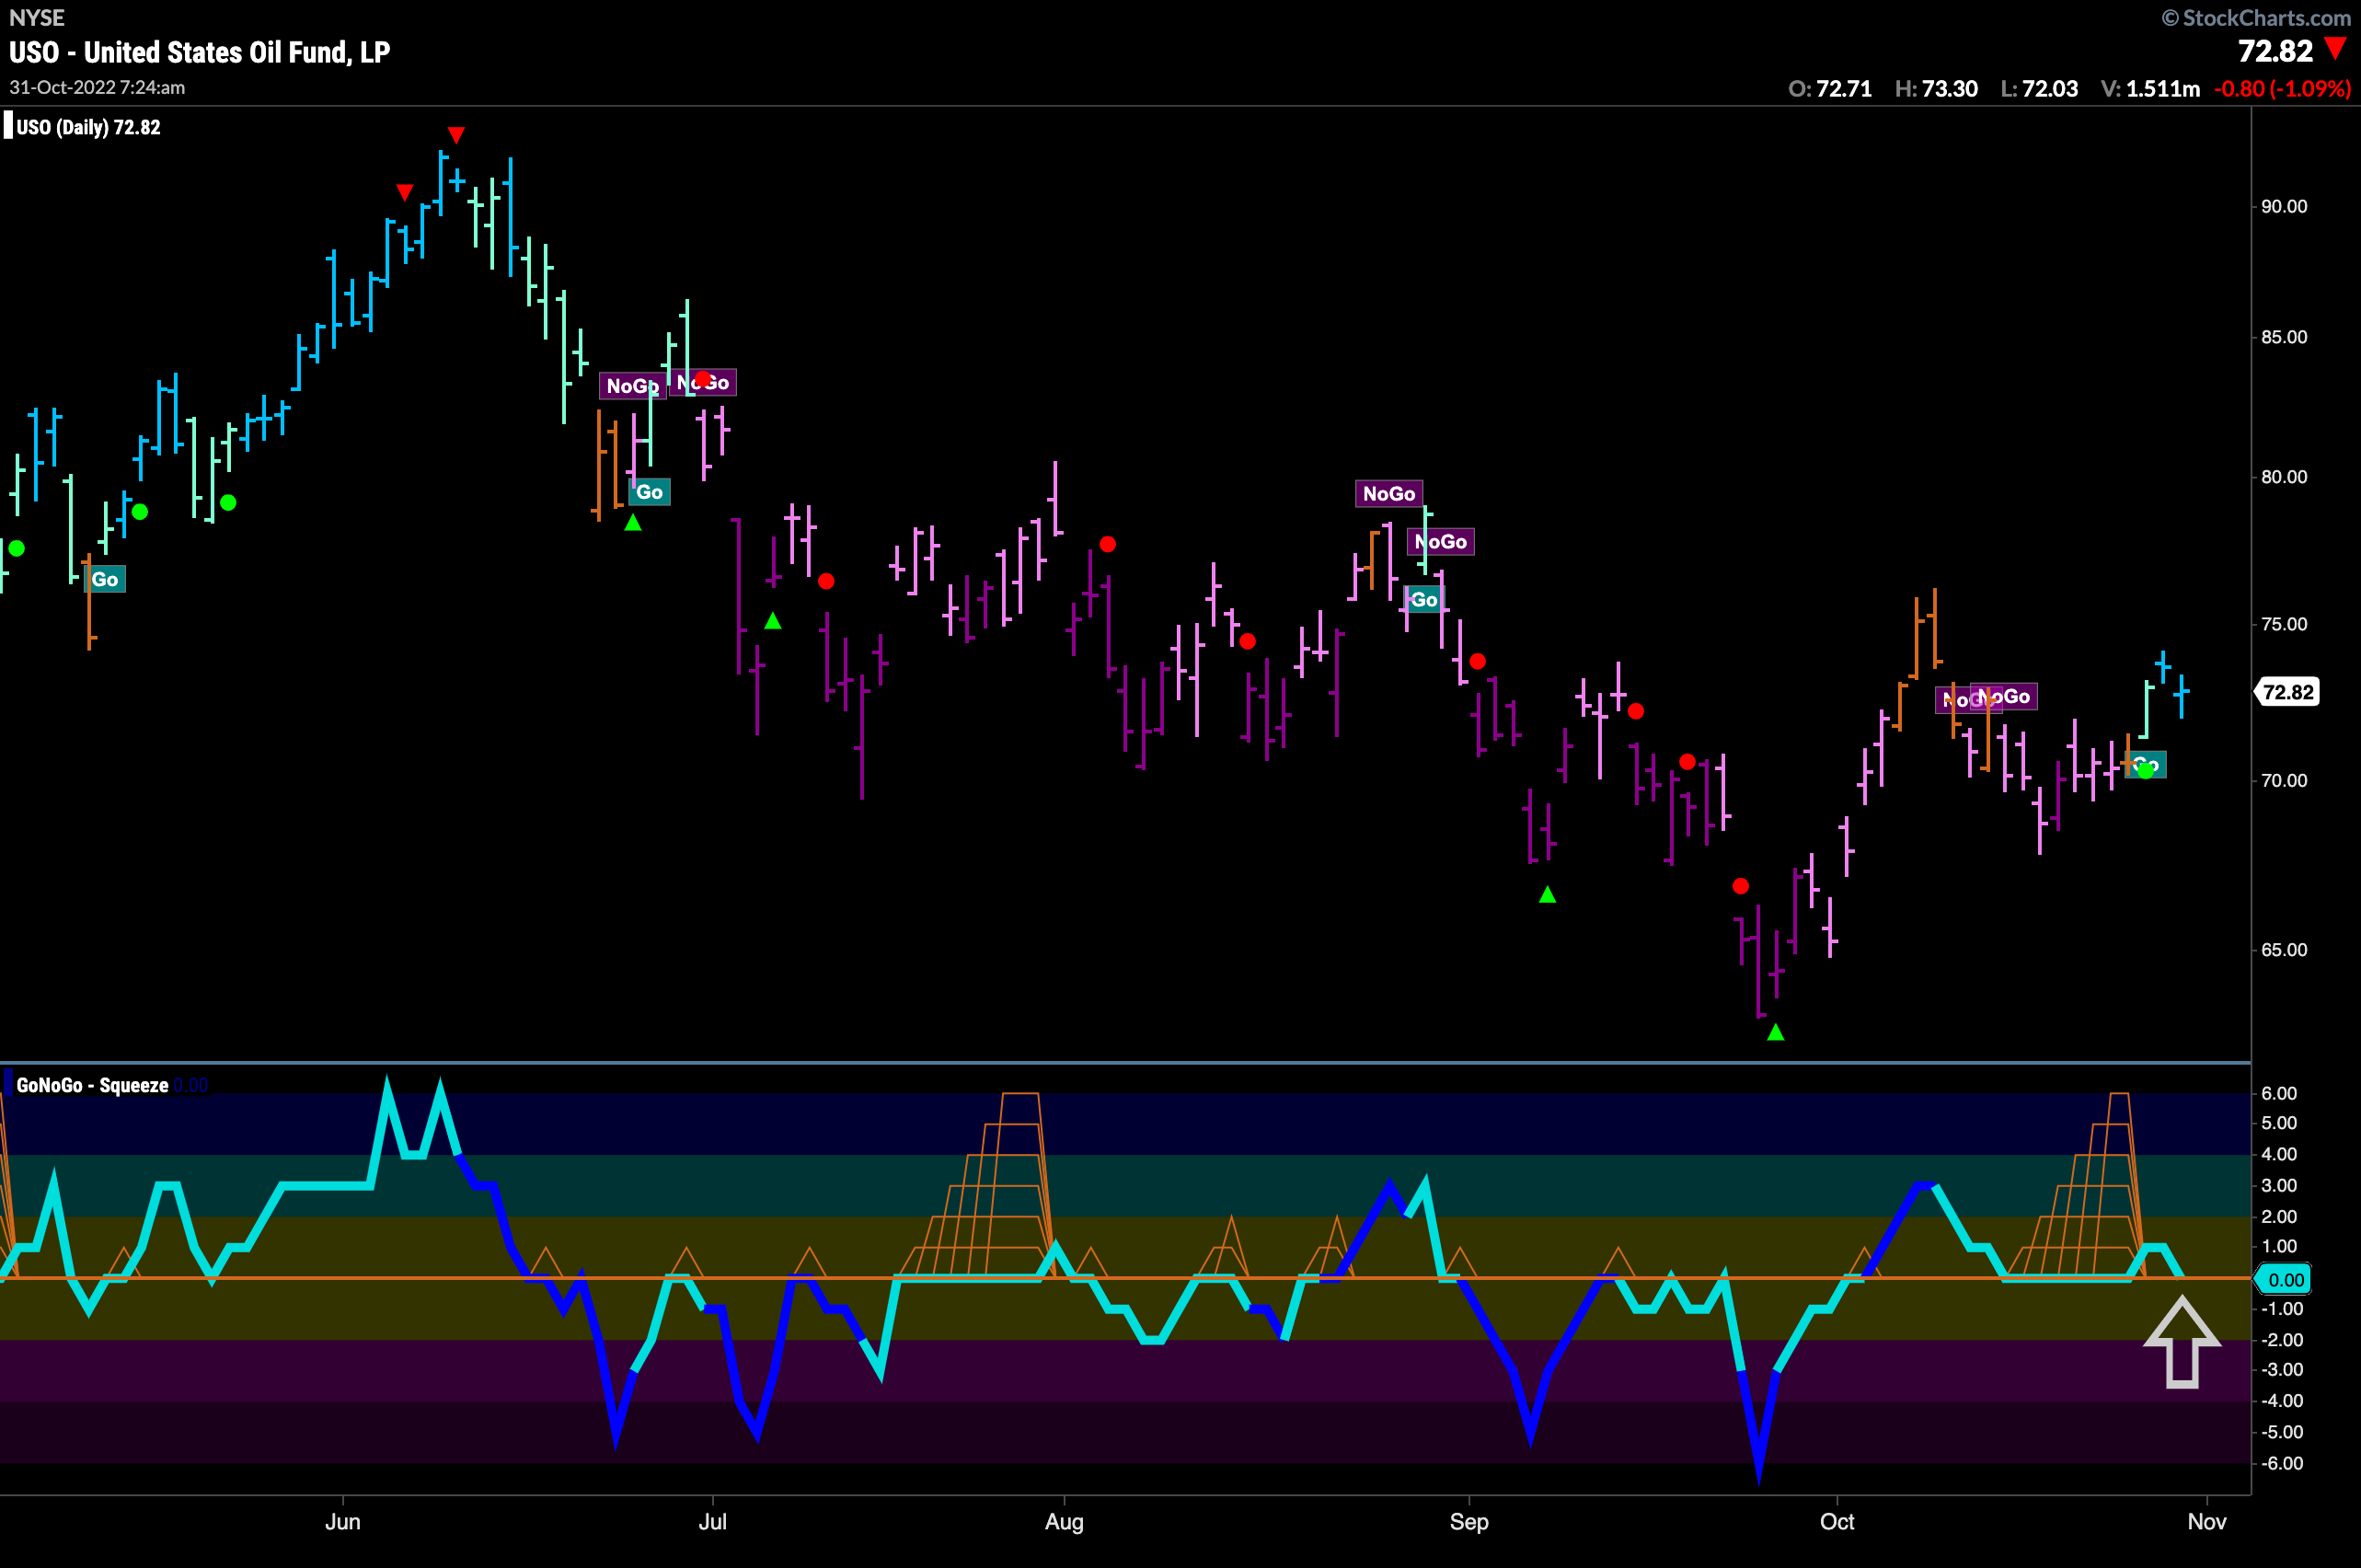
With the GoNoGo Oscillator seemingly finding support at the zero line, price has been able to paint “Go” bars. We saw how the oscillator was in a max GoNoGo Squeeze and briefly moved into positive territory. Immediately, it has returned to retest the zero line. We will need support at zero again to give price the momentum it needs to go higher.
Sector RelMap
Below is the GoNoGo Sector RelMap. This GoNoGo RelMap applies the GoNoGo Trend to the relative strength ratios of the sectors to the base index. Looking at this map, we can quickly see where the relative outperformance is coming from as well as which sectors are lagging on a relative basis. Again, it remains a “NoGo” for growth. Technology, communications and discretionary are in “NoGo” trends. A clear pattern has emerged, with the sectors in the middle of the map leading in terms of relative performance. Energy, financials, materials, industrials, healthcare and stapes are in relative “Go” trends.
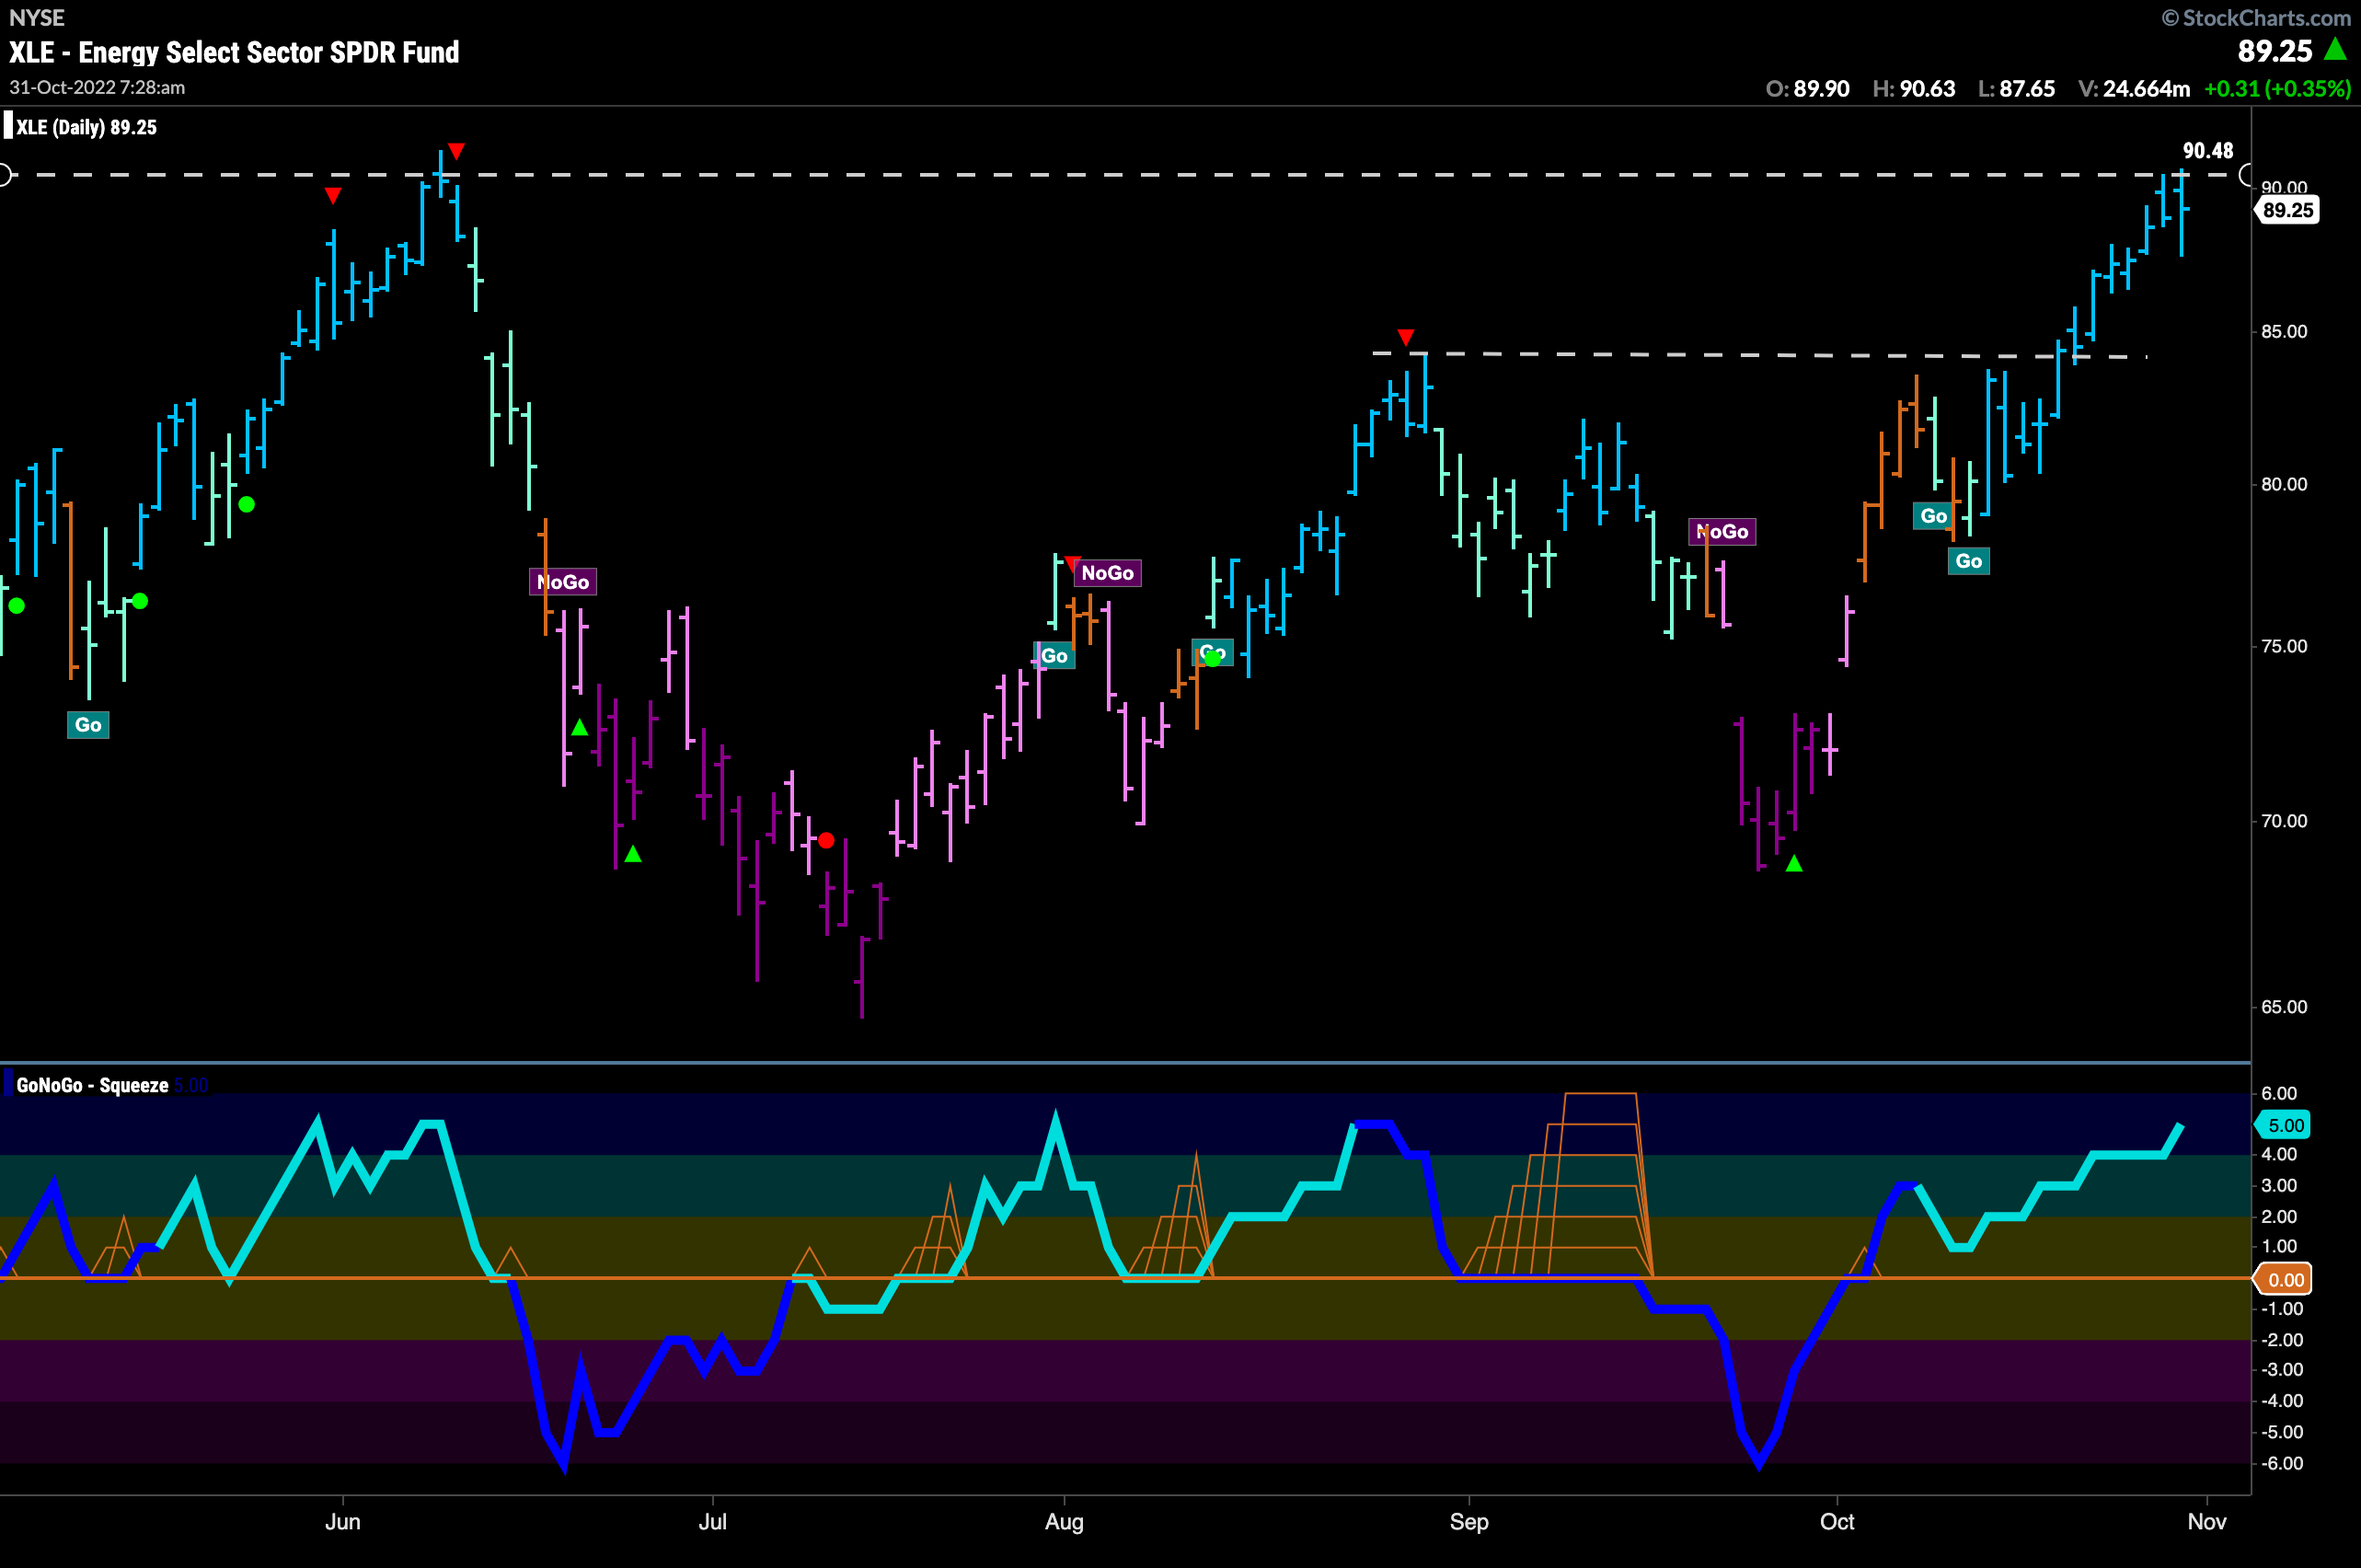
Energy Testing Summer Highs
$XLE has been outperforming the larger index for some time and not only on a relative basis but it has also been in a pure “Go” trend of its own. Having broken above zero on heavy volume the oscillator has moved into overbought territory and price has painted a succession of strong blue “Go” bars as it tests the high from early in the summer.
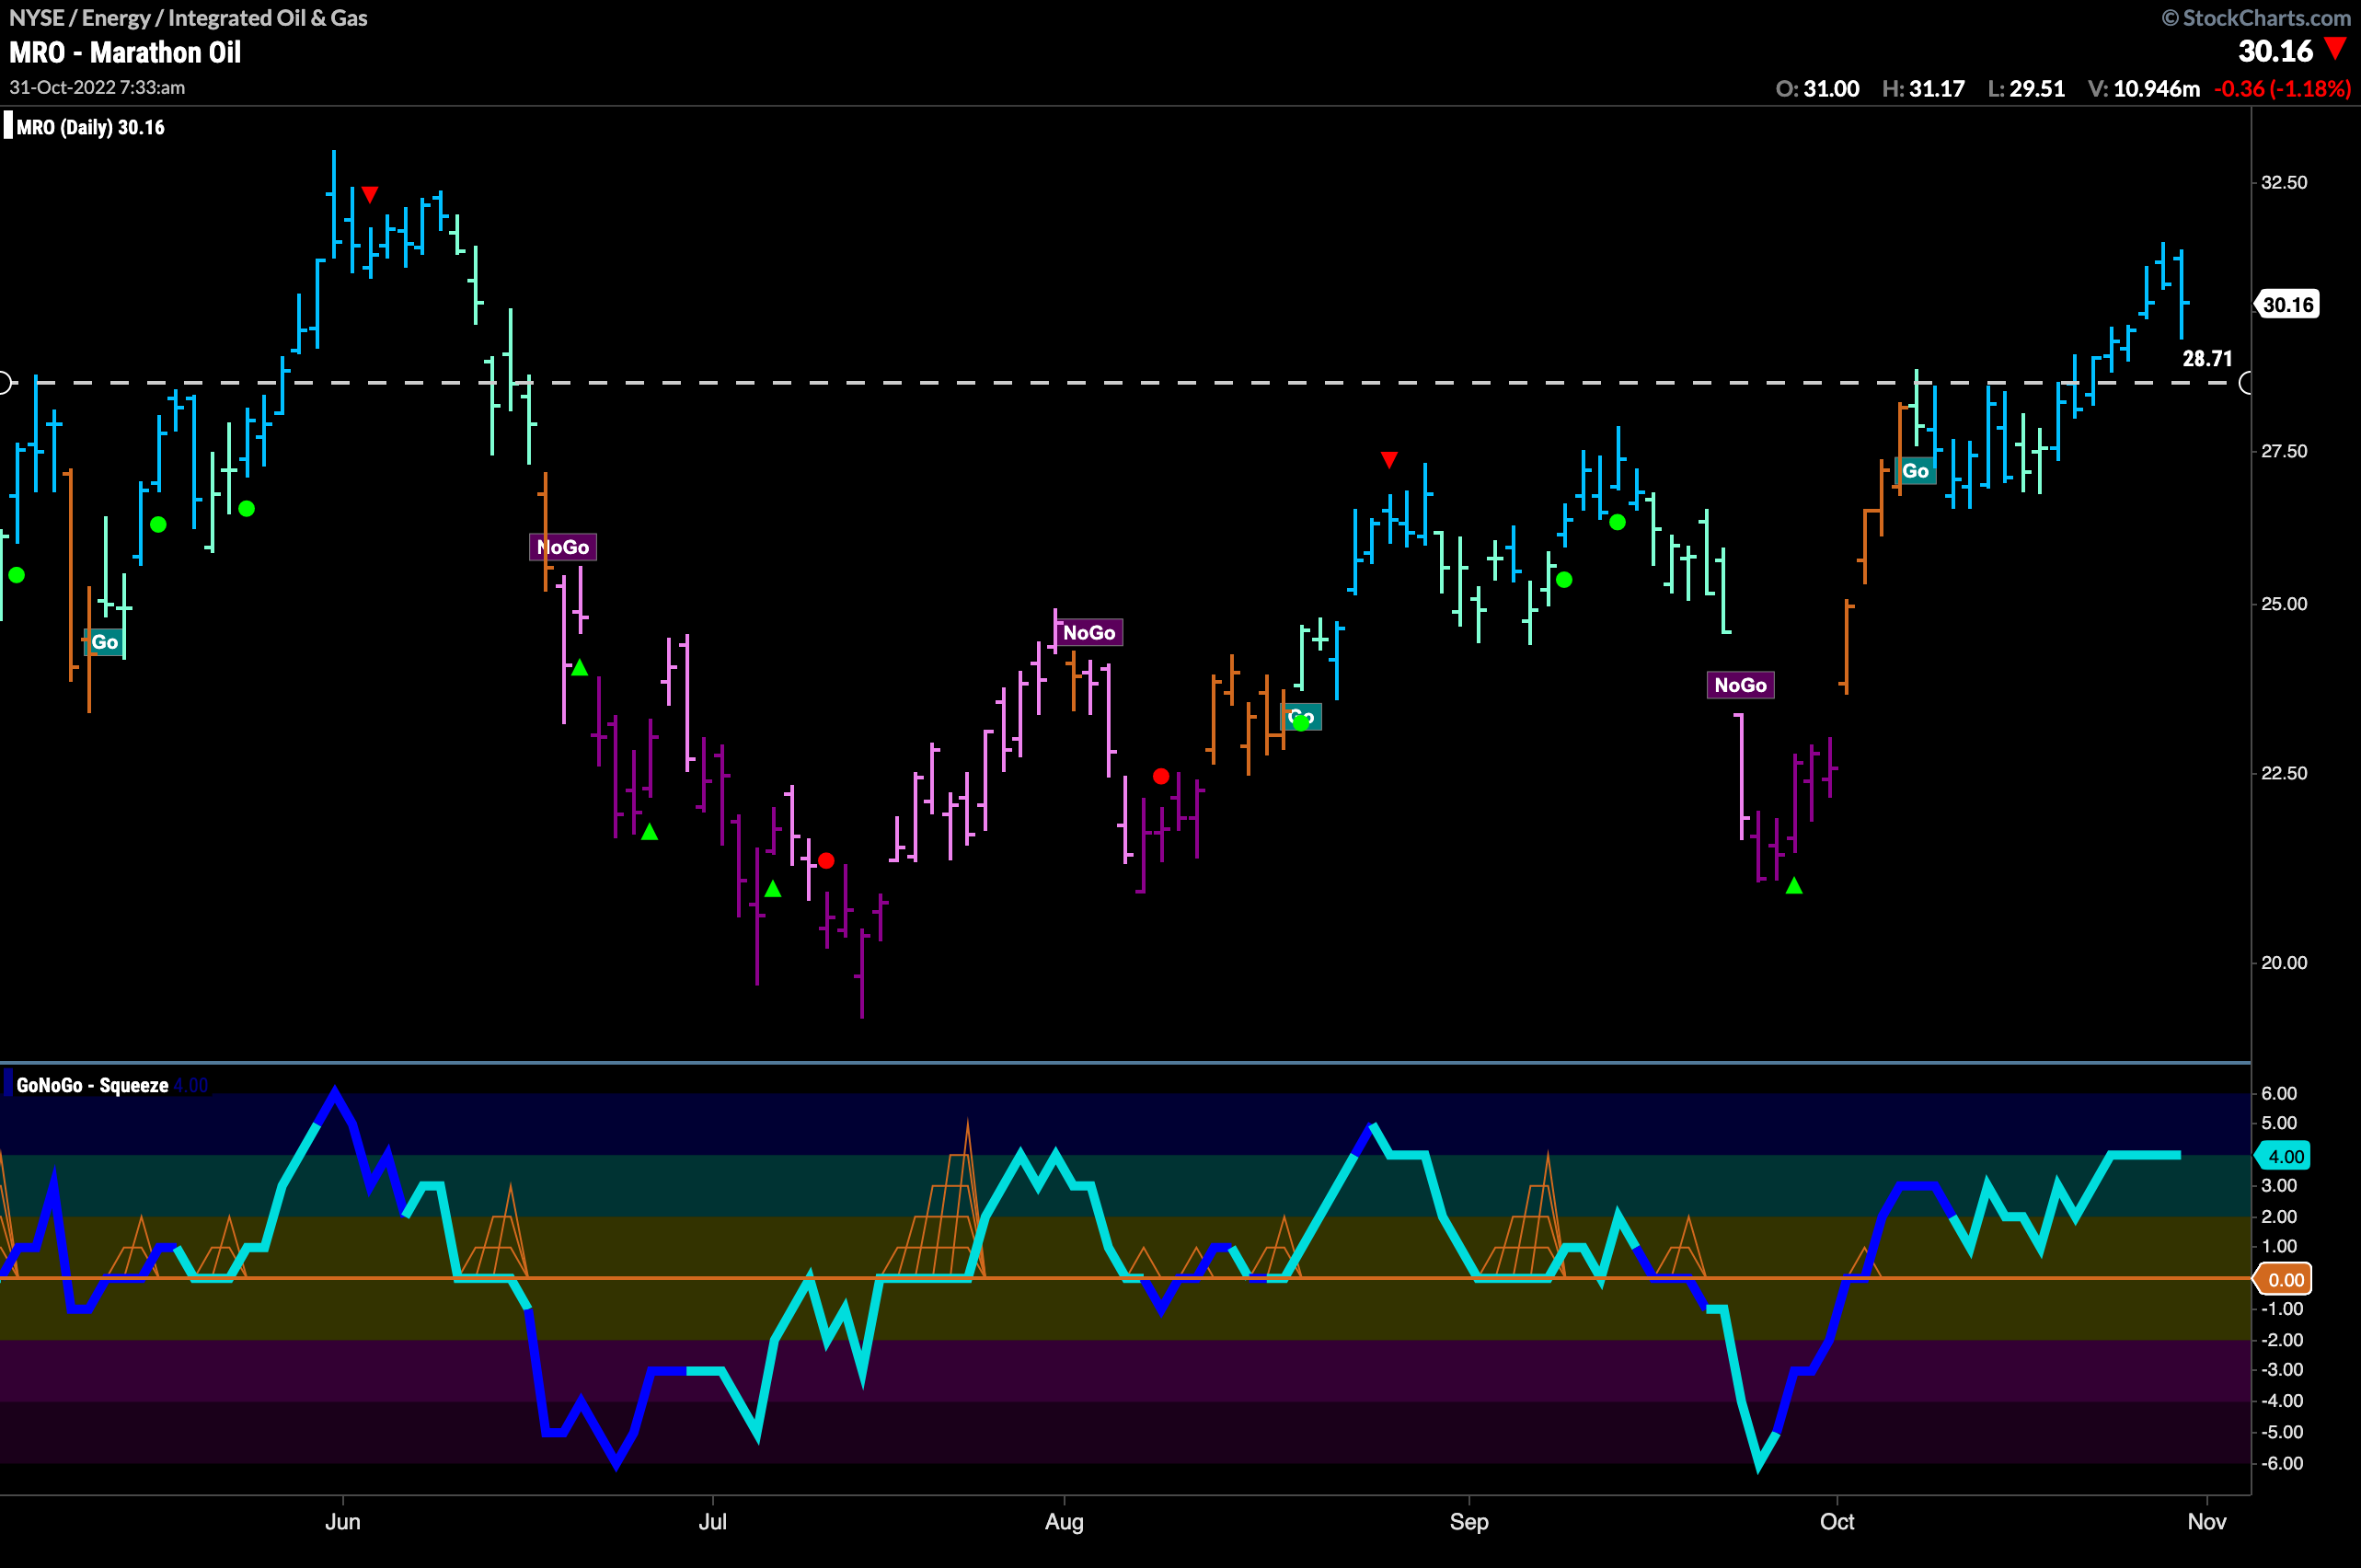
After hitting the “Wall” Marathon regains “Go” trend
The daily chart of $MRO shows price above a congestion area that could well act as support going forward. GoNoGo Trend is painting strong Go bars and the oscillator is at 4 in positive territory.
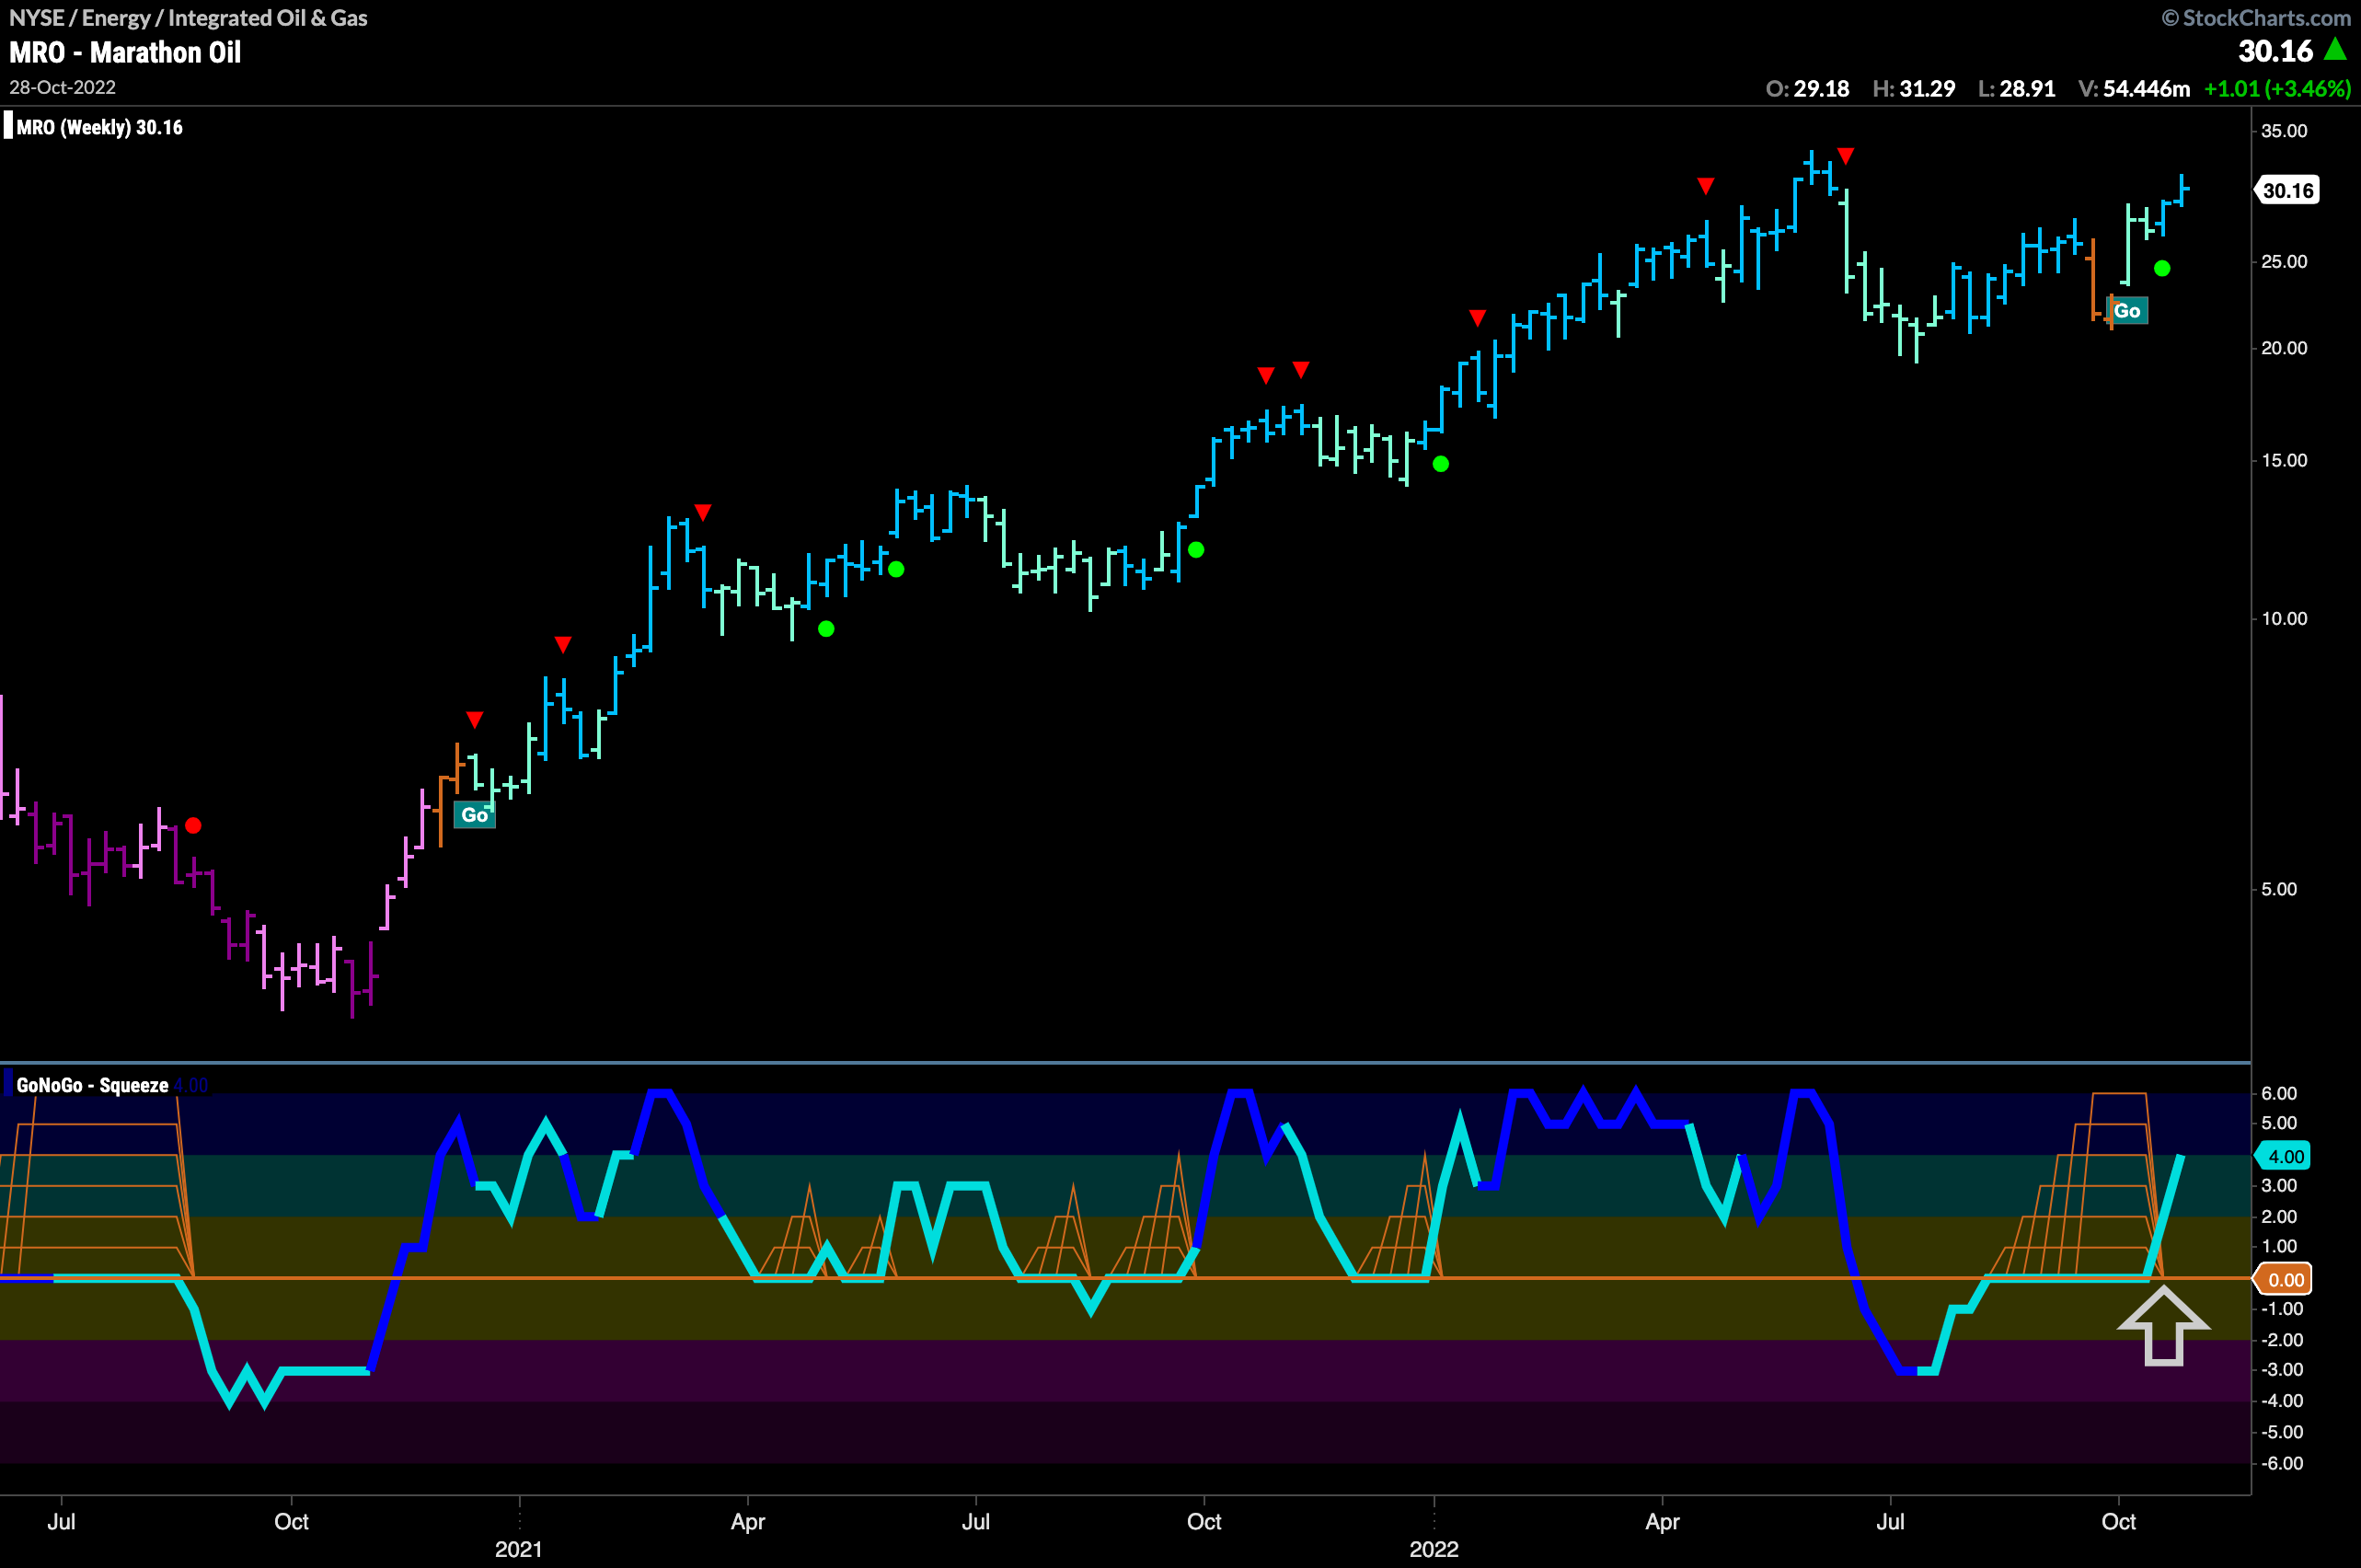
The weekly chart shows that after correcting against the trend and falling away from the July high price moved into a period of consolidation that even saw GoNoGo Trend paint an amber “Go Fish” bar. During that time the oscillator rode the zero line causing the climbing grid of GoNoGo Squeeze to climb to its max. This Squeeze was broken to the upside and the “Go” trend has resumed.
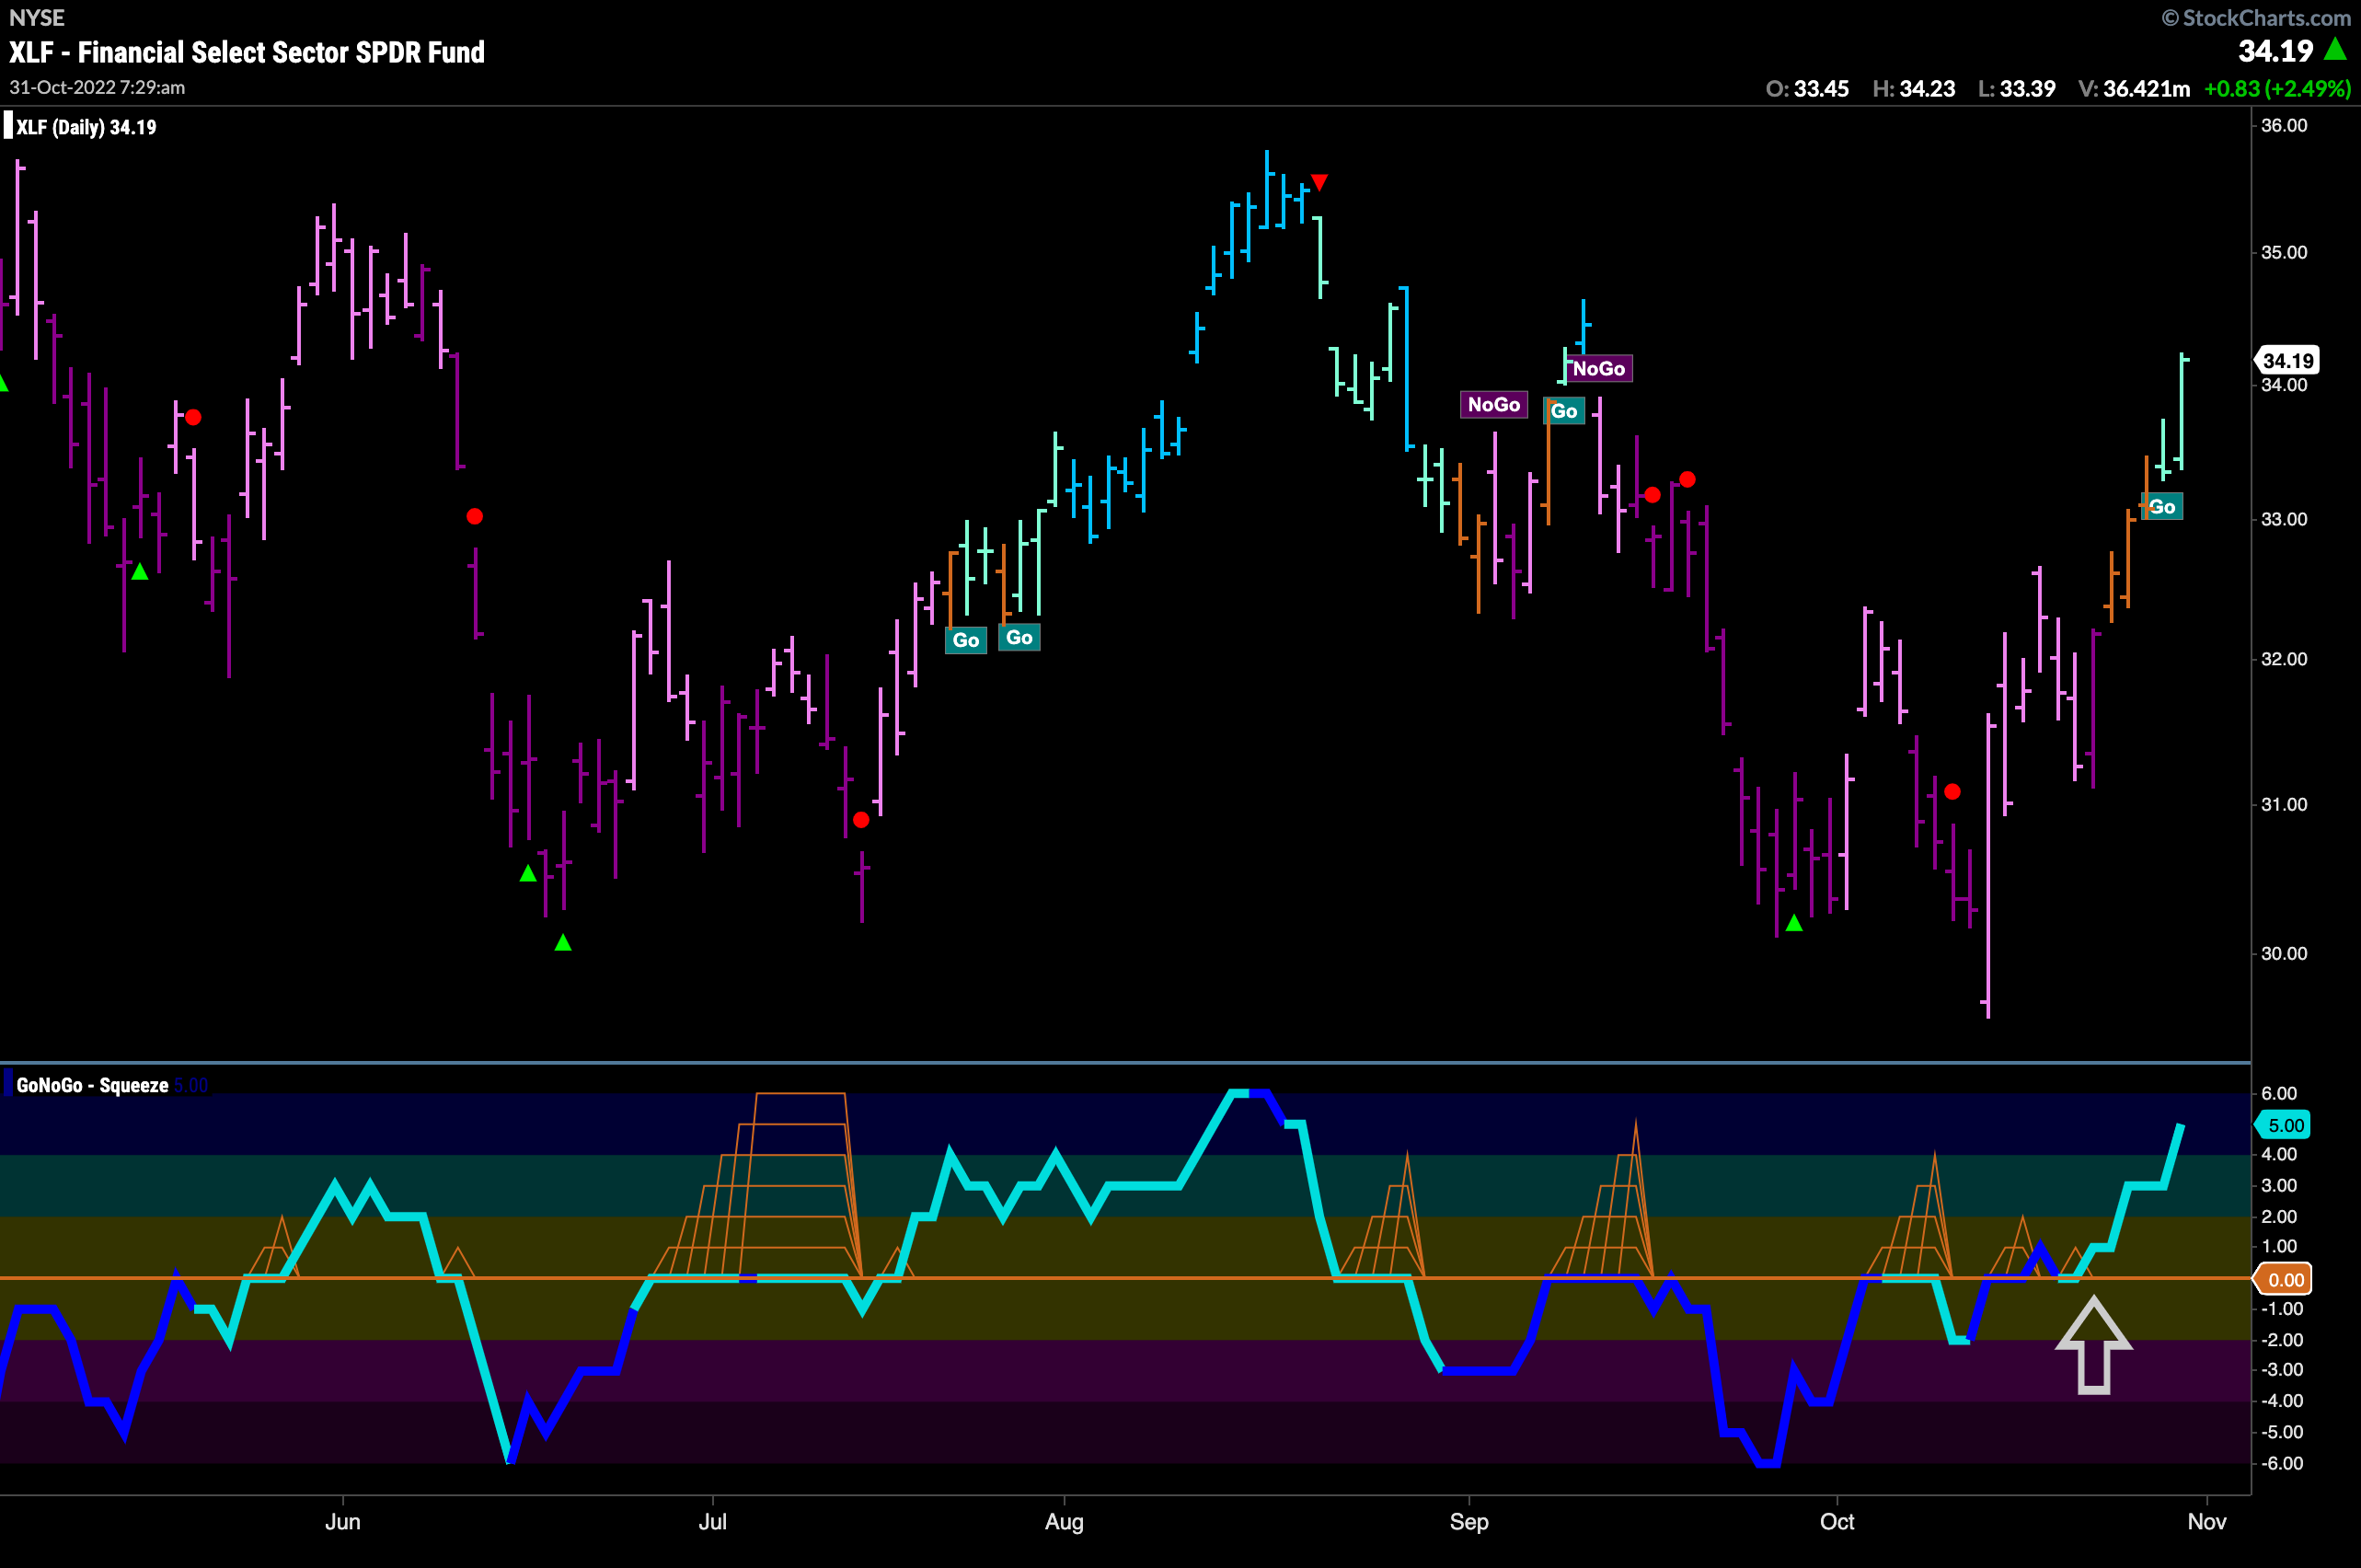
Financials in Pure “Go” trend
We have been seeing relative outperformance in financials for months but now we see the sector enter a “Go” trend on a pure basis as well. We saw GoNoGo Oscillator break into positive territory several bars ago and as that happened GoNoGo Trend was unable to maintain “NoGo” bars. We saw a string of amber “Go Fish” bars before ending the week with a couple of aqua “Go” bars.
Jefferies Financial Group looking to set new highs
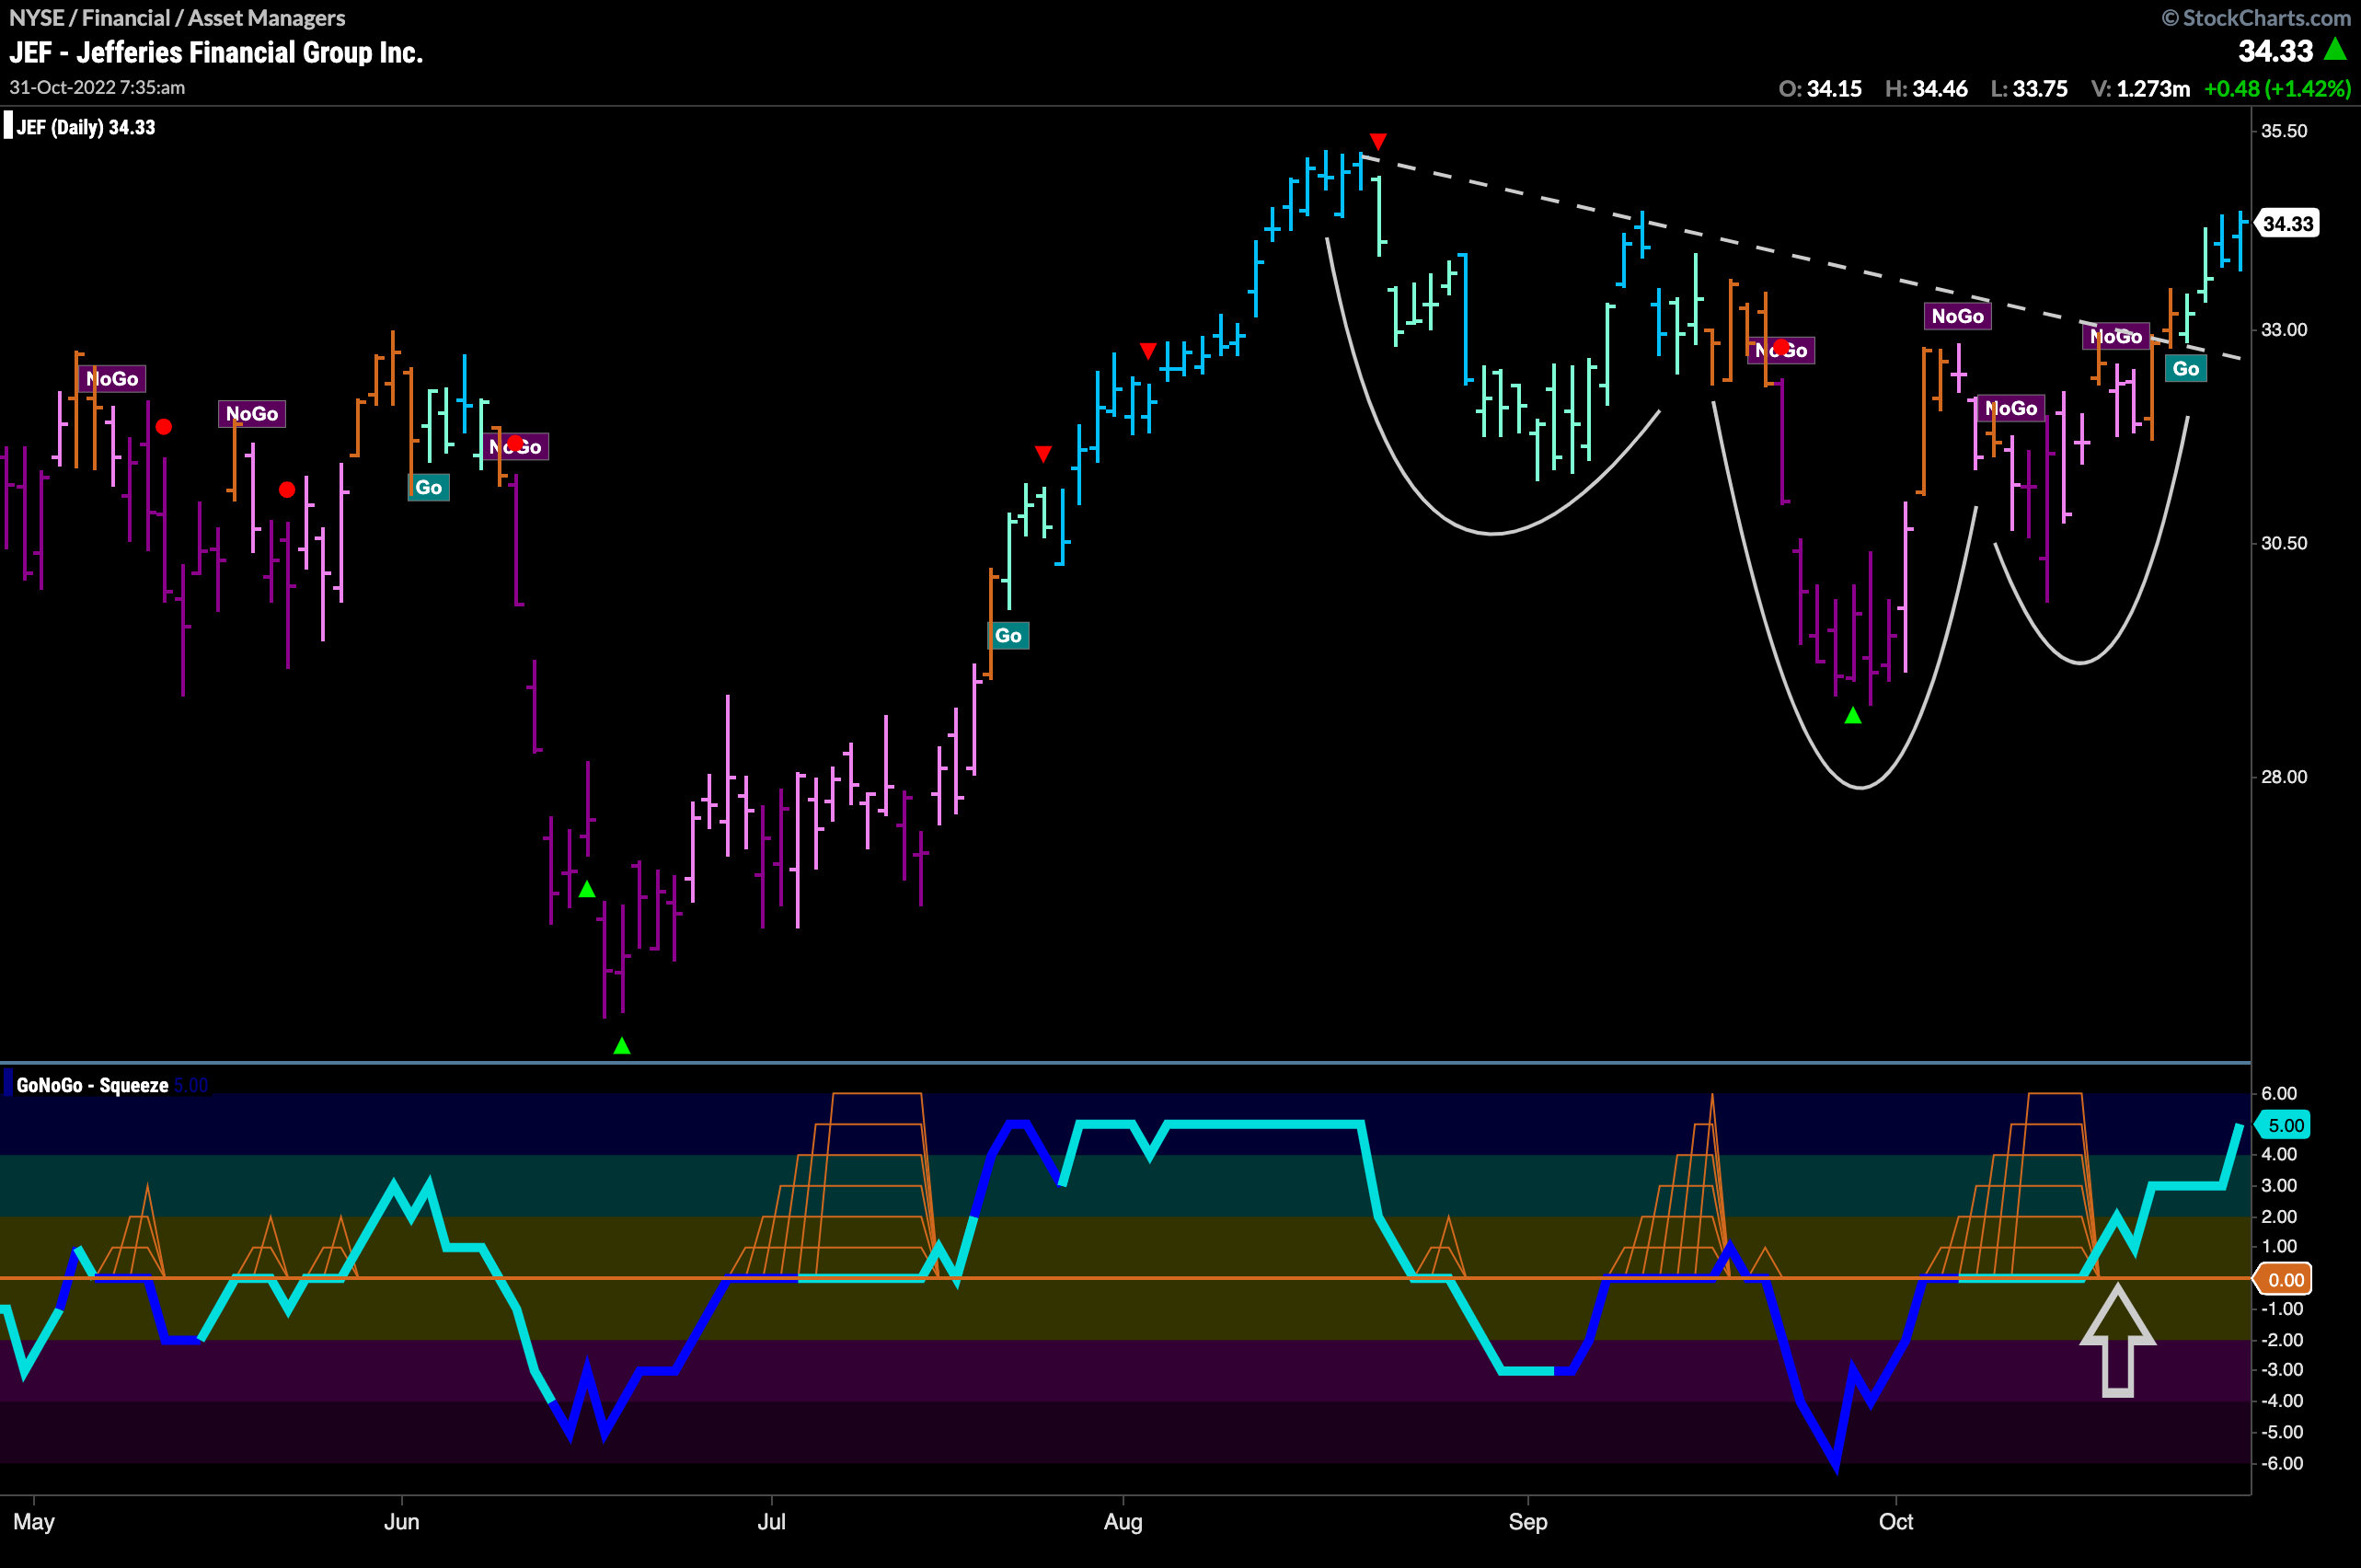
Given that we see relative and actual “Go” trends in the financial sector, let’s take a look at an old favorite. $JEF is painting strong blue “Go” bars but we see it also emerging out of what looks to be a continuation head and shoulders pattern. GoNoGo Oscillator broke out of a max GoNoGo Squeeze into positive territory as GoNoGo Trend started to struggle with maintaining “NoGo” bars. This gave price the push it needed to get above the downward sloping trend line. Look for price to move significantly higher than the August high.
