
$F sees GoNoGo Oscillator break out of a max GoNoGo Squeeze on the daily chart (not pictured).
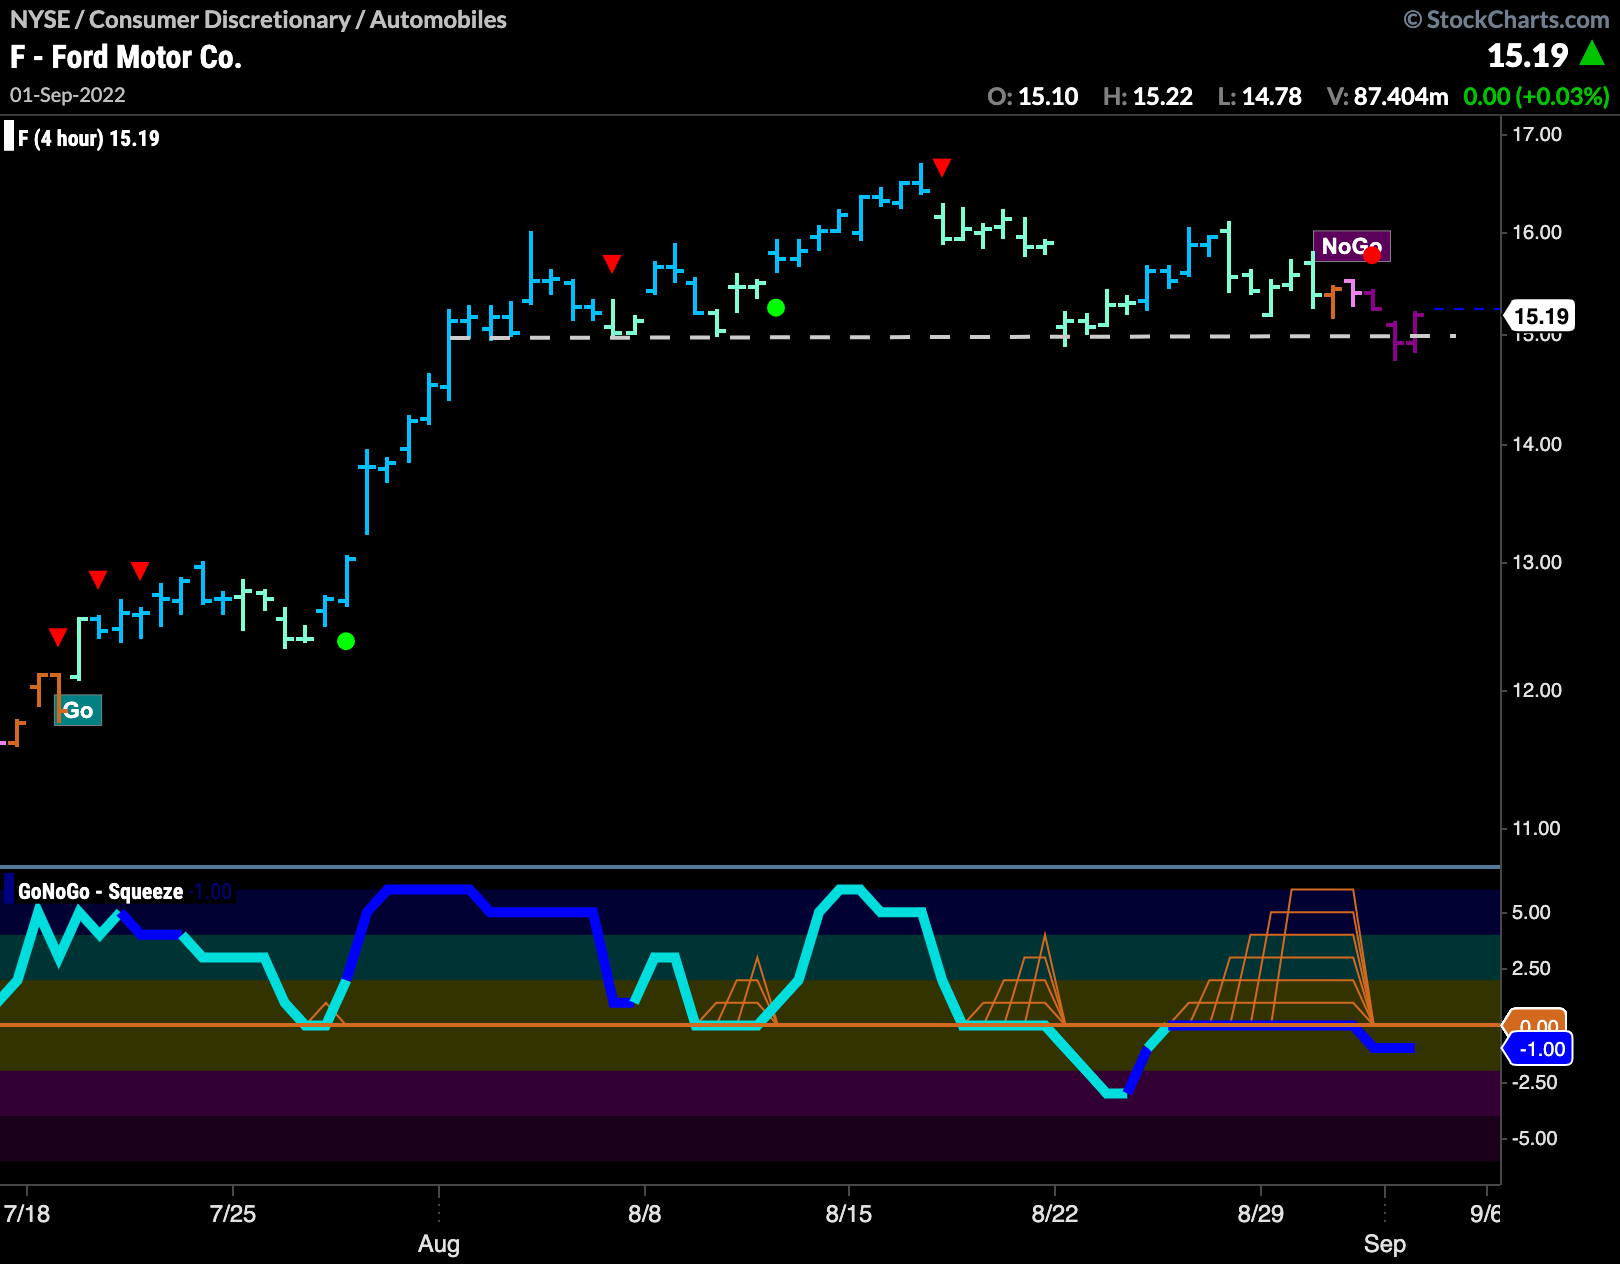
This is a concern for the “Go” trend which is weakening painting aqua bars. If we step down in timeframe to the 4hr chart above, we can see that a “NoGo” has already begun. Over a week ago, GoNoGo Oscillator broke below the zero line and it has been unable to regain positive territory since, with a max GoNoGo Squeeze building over the last few days. The oscillator has now broken out of the Squeeze to the downside, indicating that momentum has returned in the direction of the current, “NoGo”, trend. We will look to see if it will be enough of a push to see price fall below support and set a new low.


