The Narrative Machine in Overdrive
Headlines such as “Bad News for Economy = Good News for Stocks!” ran rampant this week. This environment offers boundless uncertainty, aided and abetted by media outlets’ need to creatively manufacture narratives and storytelling that increases ratings. In this weekly edition of Flight Path from GoNoGo Research, we will look at important price trends and quantify what is actually happening, to remove emotion and bias from trading decisions.
“If you take emotion – would be, could be, should be – out of it, and look at what is, and quantify it,

I think you have a big advantage over most human beings.” (John W. Henry)
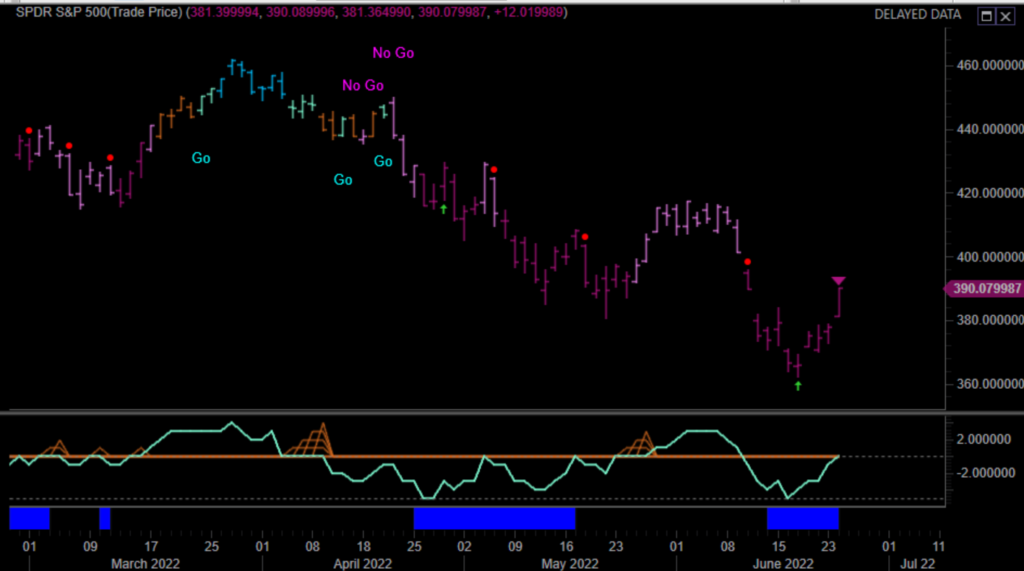
Consider this daily GoNoGo Chart® of the S&P 500 ETF $SPY which shows the impact of this countertrend “relief rally” in the holiday shortened week having little impact against the broader “NoGo” trend that resumed in mid-April. the composite trend conditions remain in a strong NoGo on purple bars. GoNoGo Oscillator® has climbed back from oversold to the neutral zero line on heavy relative volume. If we see momentum break into positive territory this coming week, there would be an identifiable threat to the downward bearish trend. However, a rejection at the amber zero line would signal a resurgence of momentum in the direction of the underlying trend.
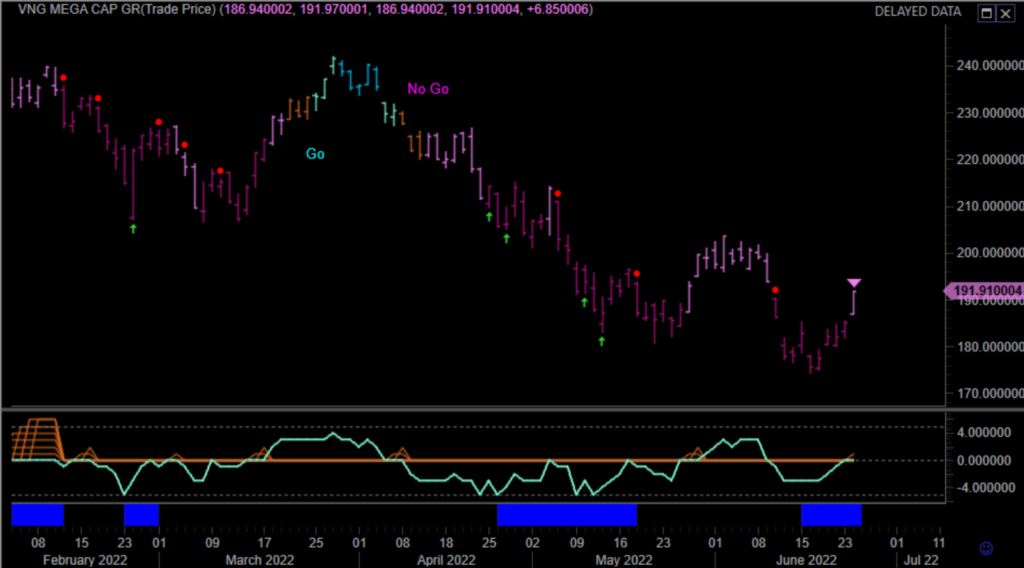
With just a few days of trading left in June and the conclusion of Q2 in sight, US equities mounted a more substantial relief rally last week punctuated by strong gains on Friday. Specifically, mega-cap stocks were standouts. The Vanguard Mega-Cap Growth ETF (MGK) surged 8.0%. Be that as it may, it is still down 3.6% for the month and 26.4% for the year.
The strength of the mega-cap stocks fortified the performance of the consumer discretionary $XLY (+8.3%), information technology $XLK (+7.3%), and communication services $XLC (+7.0%) sectors. However, when looking at absolute trends or relative strength through the first half of 2022, investors understand that Value has completely overshadowed Growth and defensive cyclical sectors have grossly outperformed the traditional risk-on assets.
Healthcare (+8.2%), utilities (+7.2%), and consumer staples (+6.6%) sectors all outperformed the S&P 500, whereas, the energy (-1.6%), materials (+2.7%), industrials (+4.2%), and financial (+5.1%) sectors all underperformed the S&P 500. If it wasn’t for Friday’s surge, the performance disparity would have been even greater.
So, is that it? Is the bear market over, or is this just the eye of the storm?
We have to keep in mind that the major indices had a lot of recovery room. Entering the week, they were down between 7.0% and 12.3% for the month. Moreover, US equity indices remain down nearly 20% following last week’s rally, their worst first six months of any year since 1970. Aggressive central-bank tightening, concerns around inflation, and the effect of these two factors on growth have led to a rapid adjustment in interest rates, share prices, corporate valuations, and most of all investor sentiment.
Trading Time Frame Matters
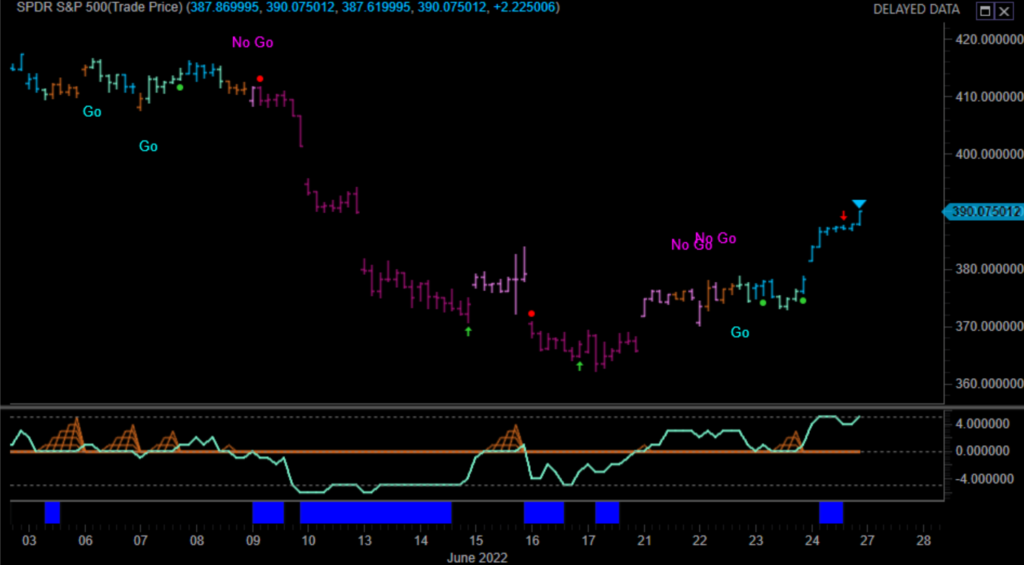
For intraday traders, the bear market was nowhere in sight this week. Short-term gains can be captured using GoNoGo Charts. Consider the hourly chart of the $SPY below which offered clear entry in the the “Go” for a mean-reversion trade. Preceding the change in trend conditions, traders saw GoNoGo Oscillator break positive through the zero line on June 21 as a leading indication of a change. Followed by a double retest of the zero line before the surge higher on strong blue Go bars.
The analysis below will focus on daily and weekly charts rather than intraday. Flight Path is written from a top-down perspective – meaning we will look at trends across asset classes and some of the macro forces shaping equity returns from a longer-term perspective. GoNoGo Research corroborates this intermarket analysis with a bottom-up understanding of the complete technical conditions for individual securities along four key metrics: Trend, Momentum, Volume and Volatility. regardless of your preferred time frame for trading, GoNoGo Charts function in the exact same way.
The Primary Trend is NoGo
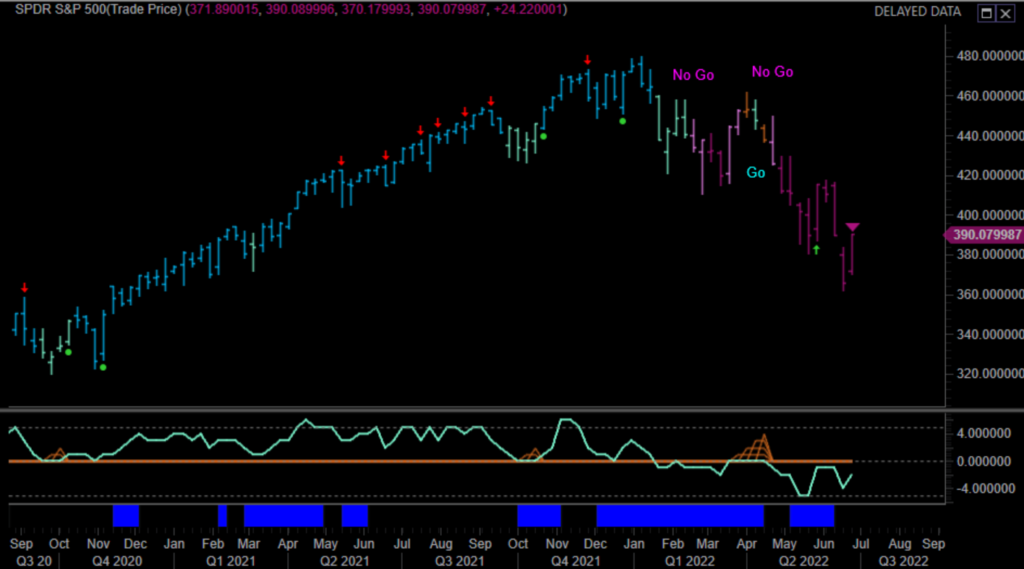
For this midyear market review, consider this weekly chart below of the S&P500 ETF $SPY. Despite the voracity of last week’s countertrend rally, the “NoGo” trend remains in its strong purple conditions. GoNoGo Oscillator® shows how momentum rallied away from oversold conditions, but has not yet reach neutral conditions at the zero line. We can also see from the end of the blue panel at the bottom that volume has retreated from heavy relative readings in the past week. A series of lower highs and lower lows defines a downtrend and the composite blend of technical indicators computed behind the scenes show us that the weight of the evidence remains bearish for the S&P500.
Intermarket Forces Cause Headwinds for Equity Gains
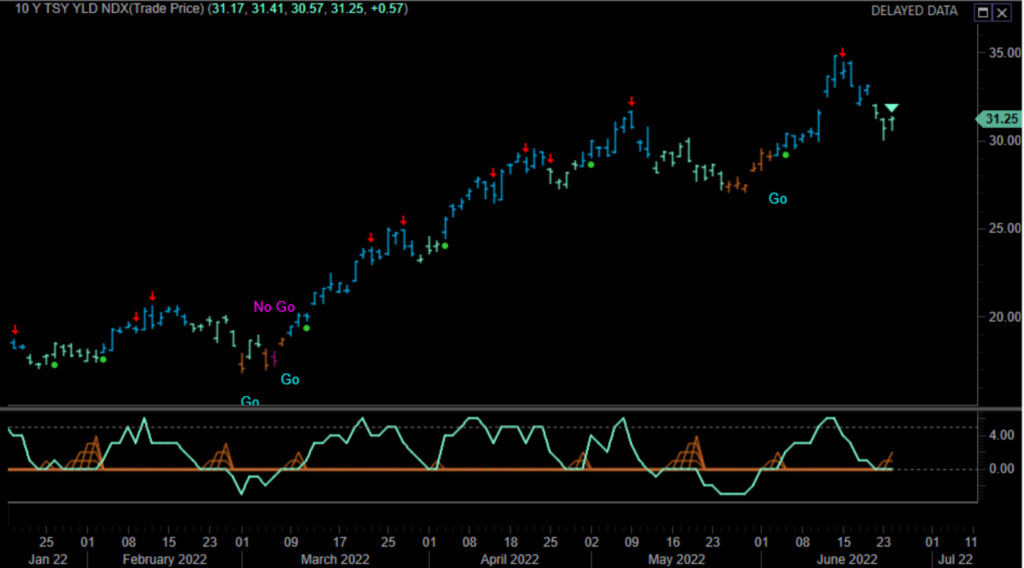
US Treasury Yields have been a force with major impacts on this market. The threat of runaway inflation has forced the FOMC to take an agressive stance for hiking interest rates in an attempt to cool the economy. We can see the inverse correlation between stocks and rates in this daily chart of $TNX – the 10-year yield. Signs that inflation might be moderating as growth cooled helped stocks rally sharply last week. The countertrend drop in yields, like the countertrend rally in $SPY were not decisive in changing the overall trend conditions. $TNX continues to paint “Go” bars, in the weaker bullish conditions signaled in the aqua bars.
From the longer-term perspective (monthly and quarterly charts) investors must note that 10-year treasury yields are in a confirmed breakout of a long-term downtrend going back to peak rates in 1981.
Dollar Strength Breaks Out
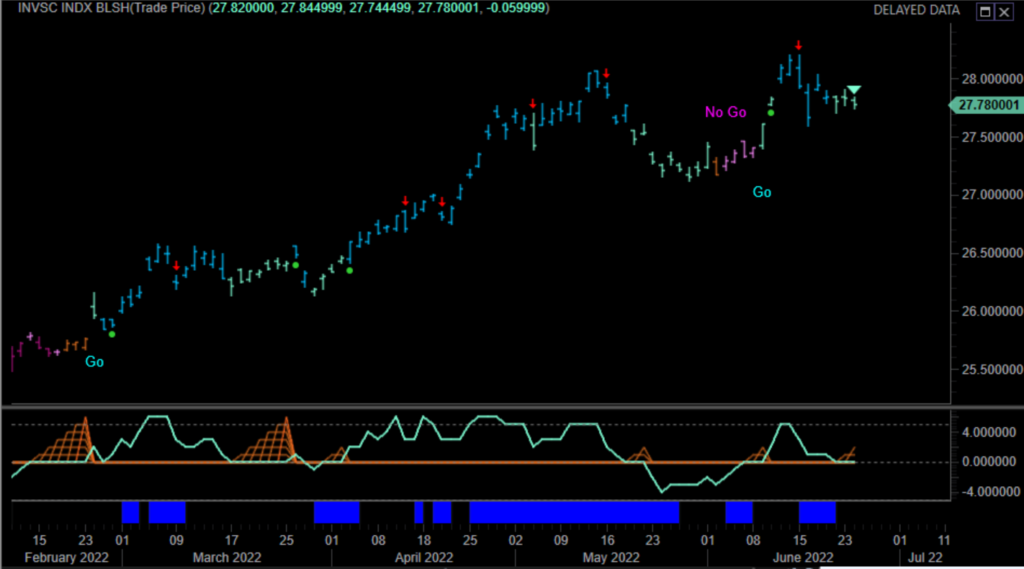
This daily GoNoGo Chart of the US Dollar $UUP provides another important intermarket relationship. Dollar strength continues in the “Go” trend conditions on weaker aqua bars. GoNoGo Oscillator is testing the zero line as momentum has fallen to neutral in recent weeks. Consolidation of rapid gains often occurs in strong uptrends. From this inflection point, we will watch for the direction of the break in momentum as our first signal of trend direction and strength.
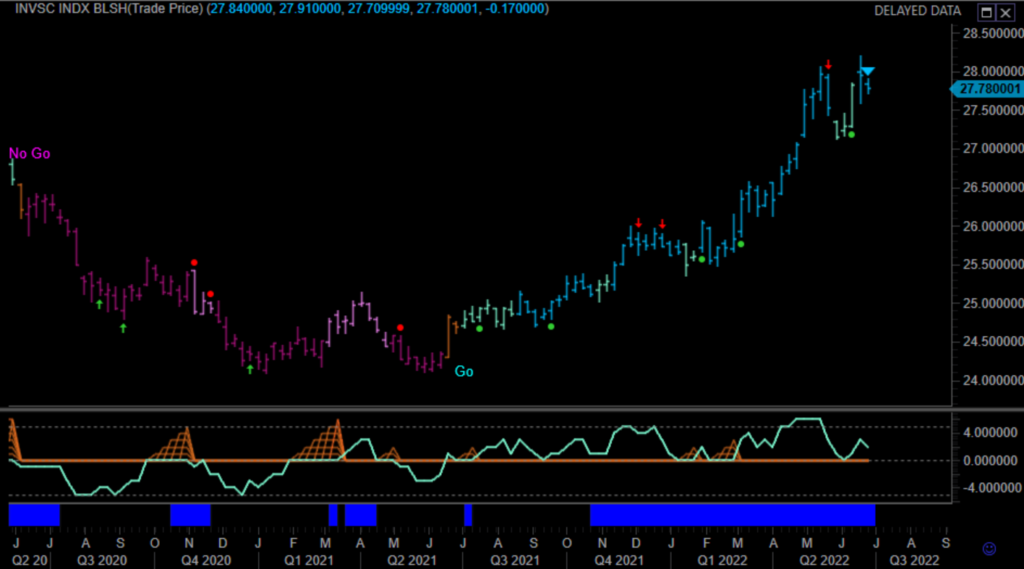
Zooming out to a weekly chart of $UUP the strength in the US Dollar is unquestionable. This breakout in June puts the trend above multi-year resistance with some Wall St. analysts projecting future price targets that haven’t been seen since 2002. In short, the trend is in its strongest bullish conditions and there is ample room to the upside before reaching the next clear overhead resistance area.
The OIL Trend is your Friend, Until it Ends (or Bends)
WTI crude futures dropped to $101.53/bbl on Wednesday before rebounding to $107.65/bbl on Friday. Crude was down fractionally for the week, but the effects were more pronounced amongst oil funds than they were for physical traders. Consider the daily GoNoGo Chart of $USO below. Trend conditions ended the week in declaration of a weak form “NoGo.” GoNoGo Oscillator preceded the trend change with a breakdown through the zero line into negative territory on June 16th followed by a retest and rejection leading to extreme oversold conditions on heavy volume Thursday.
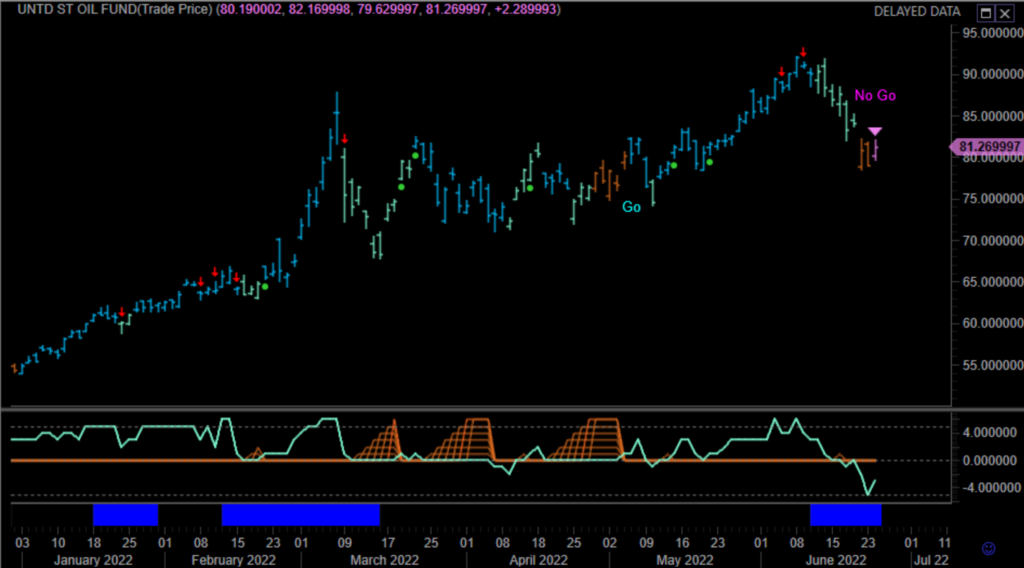
Again, multiple timeframes aid our analysis of the overarching trend. We saw $XLE as the strongest sector of 2021, and an uninterrupted “Go” trend for the energy sector YTD on both an absolute and relative basis. This countertrend selling may be short-lived in the context of the larger move for commodities in this inflationary environment. Consider the same $USO chart on a weekly basis:
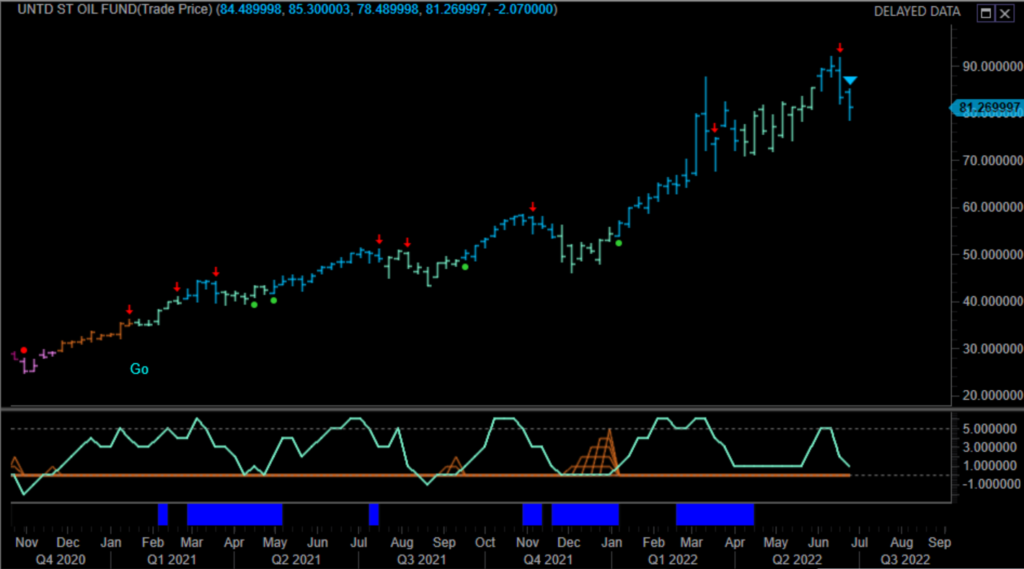
For portfolio managers, asset allocators, and trend followers, this could appear as a buyable dip in an otherwise very strong “Go” trend. GoNoGo Oscillator has fallen from overbought extremes, but has yet to even reach the zero line. Still a positive +1 reading.
Energy Trade is a Marathon, Not a Sprint
We must emphasize responsible risk management. The anchoring bias and recency bias are strong in all human traders. Just because the oil trade has worked YTD, does not mean we hold indefinitely. Let’s review how to use GoNoGo Charts to minimize losses while patiently staying with “Go” trends to maximize gains.
Look at the chart below of Marathon Oil, a NYSE traded company focusing on exploration and production. Traders of $MRO on this daily timeframe would have exited over a week ago when GoNoGo Oscillator broke down through the zero line, when the price trend shifted to amber neutral, or ultimately when the trend struck the “NoGo” on Friday, June 17.
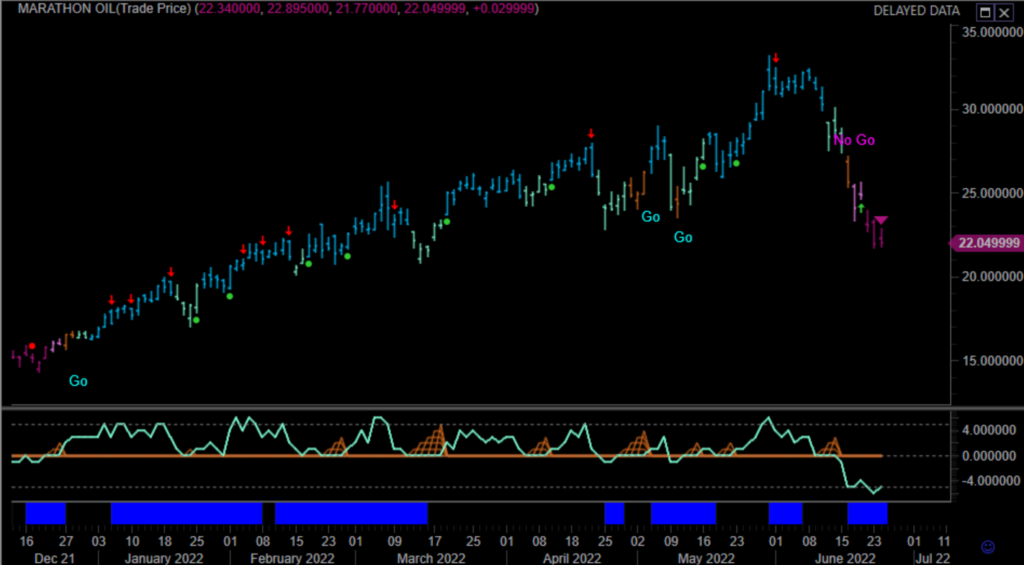
But, considering that the primary trend for oil is a “Go” with a strong upward bias on the weekly basis, traders can look for oil stocks to trade long when the trend resumes. So, what conditions we would look for to get back into this trade?
To reverse the strong NoGo trend conditions, we would look first for a rally in momentum. Potentially a bullish divergence between GoNoGo Oscillator and GoNoGo Trend – what is a lower low in price with a higher low in momentum would be a leading indicator of more constructive conditions. Ultimately, the momentum oscillator rallying back through the zero line into positive territory would signal a threat to the NoGo trend and a potential precursor to trend change.
Constructive Evidence for the Bulls and the Economy
Growth concerns were a permanent feature last week. They manifested themselves in the sudden outperformance of growth stocks over value stocks, and in large-cap versus small and midcap stocks. Growth matters were also a focal point in the Q&A portion of Fed Chair Powell’s Semiannual Monetary Policy Testimony to the Senate Banking Committee on Wednesday and the House Financial Services Committee on Thursday. Not surprisingly, there was some wonderment about how the Fed is going to achieve a soft landing with an aggressive rate-hike approach. Fed Chair Powell acknowledged that doing so will be challenging.
Academic evidence solidifies that the market is a leading economic indicator. No one knows what will happen next, but we can look at the weight of the evidence to put probabilities on our side. Better-than-expected full-year guidance from FedEx after Thursday’s close, tempered some of the growth concerns at the end of the week. A major transportation and logistics company, this is a signal that not all economic growth has been halted.
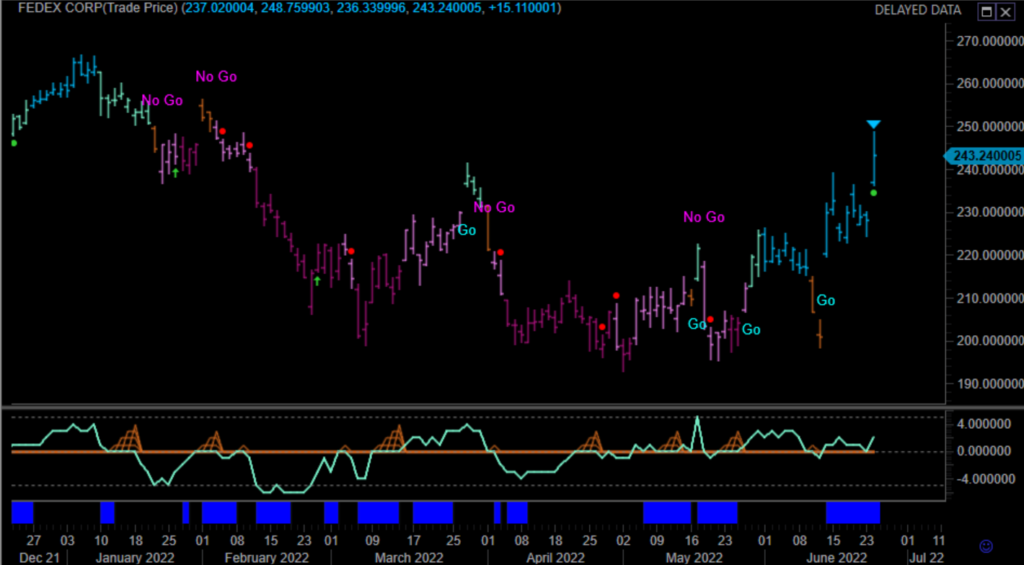
In the daily chart below $FDX has re-established the “Go” trend on strong blue bars following the volatility in mid June. Moreover, we see a fresh trend continuation icon under Friday’s bar. That green circle highlights that momentum has come back in the direction of the trend. GoNoGo Oscillator retested and found support at the zero line on heavy volume.
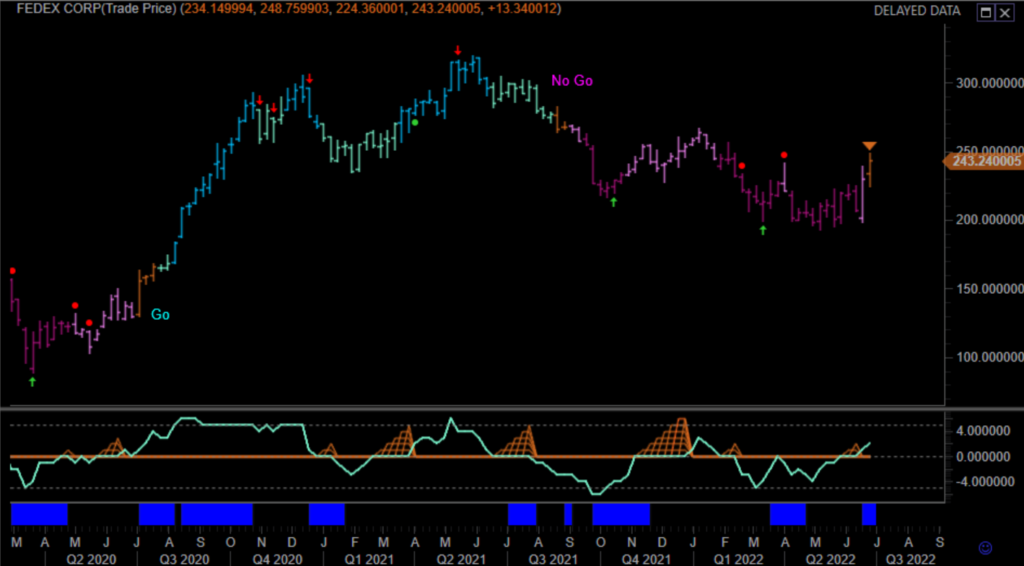
Short-term gains precede long-term trend reversals. The weekly trend for $FDX below concludes last week’s trading in an amber neutral bar. Important to consider on this long-term chart is that the NoGo trend which began in Q3 2021 has been durable but not sharply corrective. The NoGo trend conditions ended this week when GoNoGo Oscillator broke positive through the zero line on heavy volume:
