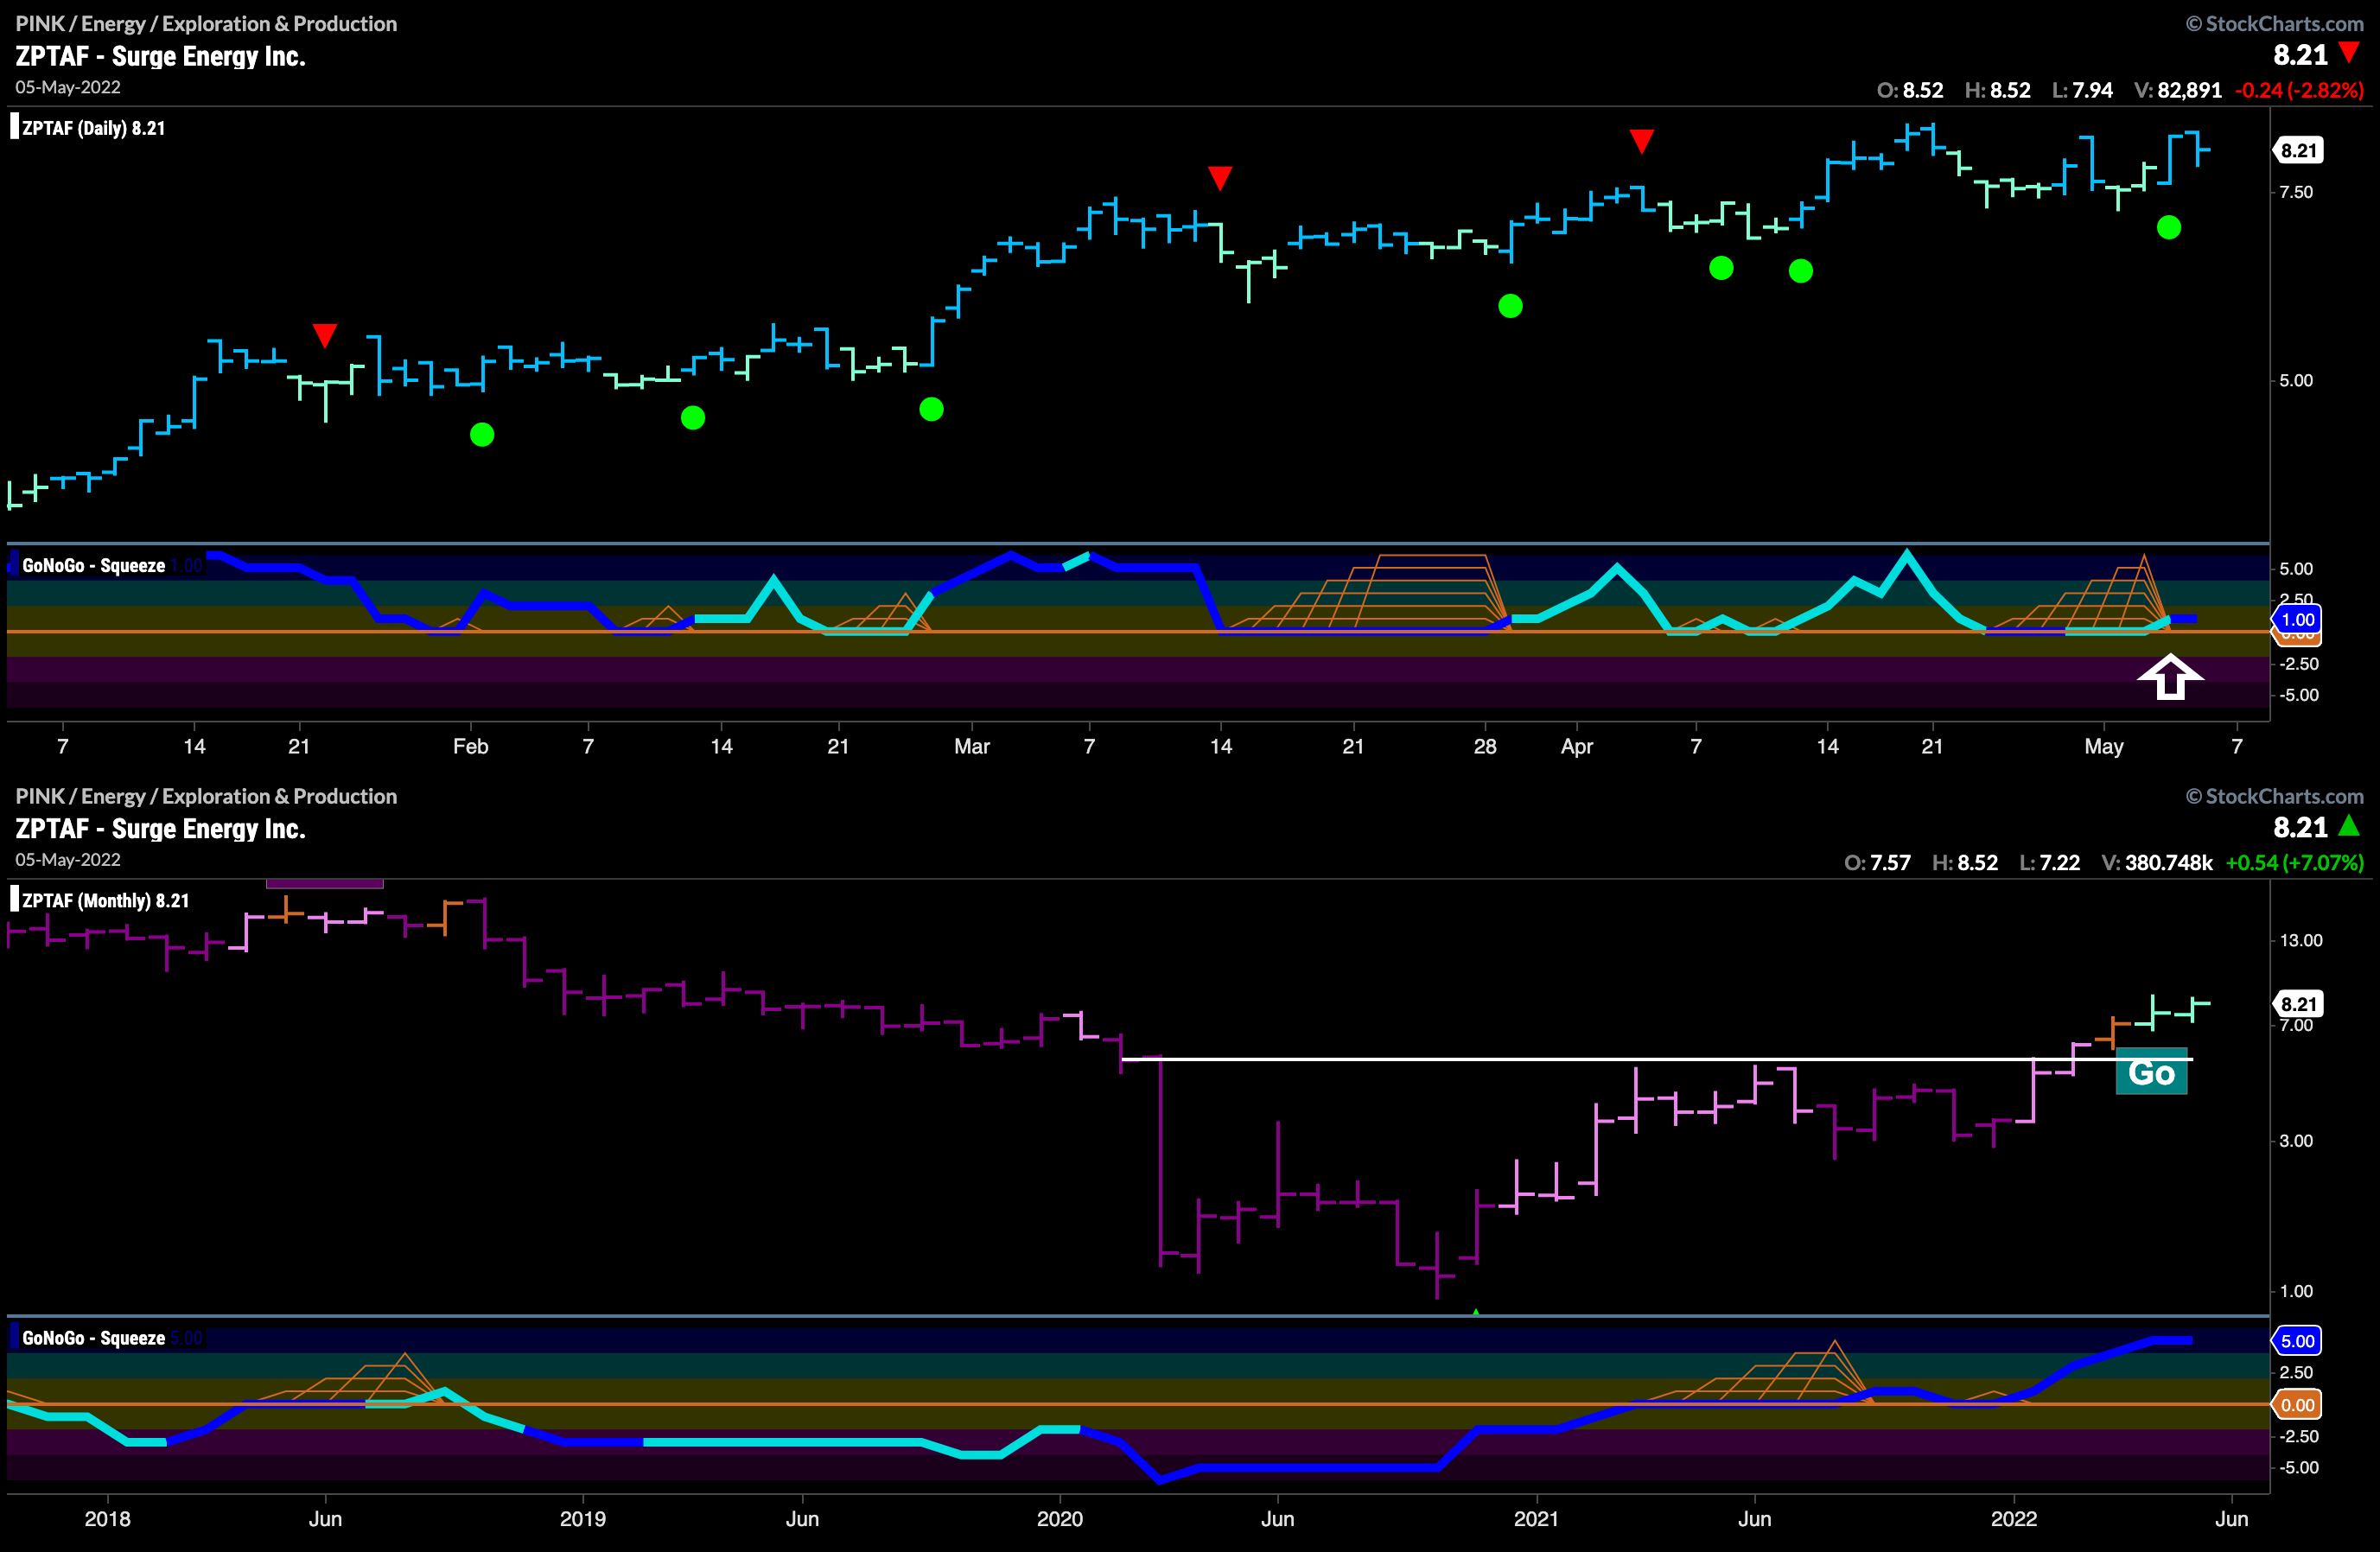

Surge Energy Inc sees a Go Trend Continuation Icon (green circle) on the penultimate daily bar as GoNoGo Oscillator finds support at the zero line.
$ZPTAF has been an incredible performer since the onset of 2022 as energy (and in particular, oil) prices have soared. This fresh low risk re-entry point comes as many ask if the trade is overextended. As we know, trends persist, and as we see a fresh surge of momentum in the direction of the “Go” trend we can look for more price gains. Just how far can price climb? The lower chart shows monthly prices for $XPTAF and we can see that on this very long term chart we are at the start of a new “Go” trend, with prices just having broken out of a long term ascending triangle base. There’s room to run.


