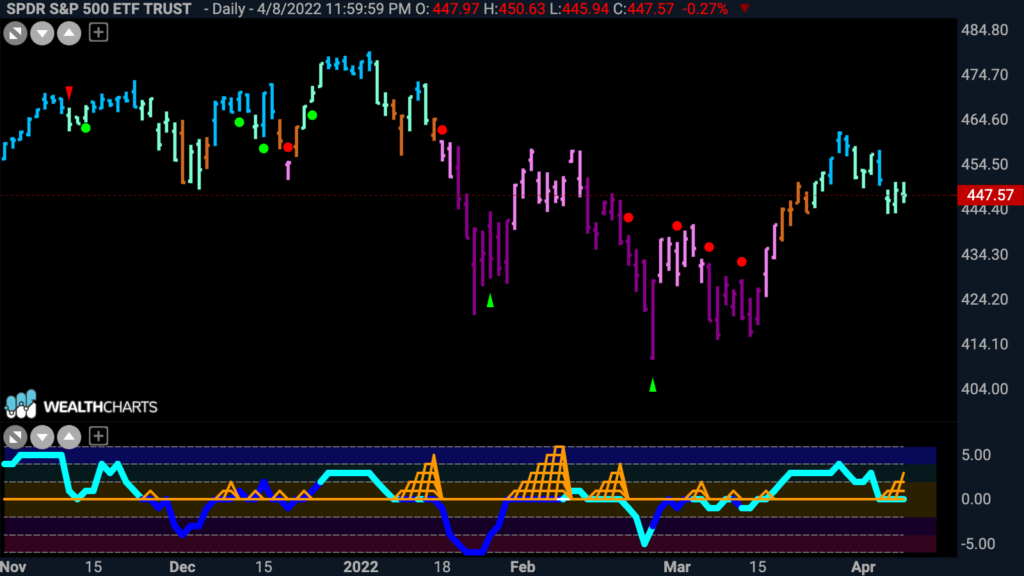
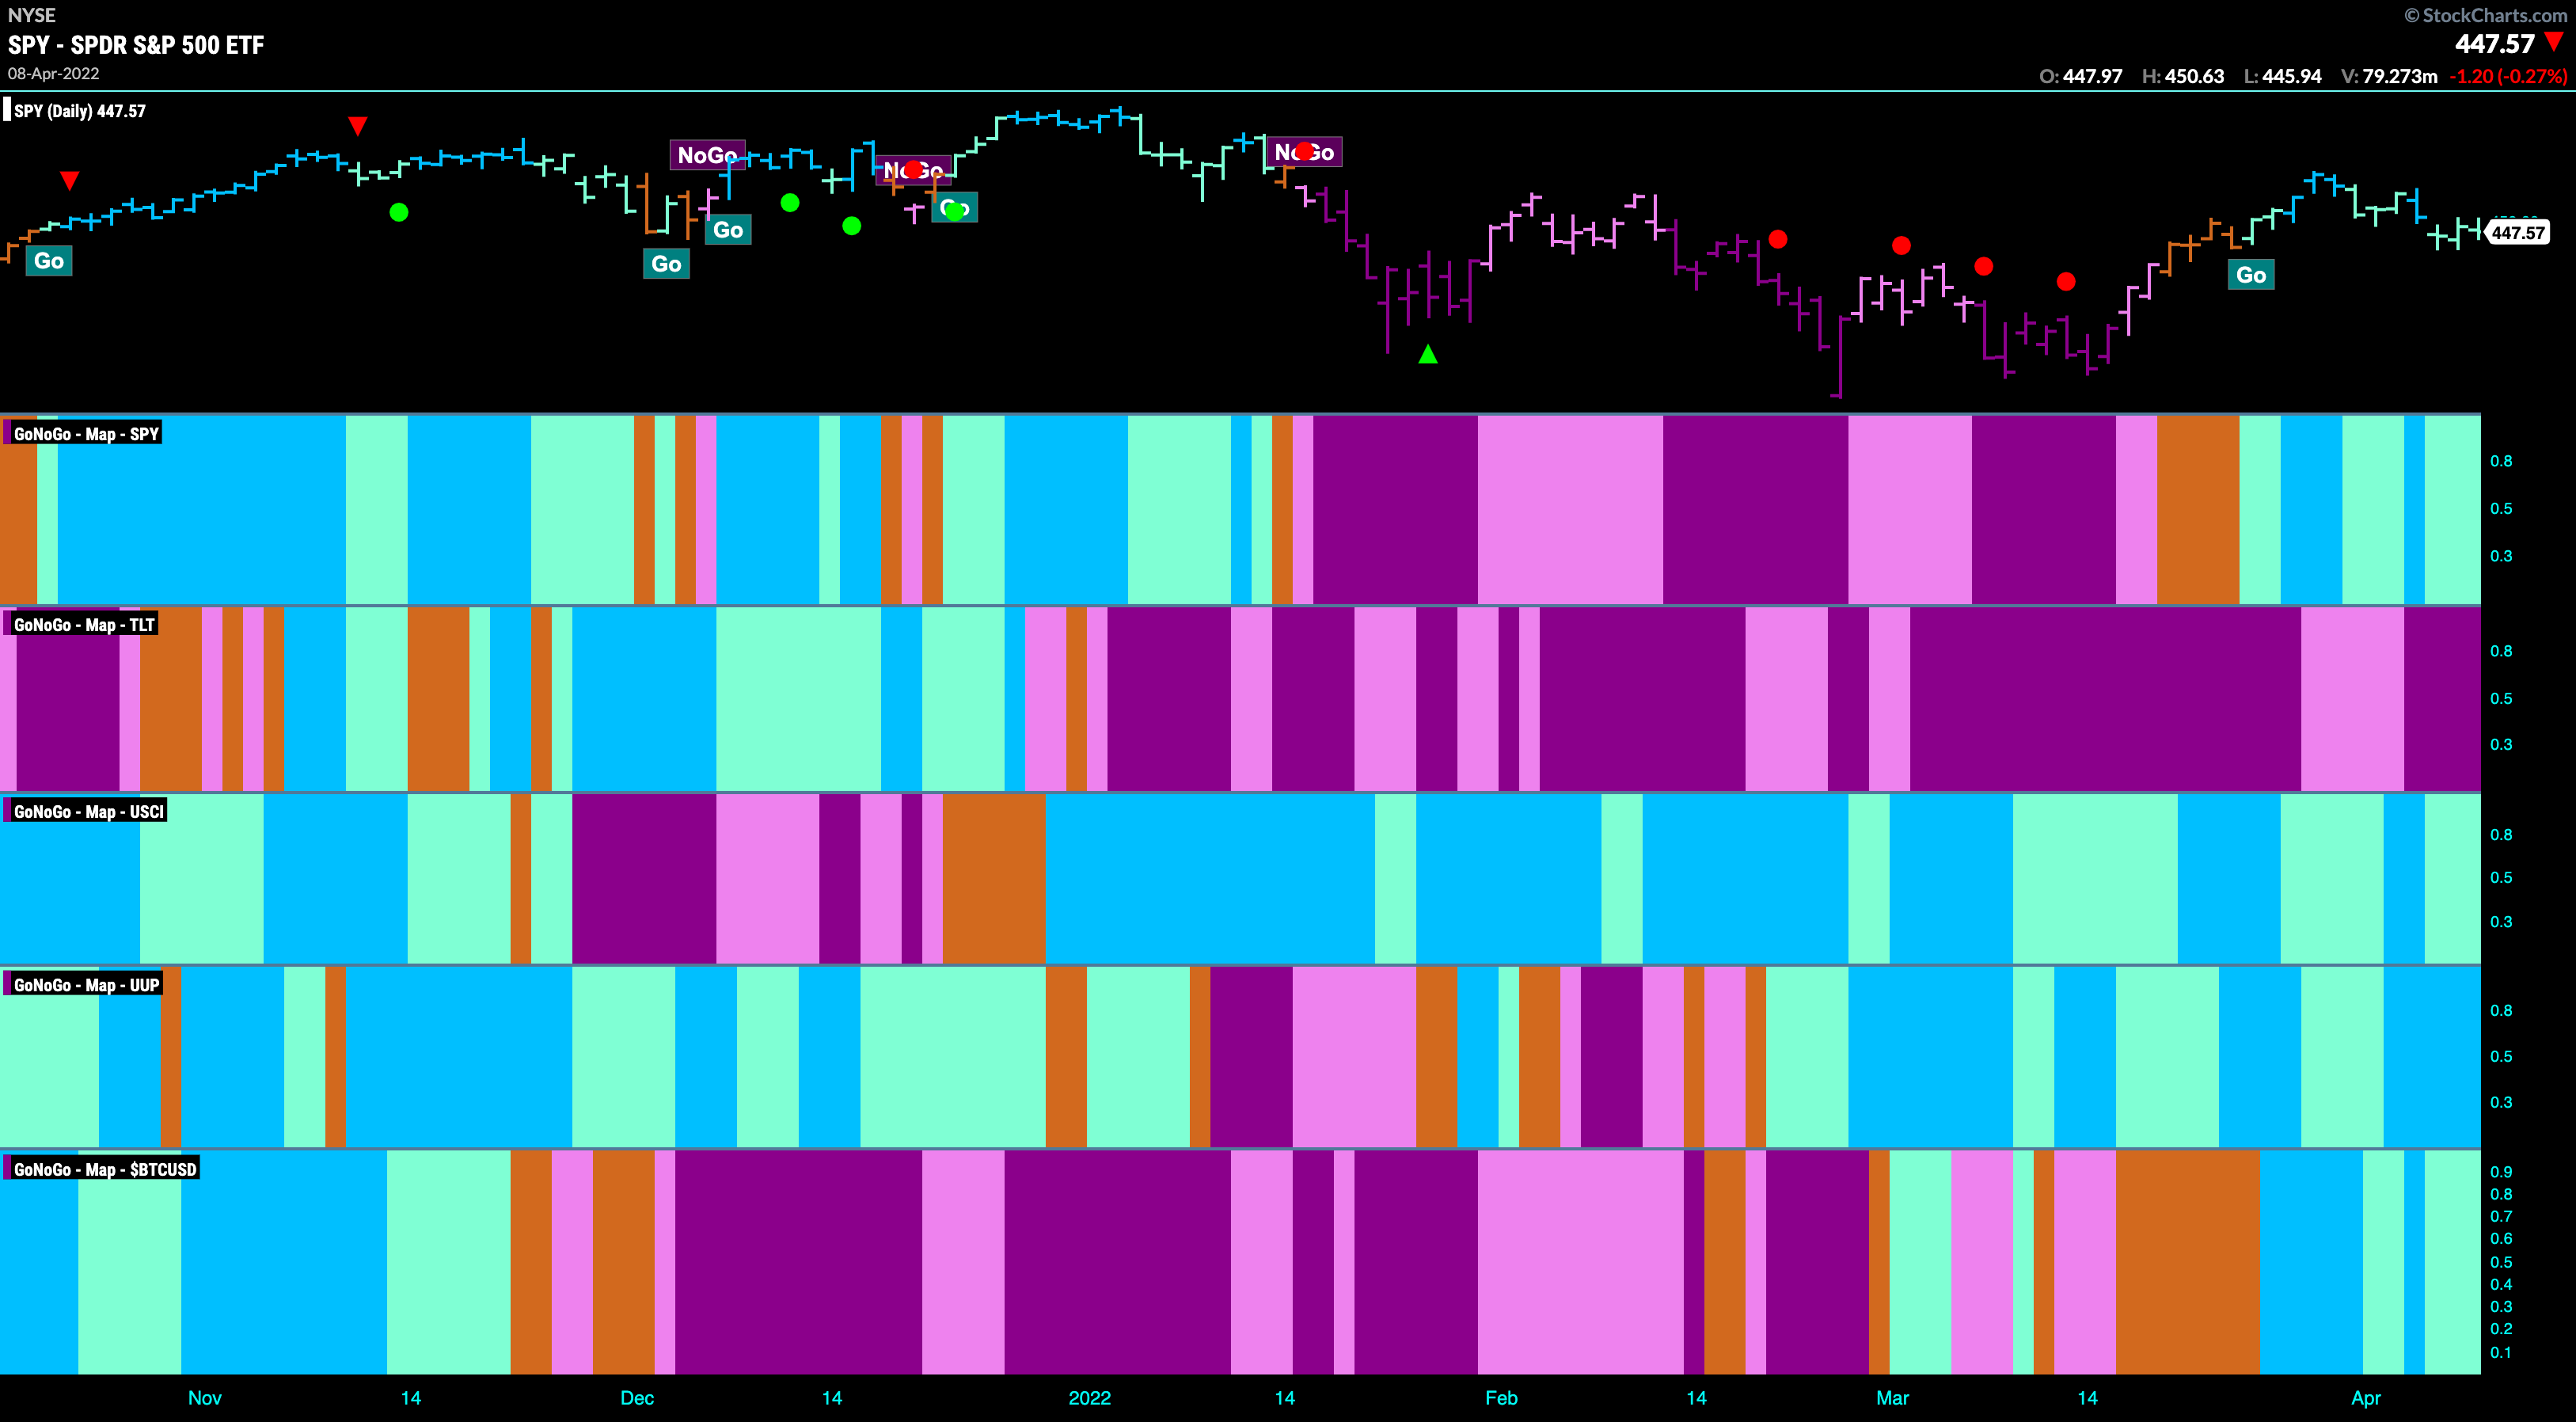
Welcome to your weekly GoNoGo Launch Conditions Chart Pack. We take a look at the major market trends across all asset classes to give an overall, technical view of market conditions. The asset map still says risk on, as “Go” trends persist in equities, commodities, the dollar and bitcoin. We are seeing weakness across all of those trends though, with GoNoGo Trend painting weaker aqua “Go” bars. With crucial inflection points everywhere, we will watch closely to see what happens next. The GoNoGo chart below shows that the “Go” trend is in place albeit painting weaker aqua bars but the GoNoGo Oscillator is at the zero line with the beginnings of a GoNoGo Squeeze building. If the oscillator finds support at zero, we will see a Go Trend Continuation icon (green circle) appear under the price bar. If the oscillator doesn’t find support at zero, that would be a real threat to the “Go” trend in price.
To access this week’s Launch Conditions click here
It’s important to take a step back and assess whether the stories match the price trends. The GoNoGo Trend and Oscillator are applied across the major asset classes to give a complete technical picture of trend and momentum. Click here
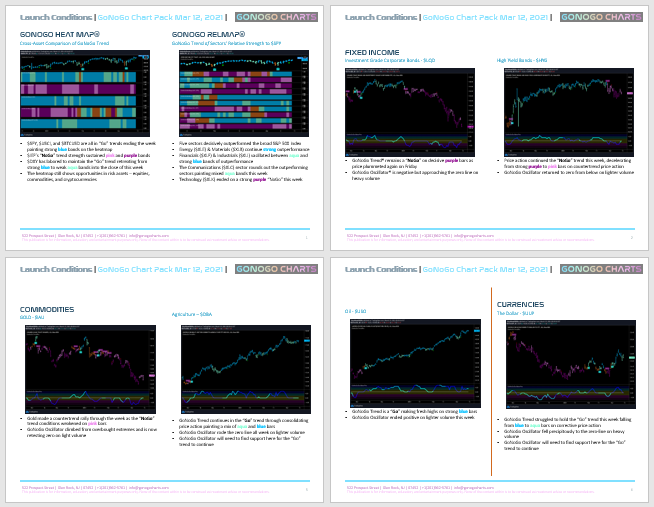
Flip through your weekly Launch Conditions chart pack below


