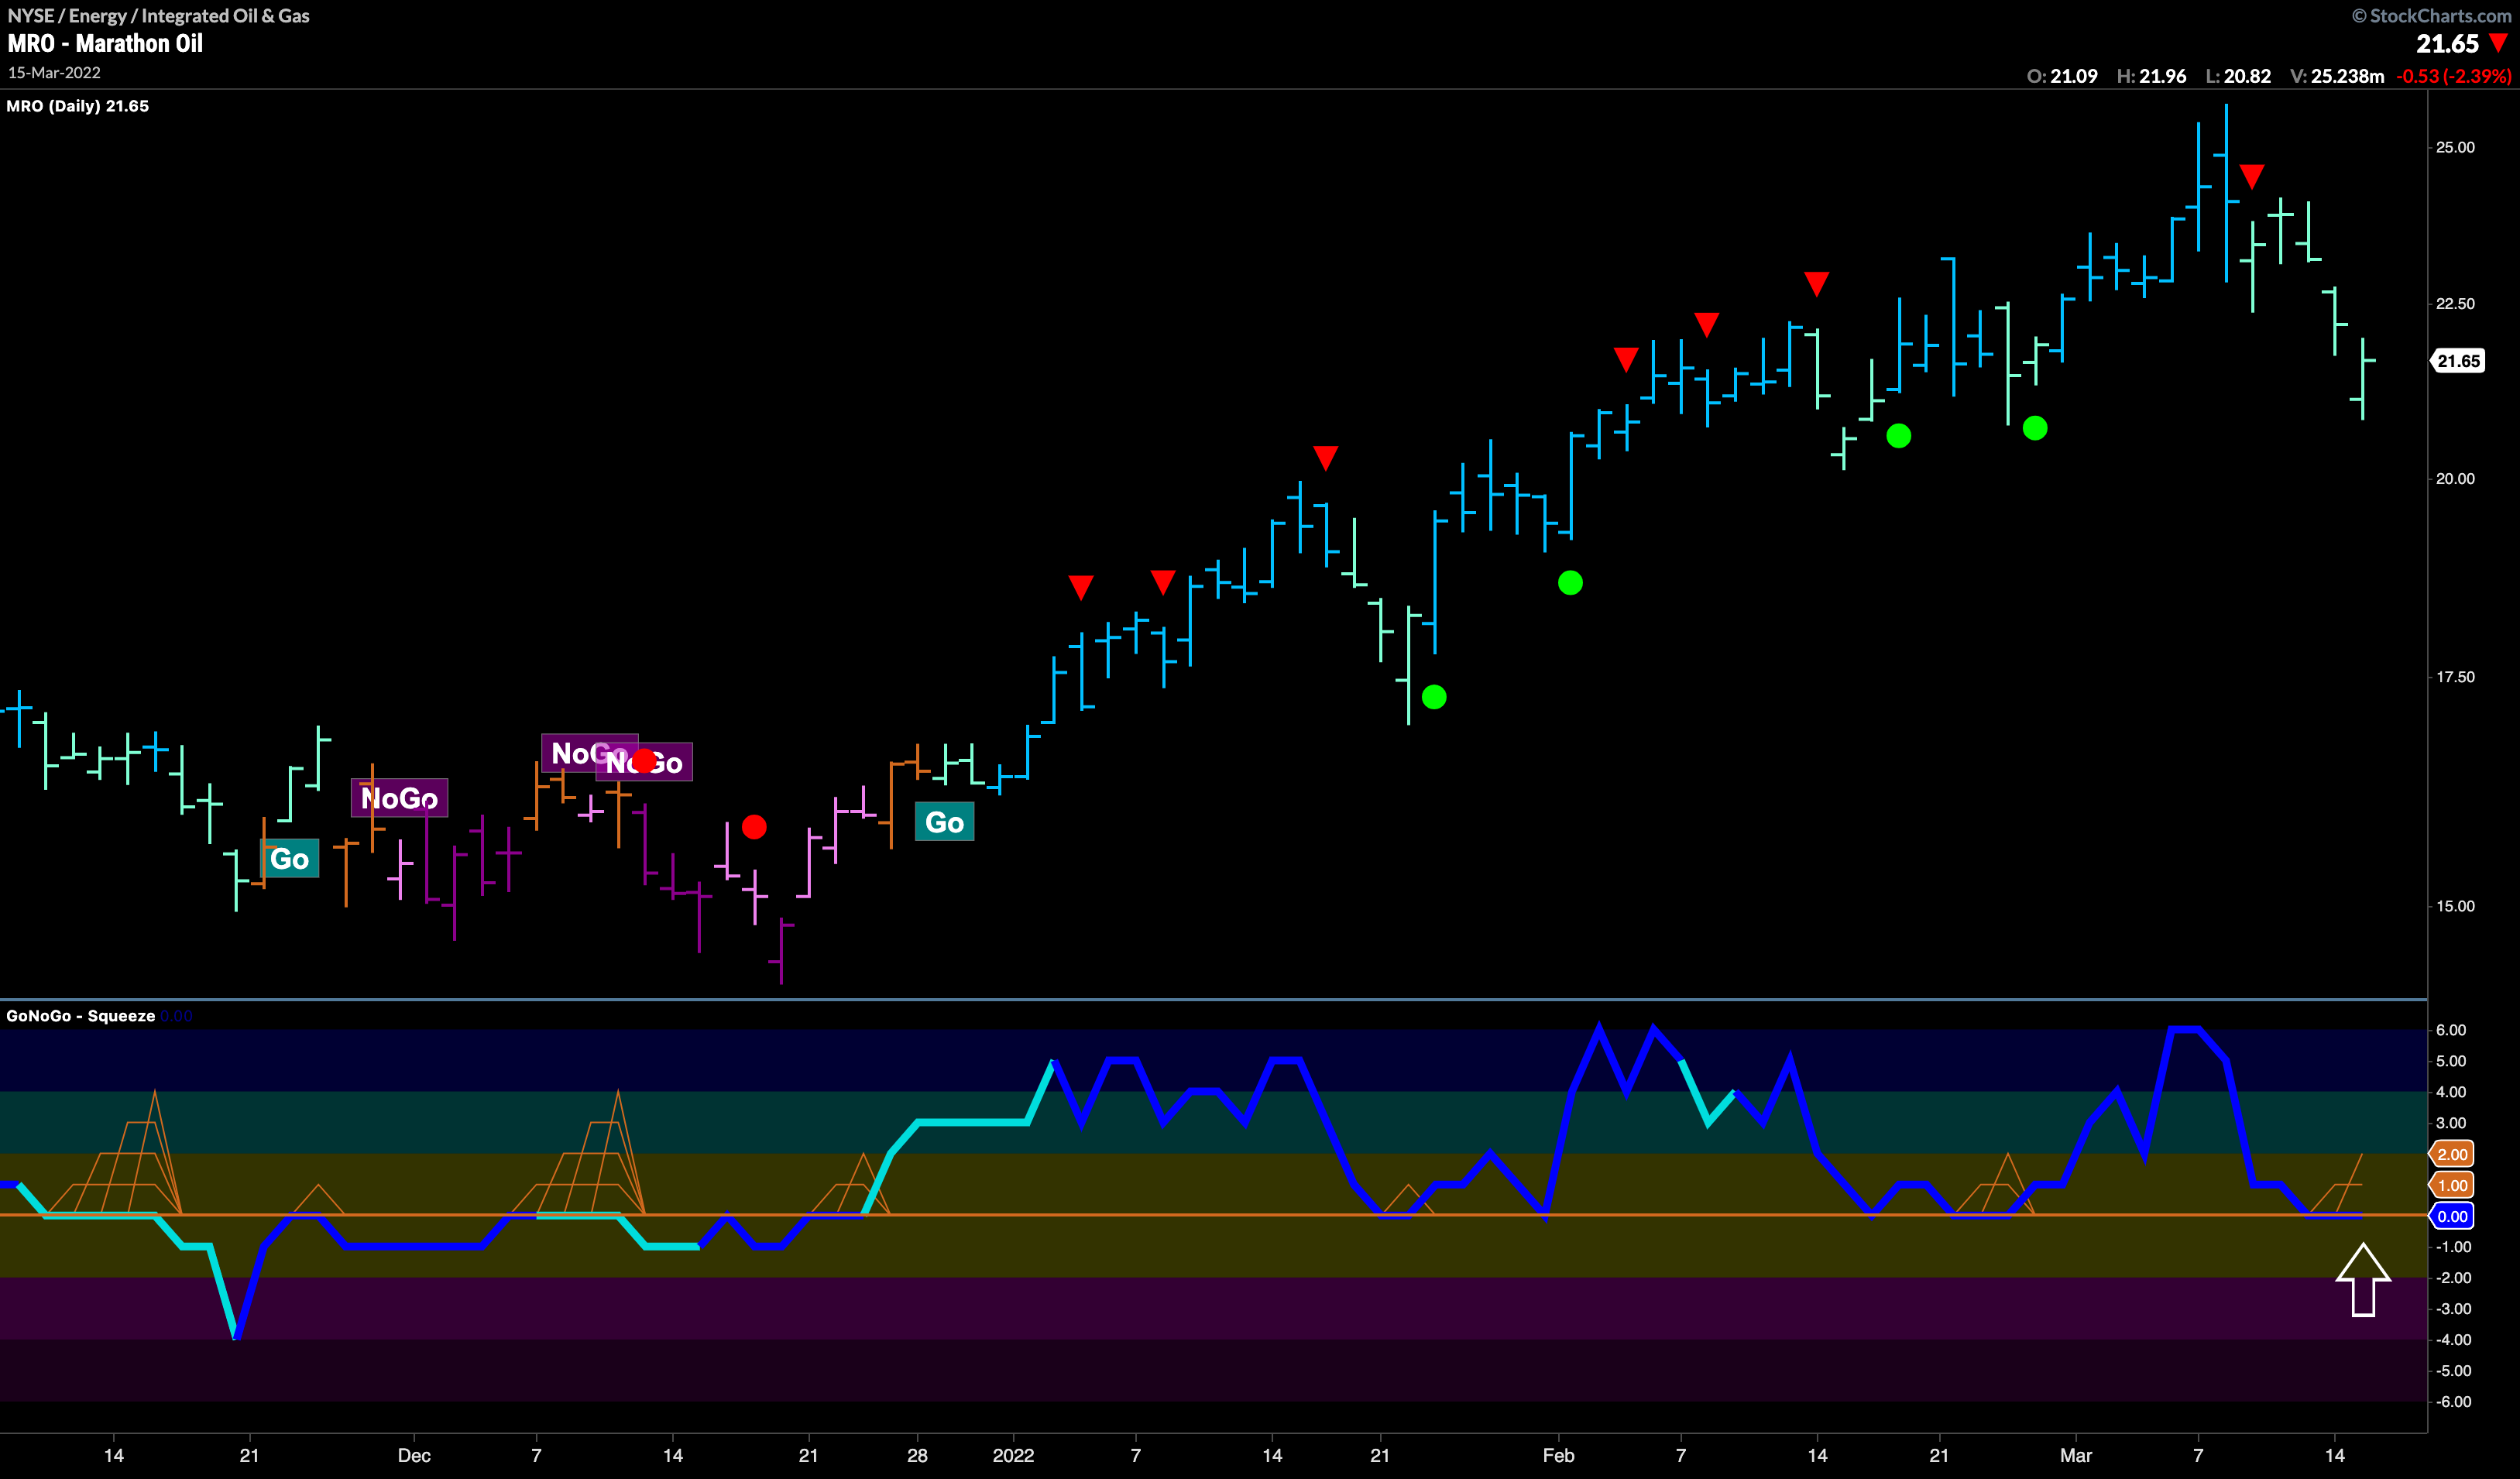
The below chart is of Marathon Oil.
Is this a buy the dip moment? Do we think the pressures on oil prices to move higher have lessened? With OPEC being encouraged to increase supply due to the precariousness of the state of oil coming out of Russia, many think that the correction we have seen in oil prices over the past week will not be permanent. How will we know when gains in oil and oil related stocks will return? Let’s look at the GoNoGo Chart of $MRO. A quick glance at the chart gives us a strategy. We can see that the GoNoGo Countertrend Correction red arrow earlier in March warned us that we may see a short term correction against the trend and price activity has caused GoNoGo Oscillator to fall to the zero line. We know that if the “Go” trend is healthy, the oscillator should find support at this level. If it does, we will see a Go Trend Continuation green circle appear under the price bar which would indicate that momentum is returning in the direction of the “Go” trend. This would offer a relatively low risk opportunity to enter the trade.


