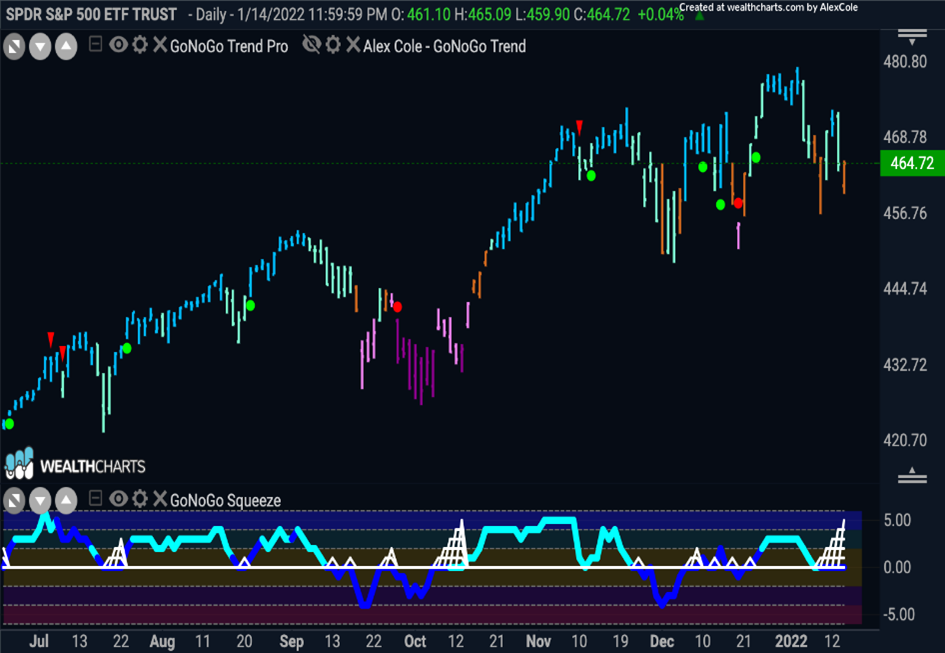
Volatile market swings continued last week. The midweek rally was bookended by selling pressure as GoNoGo Trend conditions (daily data) for major US Equity indices flirted with neutral amber “GoFish” bars. Welcome to your weekly GoNoGo Launch Conditions Chart Pack. The attached chart pack will provide a view of the major market trends across all asset classes to give an overall technical perspective of market conditions.
The large-cap indexes recorded their second consecutive weekly loss to start the year. All eyes were understandably on inflation this week, yet the 10-yr yield was unchanged at 1.77%. A sustained return to multidecade highs in consumer prices has many investors worried that inflation will be a key driver and risk for the year ahead. The US Dollar $UUP finally gave into the persistent inflation narrative and rolled over into a “NoGo” fueling a bounce in $EEM Emerging Markets equities. US indices slipped less than 1% as quarterly earnings season got underway.
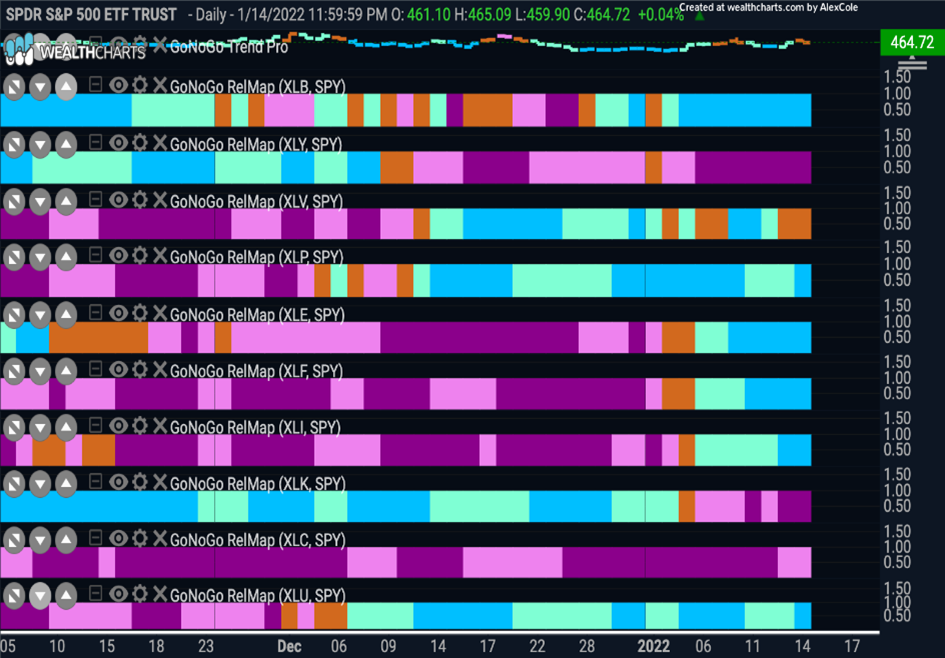
The below GoNoGo RelMap shows that the rotation into cyclical and defensive sectors continues. Six sectors continue to lead the S&P 500 on a relative basis. Materials, industrials, financials, energy, staples, and utilities are in “Go” trends – highlighting their relative strength and outperformance on a trending basis against the index. Also of note, consumer discretionary, communications, and technology are all in “NoGo” trends. Incidentally, the healthcare sector is struggling to hold bullish conditions with more amber bars this week indicating neutrality relative to the index.
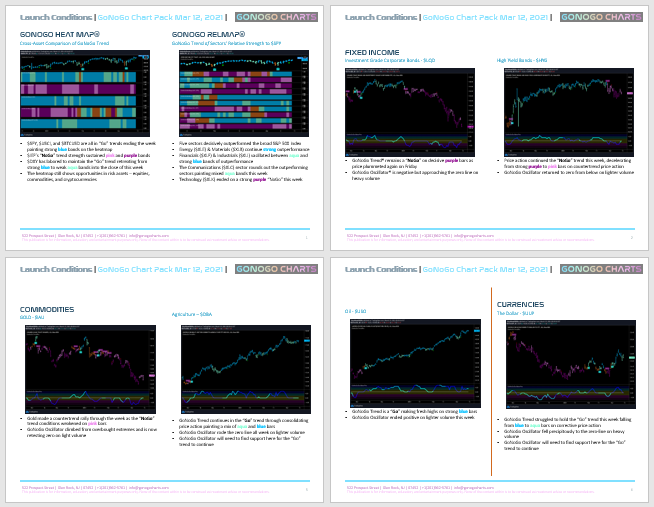
To access this week’s Launch Conditions click here: GoNoGo Launch Conditions Chart Pack 01_15_2022

GoNoGo Research has learned from the best money managers in the business that it’s important to take a step back and assess whether the stories match the price trends and to take stock of the primary trends or directional bias of the markets. Flip through your weekly Launch Conditions chart pack below:
 GoNoGo Launch Conditions Chart Pack 01_15_2022


