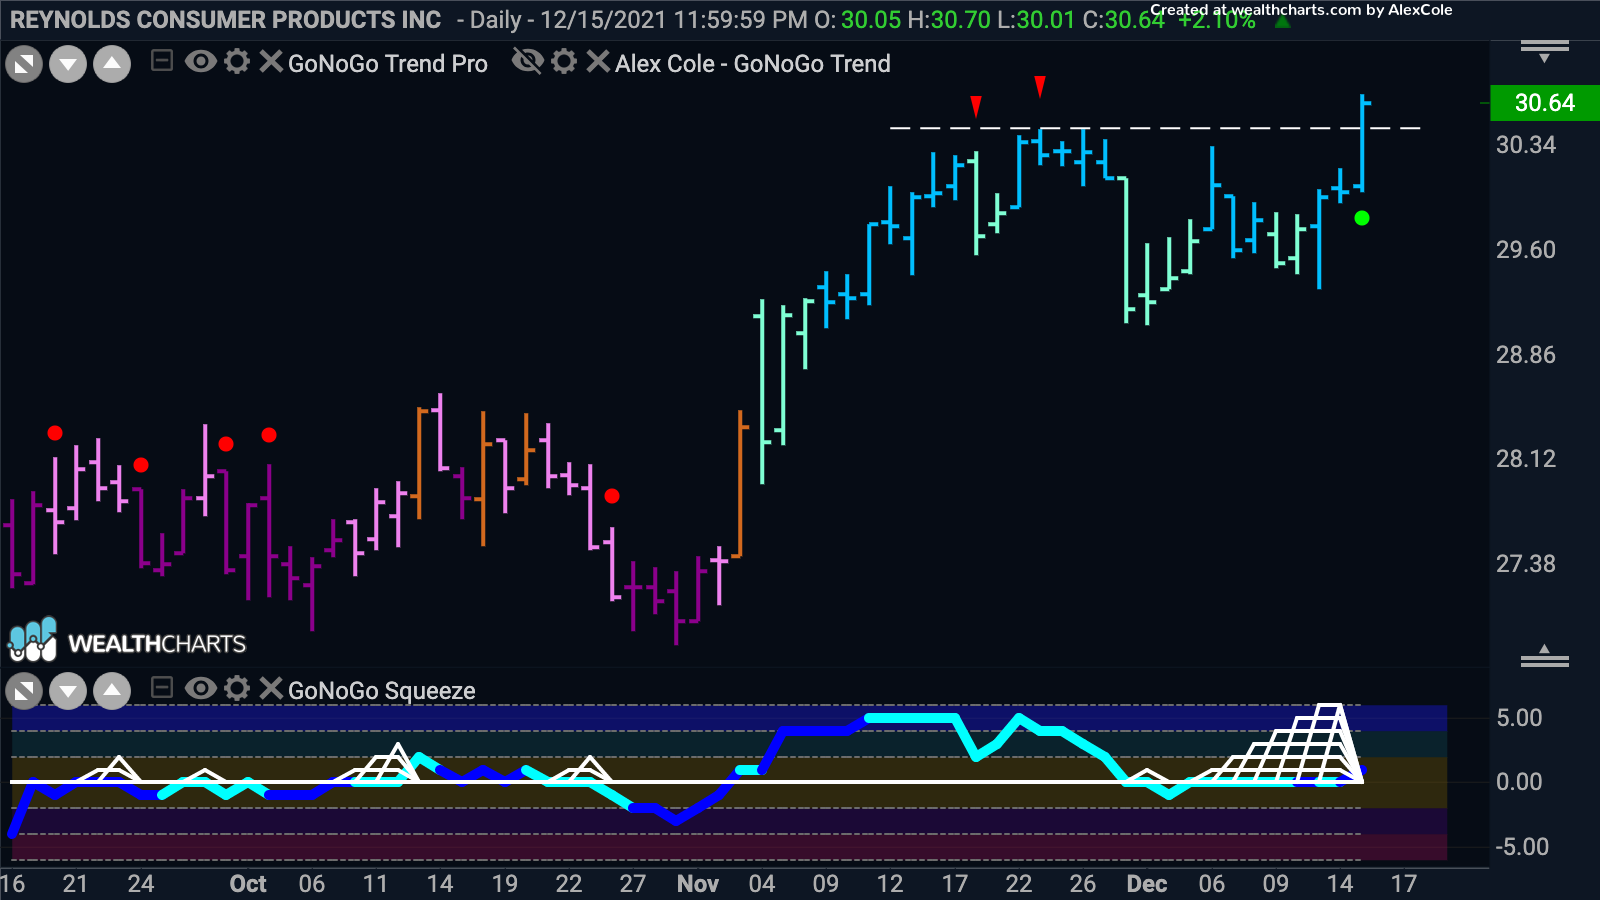

Below is the chart of Reynolds Consumer Products Inc. In early November, GoNoGo Oscillator broke above the zero line and the GoNoGo Trend indicator painted its first “Go” bar.
Since then price has moved higher but we have seen consolidation following the red Go Countertrend Correction arrows at the highs. We saw the oscillator riding the zero line as price moved sideways causing the grid of GoNoGo Squeeze to rise to its extremes. Now, price has surged above prior pattern highs and the oscillator has broken out of the squeeze into positive territory. This has triggered a green Go Trend Continuation icon to appear under price indicating that momentum has returned in the direction of the “Go” trend. We will look for price to consolidate at these levels and set a new high.


