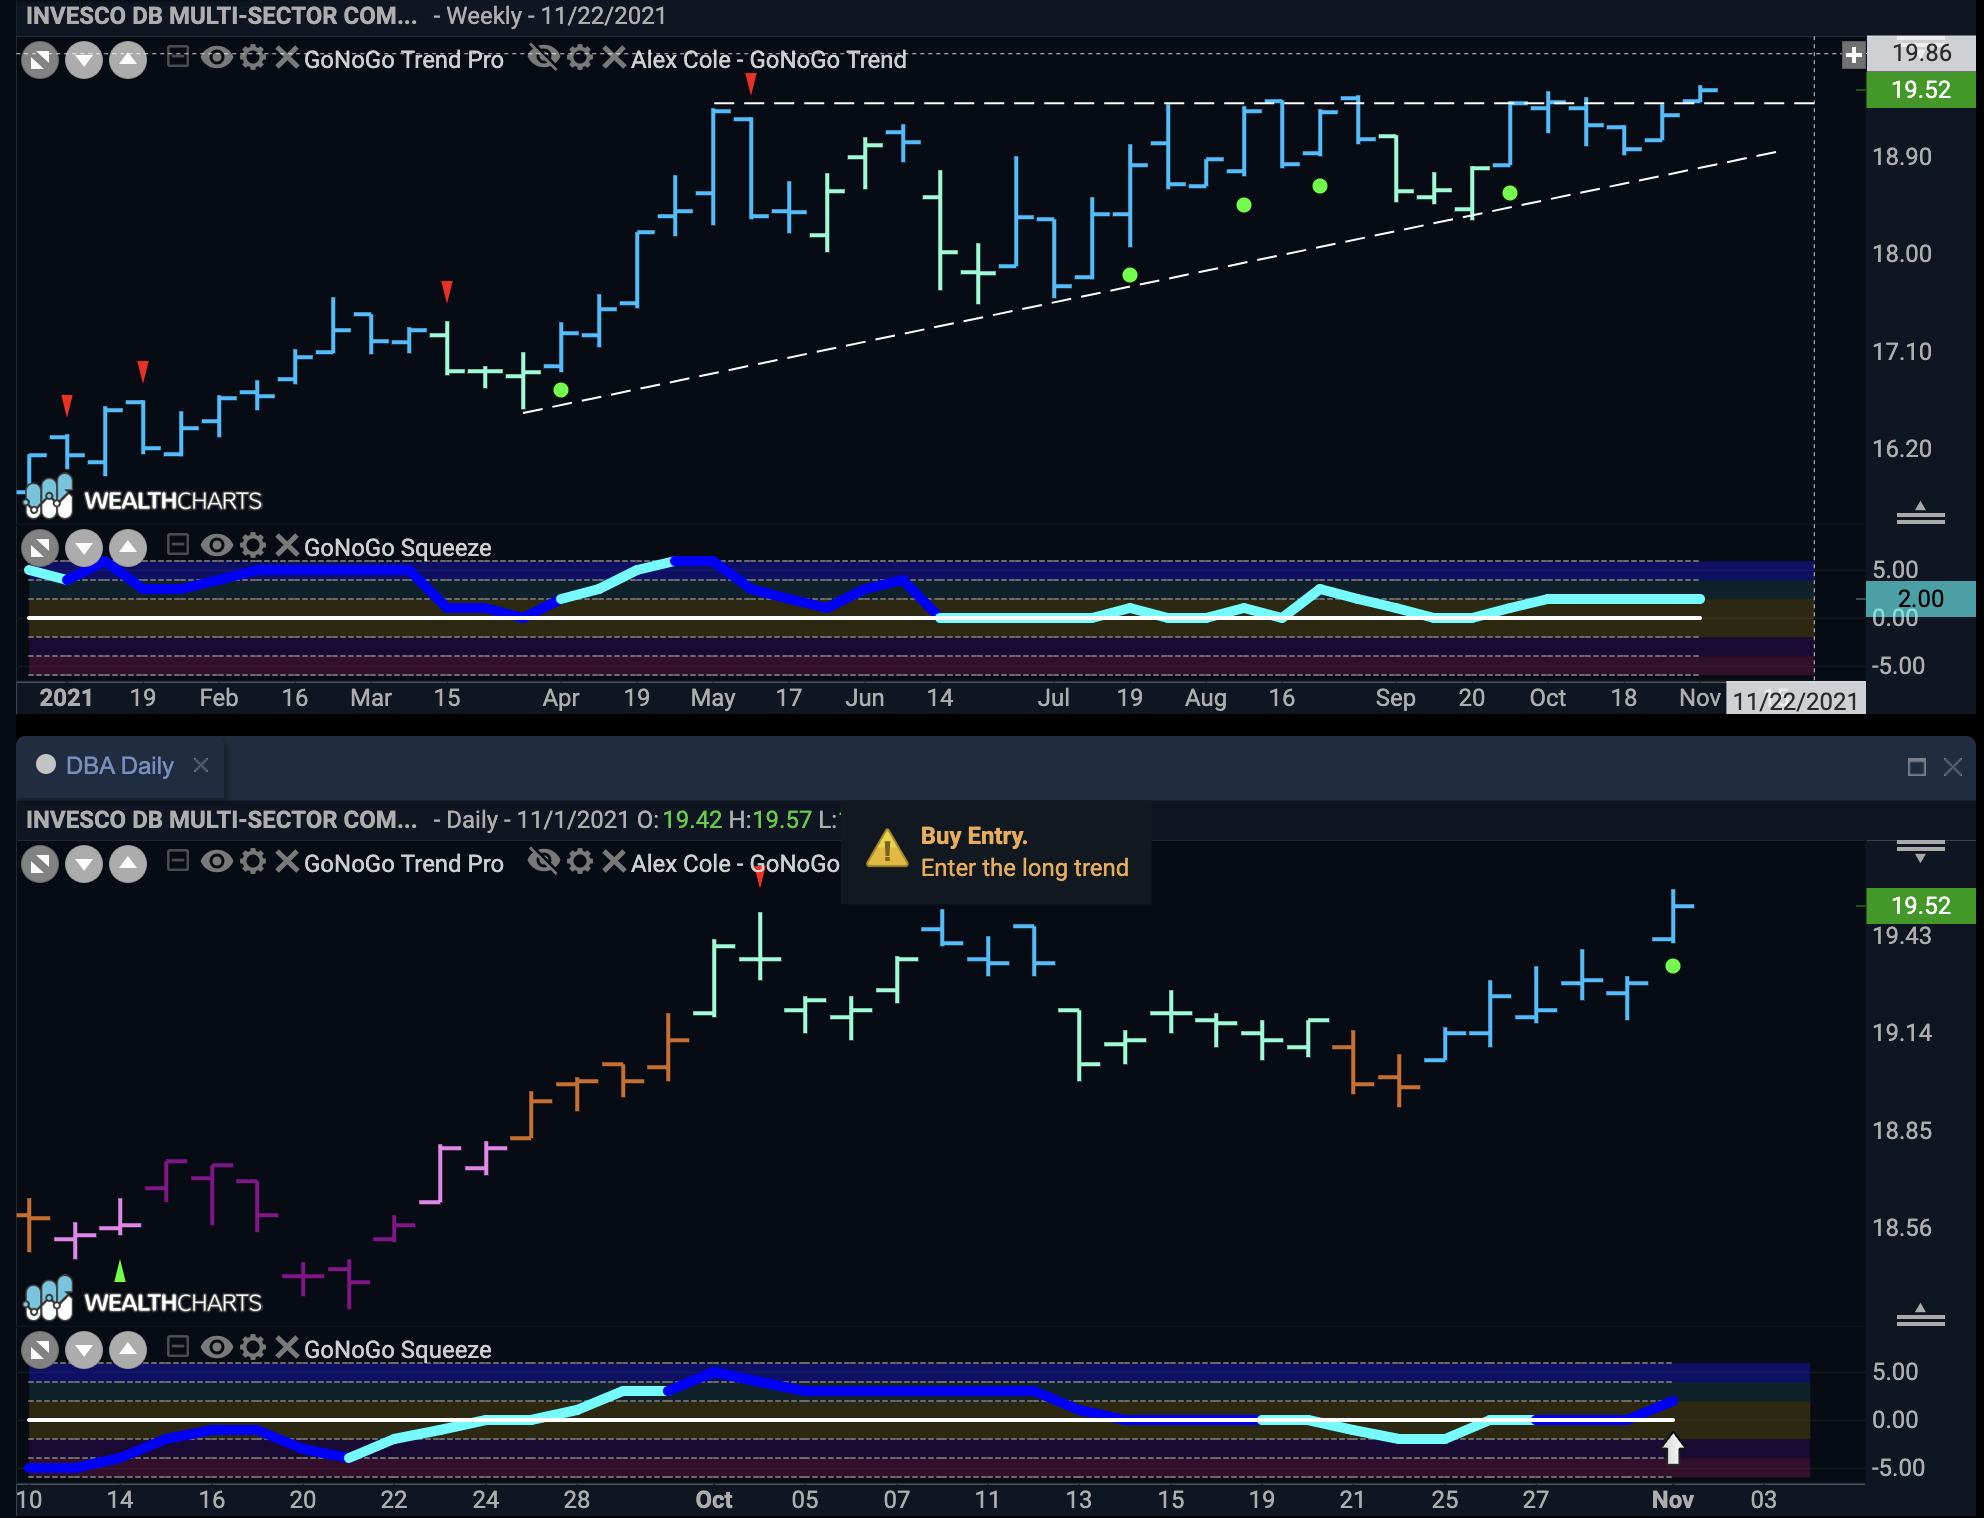
Below is the GoNoGo chart of the Multi Sector Commodity Fund, $DBA. Are we seeing the beginning of a new leg higher for commodities?
On the daily chart you can see that price is up against a prior high from the beginning of October. However, as the trend has strengthened to bright blue bars, we have seen GoNoGo Oscillator able to ride the zero line and then move into positive territory on heavy volume. This has triggered a low risk Go Trend Continuation icon to appear under the current price bar (green circle). This tells us that momentum has come back in the direction of the “Go” trend. We will look for price to make an attack on prior highs. In the double chart image above, we can see that with a longer weekly perspective, the “Go” trend is in place and we are making an attempt to break out to the upside of the upper bound of an ascending triangle.


