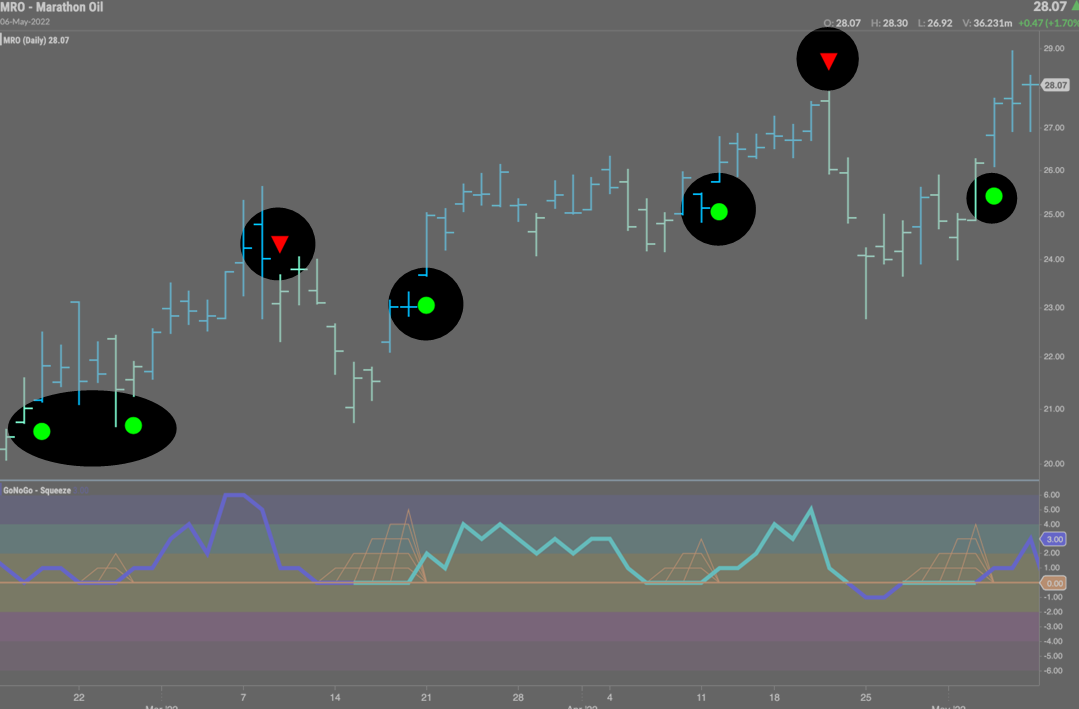
GoNoGo Charts highlight low-risk opportunities for trend participation and alert investors to short-term countertrend corrections with intuitive icons directly in the price action.
The resurgence of momentum in the direction of the trend is an excellent entry opportunity, or the chance to scale up positions. GoNoGo Icons illuminate these events on the chart with green or red solid circles. When GoNoGo Trend is painting blue bars, a green solid circle will appear above price each time GoNoGo Oscillator finds support at zero. When GoNoGo Trend is painting purple bars, a red solid circle will appear each time GoNoGo Oscillator hits resistance at the zero-line from below.
Contrarily, within a “Go” trend, a security’s momentum may reach overbought levels, then fall back toward the zero-line. While in a “NoGo” trend, a security’s momentum may fall to extreme oversold levels, and then cool. As the momentum calculations retreat from extreme overbought or oversold levels, GoNoGo Icons highlight the possible countertrend correction in price.


