Activity continues to expand as Covid threats subside, credit spreads are low, household balance sheets are very strong, and share repurchases are ramping up, supporting the case for a durable bull market.
Jittery markets selling off mid-June over some commentary from a central bank official turned out to be a great opportunity to buy the dip. But, it could have become the start of a more meaningful correction, or the start of a bear market. Making decisions in real-time requires that we understand the regime we are in.
Wednesday will mark the end of trading through the second quarter of 2021. With long-term monthly candles, we can zoom out to understand the primary trend. We get context with which to plan our trading strategy over the shorter term. Taking shorter-term decisions in context with the macro perspective allows for stronger conviction. We hope GoNoGo Research provides a helpful backdrop against which you trade alongside the trend using GoNoGo Charts.
This week, we will consider the weight of the evidence for the bull market and look at the strongest opportunities for market trends. Welcome to your weekly Flight Path from GoNoGo Research.
Risk Appetite is High
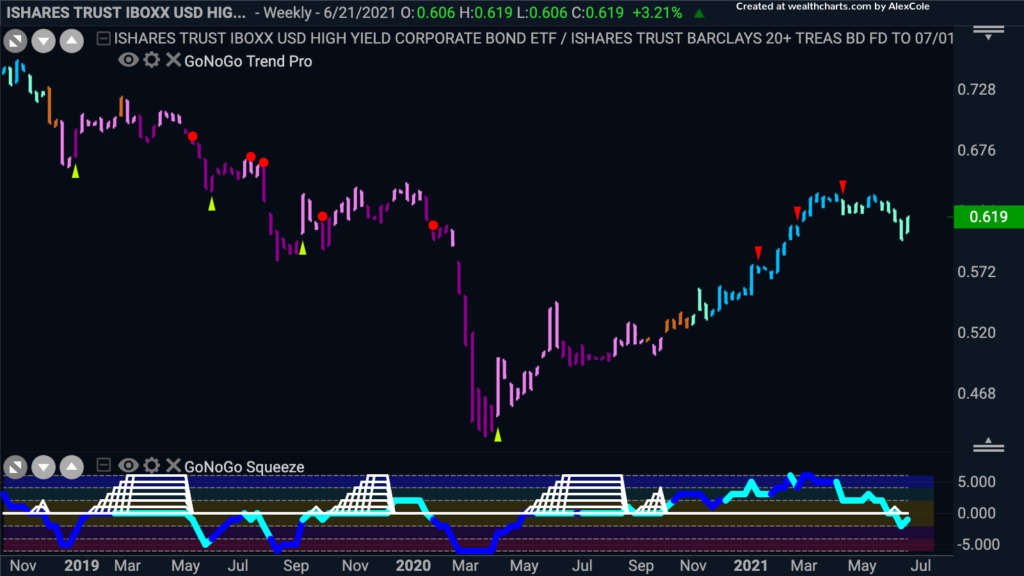
Using a risk proxy – High Yield “junk” bonds relative to 20yr Treasuries $HYG/TLT – we can assess whether investors are in general showing signs of risk aversion or risk appetite. They say the smart money is in the credit markets, so let’s look at this ratio today. Many analysts look at currency pairs or other ratios as a risk proxy as well.
If bond traders were fearful of an impending collapse, they would buy up the safest most stable elements of the fixed income universe. This ratio suggests, however, that we are trending back into a risk-on environment. The trend has been a “Go” for risk-on trading, but after 5 declining weekly bars we saw the potential rollover in relative strength. This week’s session regained stability in the ratio with a solid weekly up bar printed last week and the oscillator turned back up to zero.
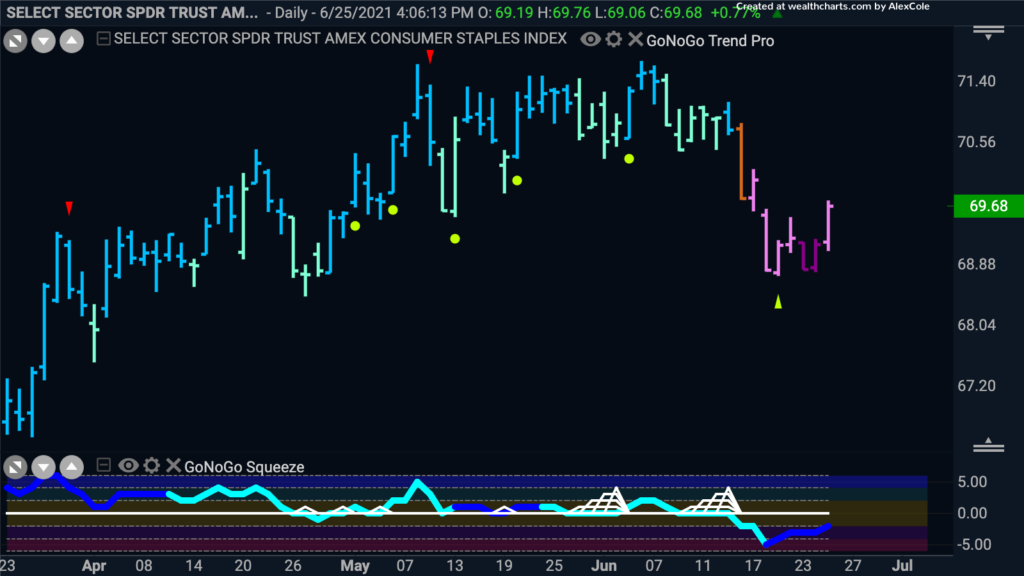
In a risk-on environment, we should not see investors running to defensive sectors of the market, and indeed they are down. For example, see the performance of the Consumer Staples sector $XLP:
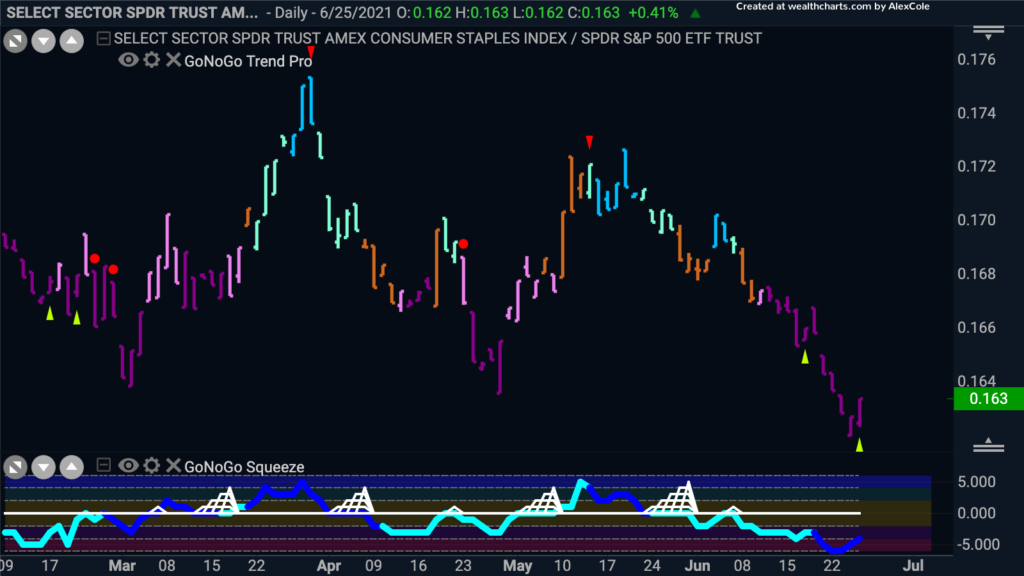
The Consumer Staples sector relative to the S&P 500 Index shows that defense is lagging. As the Nasdaq Composite and S&P 500 are breaking out to all-time highs again, offensive sectors are leading the market. See the daily GoNoGo Chart below of $XLP/SPY showing a strong purple NoGo trend:
Other flights to safety include precious metals like gold. This was a rather exciting alternative for many investors amidst inflation fears, but now look at the trend in $GLD with the flight path of a BRICK thrown off a roof!
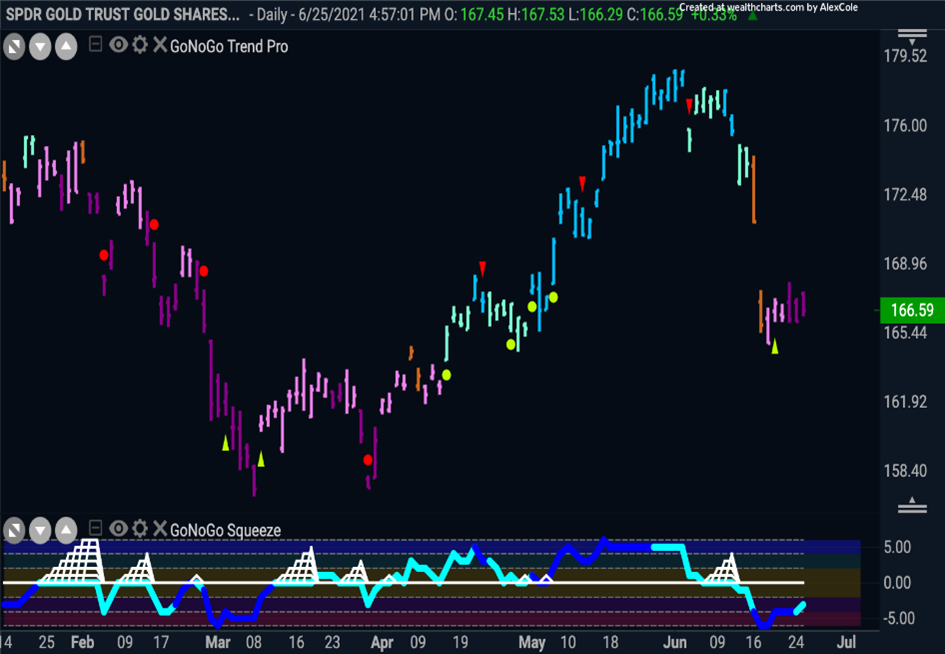
Gold prices consolidated the prior losses this week as the GoNoGo Trend painted strong purple “NoGo” bars. GoNoGo Oscillator is below zero but not extremely oversold. The path of least resistance continues to be lower
How would we know if we are wrong?
We can see that traditional intermarket correlations are not precisely in line with expectations. Take a look at the GoNoGo HeatMap below looking across asset classes:
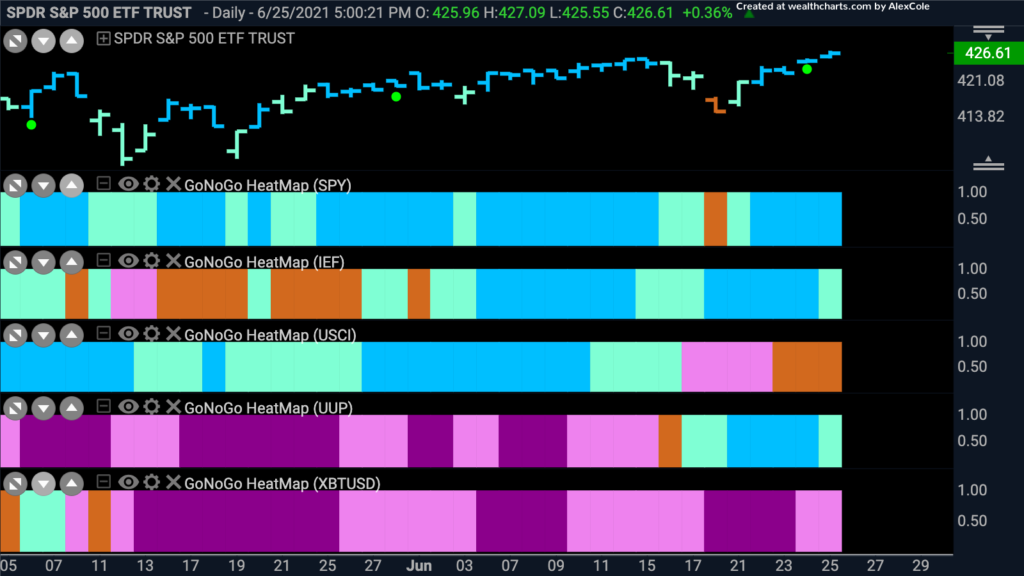
Equities “Go” = Bullish
Treasuries “Go” = Bearish
Keep in mind that allocating to treasuries over equities is a flight to safety, but rising bond prices bring yields down. Falling yields relieve the threat of inflation pressures and potential Fed tightening of money supply. Right now, Fed posture is a greater focus for investors
Commodities “GoFish” = Neutral
A cooling period for commodities after a strong “Go” mitigates fears of runaway inflation. Commodities are priced in USD and therefore inversely correlated to the dollar index.
US Dollar Index “Go” = Bearish
When investors are raising cash as a flight to safety instead of greater exposure to equities, that is bearish. Stronger USD can also provide headwinds to emerging markets and commodities. At this moment, a stronger dollar, as well as strong equity performance, suggests global confidence in the US economic expansion and the use of USD as a reserve currency.
CryptoFX “NoGo” = Bearish
Speculation in digital assets is yet too small of an asset class to have an impact on intermarket relationships, but generally growing participation could be considered bullish. A cooling of speculative sentiment is also a sign that this market is not yet too frothy.
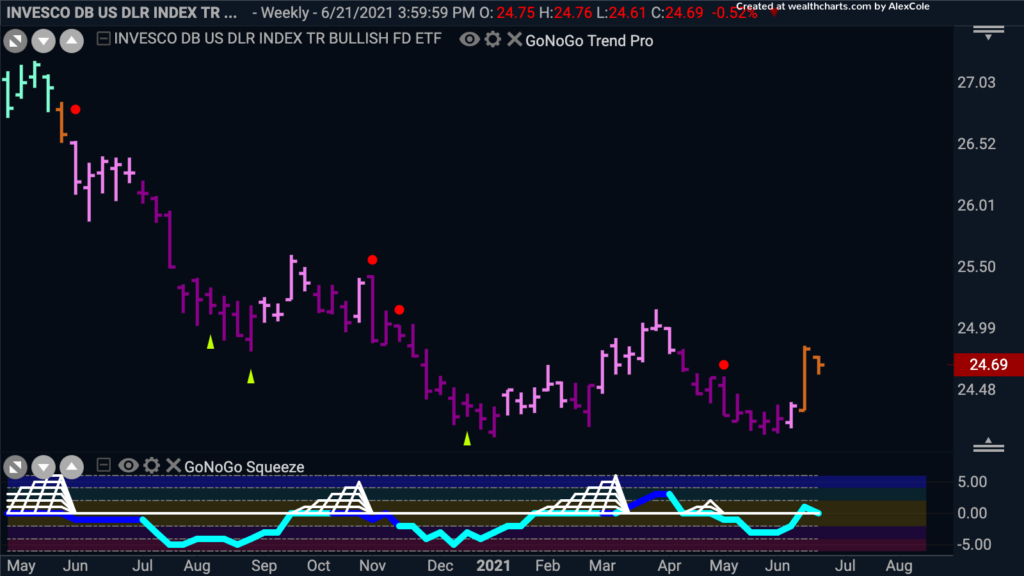
A closer look at the US Dollar
Weekly GoNoGo Trend charts show the US Dollar Index formed a double bottom off of its long-term support level. Currently in neutral amber bars, the oscillator is hovering around zero.
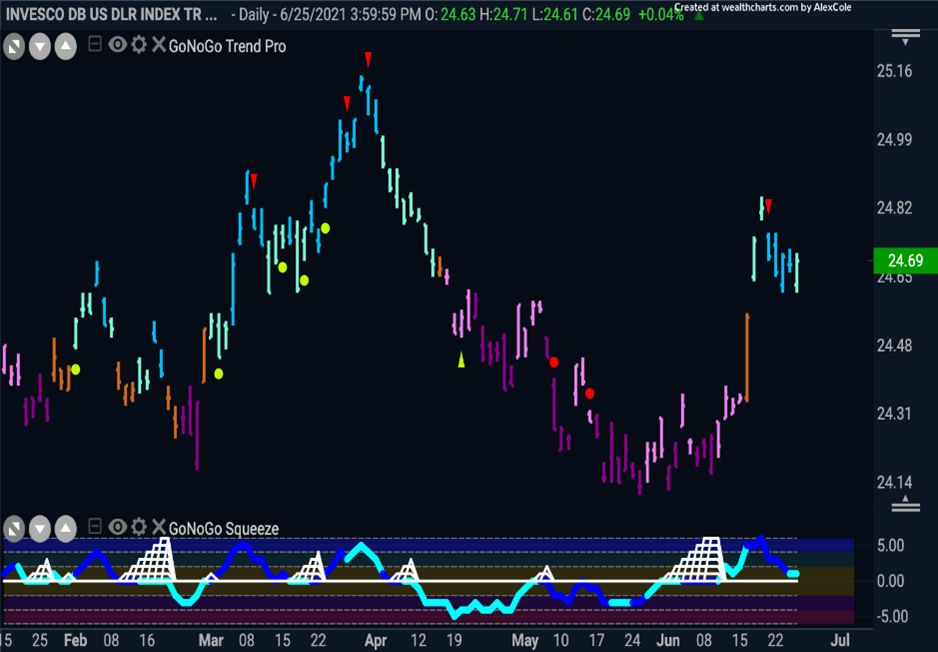
On the daily chart, we see GoNoGo Trend continues to paint “Go” bars as price consolidates. GoNoGo Oscillator has fallen near to the zero line where we will look to see if it can find support:
Rotation Comes Full Circle
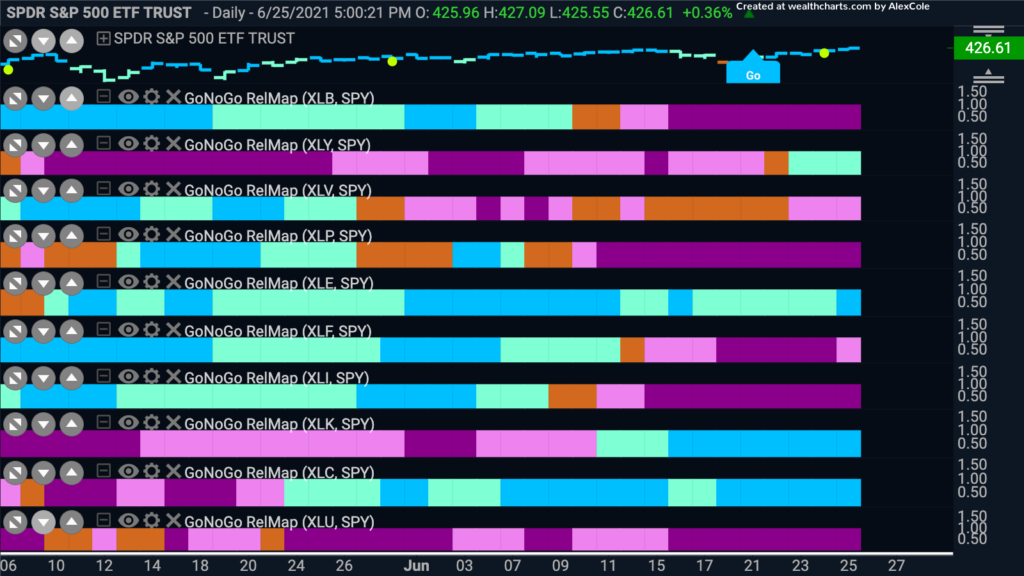
So, knowing we are in a bullish regime, investors must ask where are the opportunities? For that, we turn to the GoNoGo Relmap of the S&P Sectors.
All sectors of the S&P 500 were up last week. Energy shares fared best within the S&P 500. The energy sector climbed 6.7% as oil prices reached their highest levels since October 2018 on falling global inventories. Financials erased last week’s losses as well, gaining 5.3% after the spread of 10yr/2yr notes widened (1.54%/0.27%), and the yield curve steepened.
But that is absolute performance. Financials bounced sharply after a week of heavy losses. Look at the chart below to see the sectors whose outperformance of the S&P 500 index is trending. The rotation has come full circle. The sectors which led the rally in 2020 and which offered no return in 2021 have come back into leadership. See $XLK, $XLC, $XLY, and $XLE below.
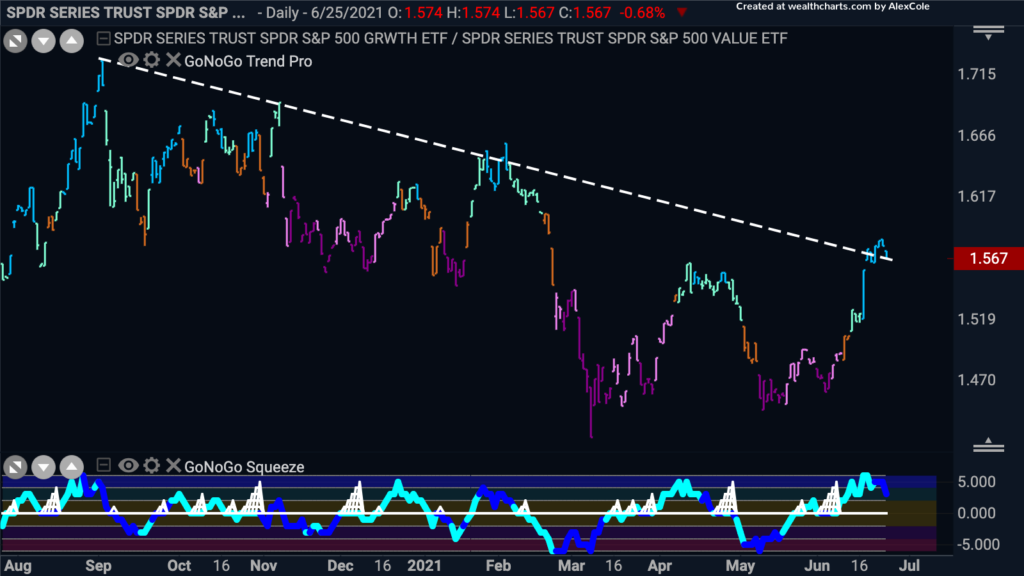
Growth vs Value
We can see that the ratio of growth to value has swung back in the favor of growth stocks. We will need to see the ratio consolidate above this trend-line but currently, growth stocks are in the ascendency.
Right now, some names to keep an eye on are within the growth areas of the market.
Individual Security Trends
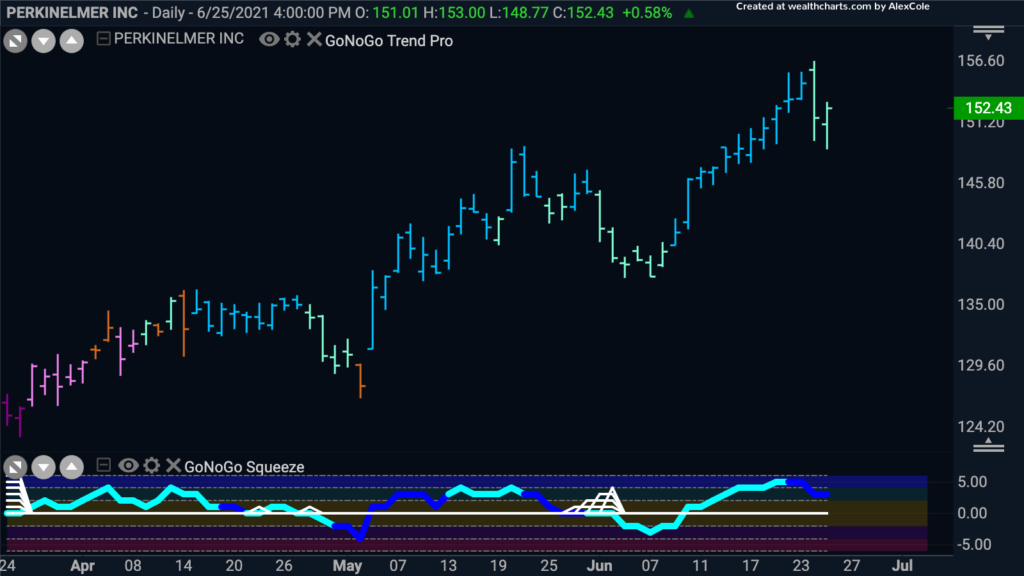
PerkinElmer is a provider of technology, services, and solutions to diagnostics, life sciences, and other markets. Its products include equipment used for genetic screening and drug discovery, optoelectronics, analytical instruments, and more. With 1020% EPS growth and more than 100% growth in revenues year over year, $PKI is a company to consider. Look at the weekly GoNoGo Trend chart below, where $PKI is consolidating gains from the prior momentum move as it reaches toward prior all-time highs.
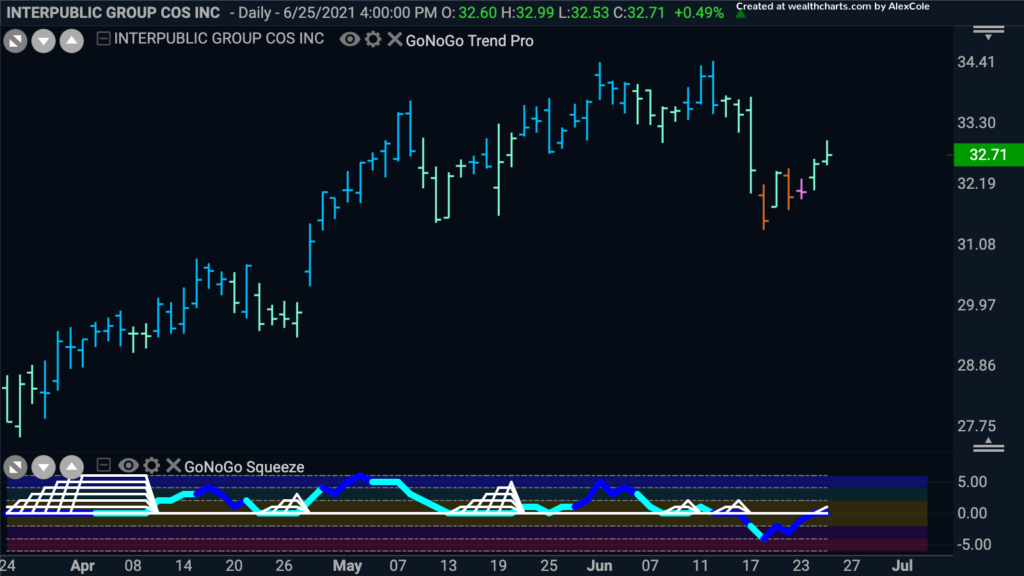
The Interpublic Group of Companies $IPG) is a group of advertising and marketing service companies. It specializes in consumer advertising, digital marketing, communications, planning and media buying, public relations, data management, and more. With 2200% EPS Growth, this relative small-cap media company could be approaching a breakout phase. See the chart below and watch the GoNoGo Oscillator this week for a break into positive territory signaling a low-risk entry opportunity.
