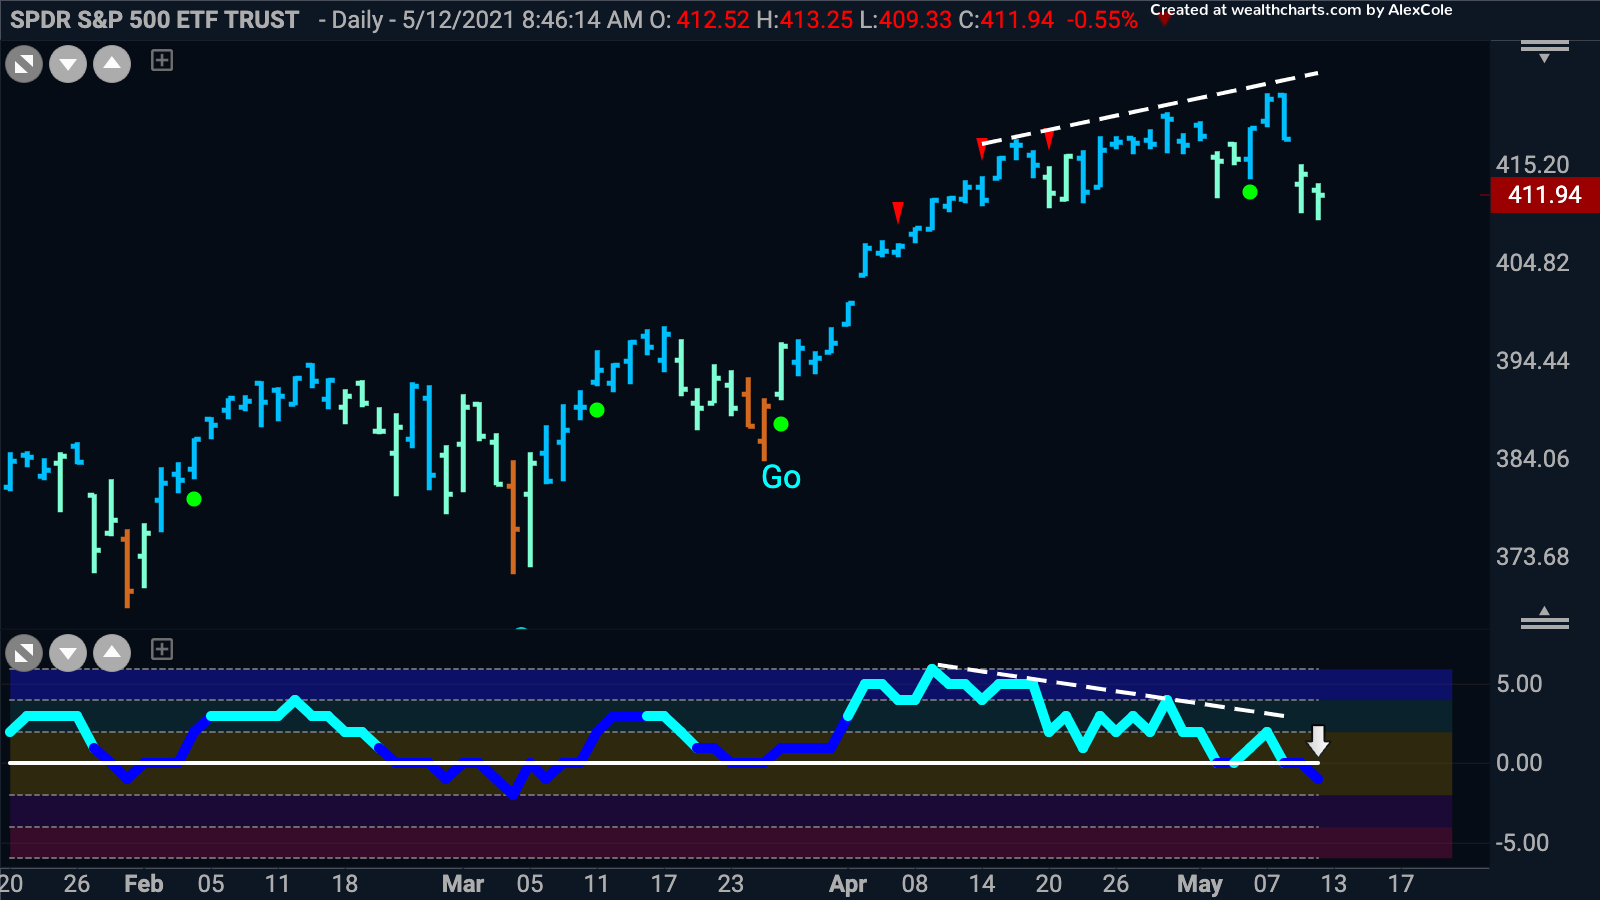
The S&P 500 is at a critical juncture. The GoNoGo chart above uses the $SPY to represent the index. The last two price bars have shown the market taking corrective measures.
Having set another higher high this week, price moved sharply lower to end the week. The GoNoGo Trend is painting weaker aqua bars and the GoNoGo Oscillator has fallen into negative territory for the first time since early March. This is a cause for concern regarding the “Go” trend because we understand that in a healthy “Go” trend, momentum readings should not cross into negative territory as that indicates some instances of oversold conditions. This also comes after significant bearish divergence between price and the GoNoGo Oscillator. The last few times the oscillator has crossed below zero, the “Go” trend has been able to hang on barely, but briefly painted neutral “Go Fish” amber bars. There is some likelihood therefore of more downward price action even if the “Go” trend can fight to stay alive again.


