$CMI is in a very strong longer term trend. A quick glance at the weekly GoNoGo Chart will show uninterrupted blue “Go” bars with the GoNoGo Oscillator staying above and finding support at the zero line since last spring.
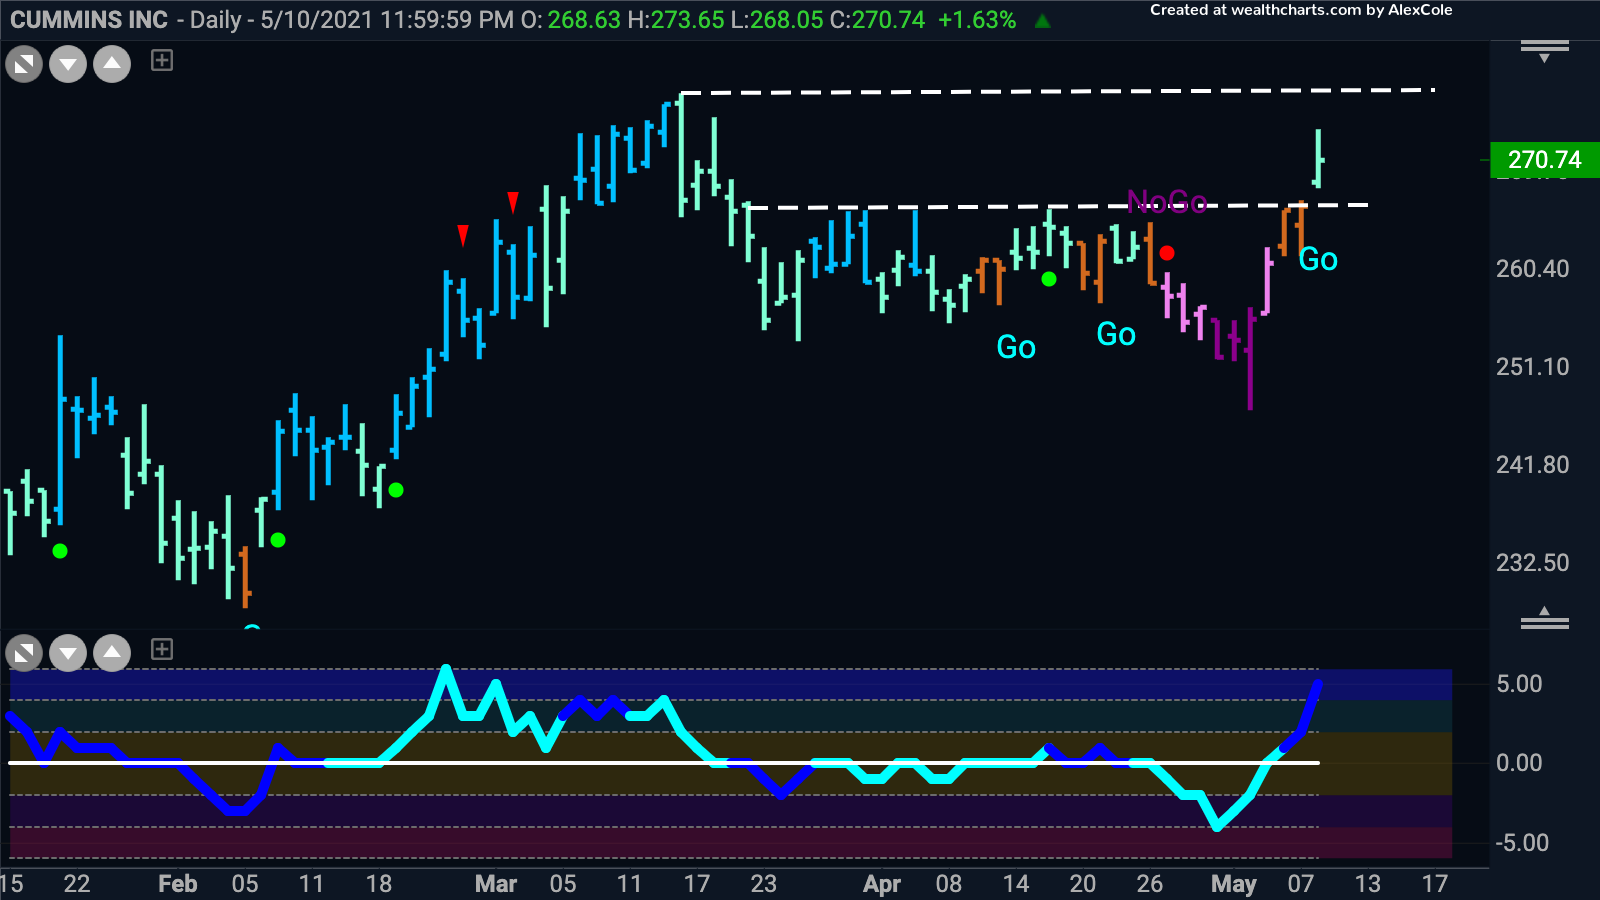
If we turn to a daily chart to assess the opportunity for taking a position in this large timeframe trend, we can see that after a choppy period, the GoNoGo Trend has flagged a new “Go” signal that breaks out above resistance from the consolidation period. $CMI showed strength yesterday while the markets as a whole struggled and we will look to see if price can march on to test the high from mid March.


