
Where are the opportunities to be found this week? Perhaps that is too hard a question to answer. However, we can start by looking in the most sensible places. Fish where the fishes are… The “Go” trends are in equities and commodities as they have been for months and months. Treasuries flirted with the amber “Go Fish” bars last week but this week the “NoGo” trend resumed, albeit with the GoNoGo Trend painting weaker pink bars. The Dollar index saw further selling this week. And so U.S. equities remain strong with earnings season going swimmingly and the majority of companies beating estimates. Rumors of inflation remain just that, and for the moment, fears surrounding the overvaluation of equities haven’t been brought to bear. Welcome to your weekly Flight Path market review from GoNoGo Research.
"If you can make one heap of all your winnings
   And risk it on one turn of pitch-and-toss,
And lose, and start again at your beginnings
   And never breathe a word about your loss;" — Rudyard Kipling
Cross Asset Comparison | GoNoGo HeatMap
In a top-down approach to market analysis, investors need to compare across asset classes. Below is a GoNoGo Heat Map® which highlights the trend conditions of equities, fixed income, commodities, currencies. “Go” trends are in place for Equities and Commodities. As you’d expect treasuries slipped back into a “NoGo” and join the dollar index in pinks and purples. Risk is still on.

Equity Sectors Relative Strength | GoNoGo RelMap
The S&P 500 is still in a strong “Go” trend. We can dive into the sectors to get a sense of where relative outperformance exists. Remember, the GoNoGo RelMap applies the GoNoGo Trend concept of blending foundational technical concepts to identify trend to relative ratios.
See the GoNoGo RelMap® below of the S&P sectors relative performance against the broader index:

- Materials ($XLB) continue to lead the way with Consumer Discretionary ($XLY), Industrials ($XLI) and now Utilities ($XLU) are in “Go” trends
- Technology has slipped back into amber “Go Fish” bars this week
Materials on the make
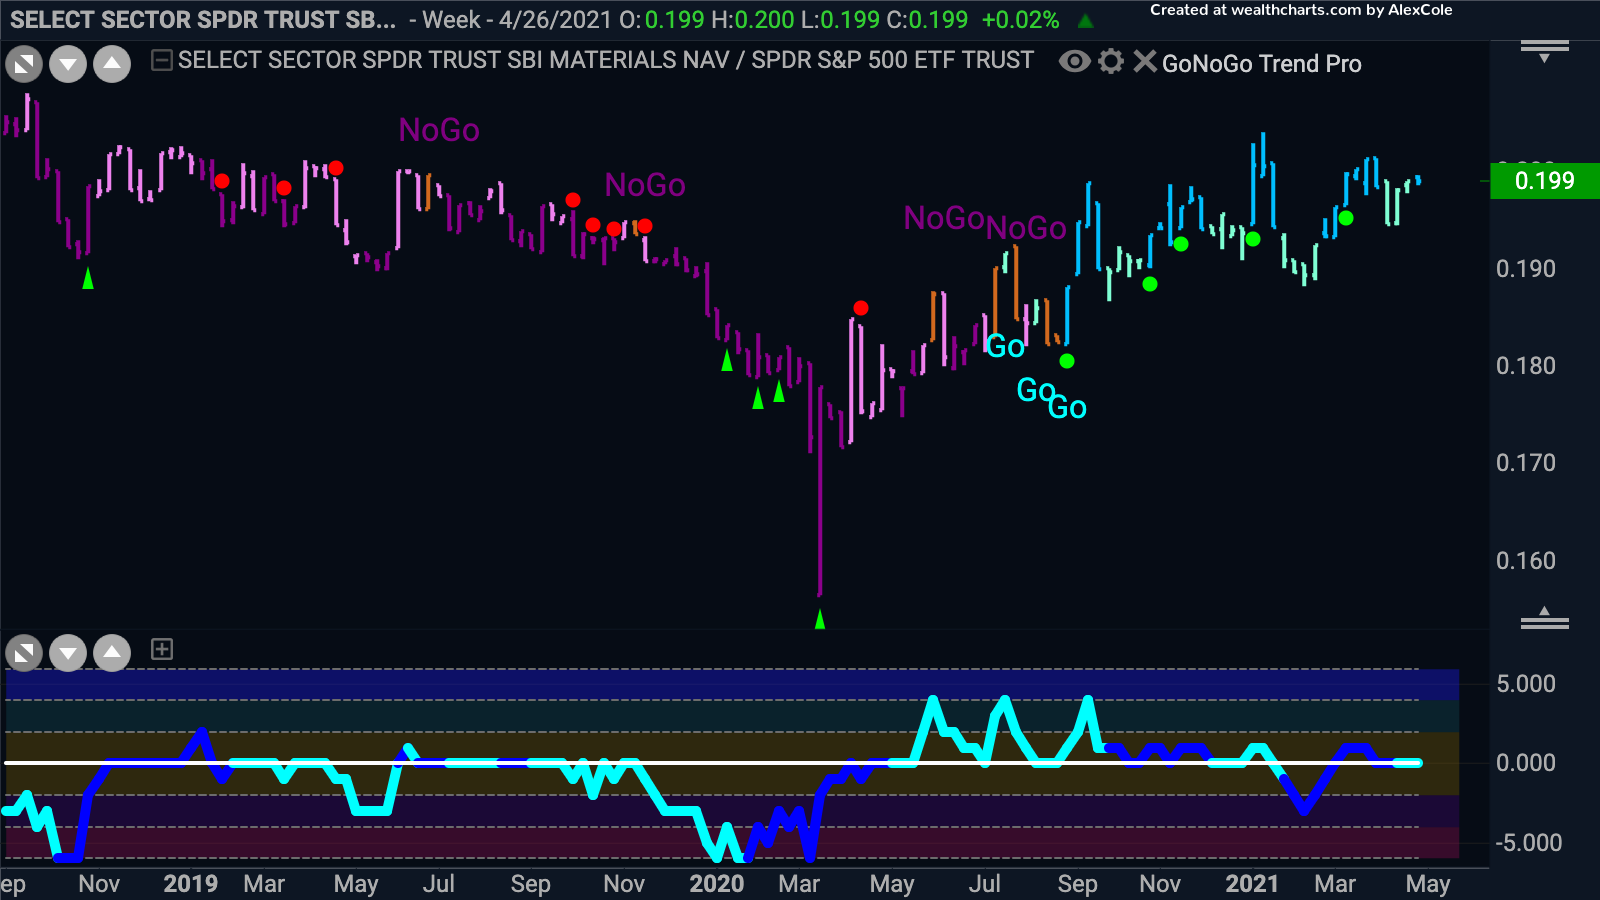
Below is the daily chart of the weekly ratio of the materials sector, $XLB, to the S$P 500, $SPY. As we have seen in recent weeks and from the Sector RelMap above, the materials sector, along with industrials, has been in a “Go” trend since early March. As the economy continues to rebound we wouldn’t bet against this trend. Let’s look at the chart below.
- Looking at this long term chart, we see that the ratio of Materials to the S&P 500 has been in a “Go” trend since the summer of 2020
- For much of this year however, momentum has not been strong with the GoNoGo Oscillator struggling to deviate from the zero line
- We will look to see if the GoNoGo Oscillator can rally into positive territory to give price the push it needs to climb above prior highs

Let’s focus on the chart of the Materials sector, $XLB, Below is the GoNoGo daily chart.
- GoNoGo Trend persists with strong “Go” bars as price hit a new high this week
- The GoNoGo Oscillator is in positive territory but not overbought
- Volume is low and it would be good to see this pick up on any rally from here

Southern Copper Corporation Soaring
Commodities are in a “Go” trend, the dollar continues in its “NoGo”. A weak dollar could help lift commodity prices. The charts above show the materials sector in a “Go” as well. $SCCO mines copper and as such is in the materials sector, so below we’ll analyze the GoNoGo Charts for $SCCO.
- On a weekly basis, the GoNoGo Trend is a strong “Go”, painting bright blue bars
- We recently saw a Go trend continuation icon green circle under price
- For over a month, the GoNoGo Oscillator has been riding the zero line
- We will look for a rally into positive territory which would support prices going higher

Below is the daily GoNoGo Chart of Southern Copper Corporation, with the GoNoGo Trend and Oscillator applied.
- The chart is not as bullish as we might expect
- As price consolidates sideways over the past several months the GoNoGo Trend has struggled to maintain “Go” bars
- However, as price fell to support once more last week it rallied, and the GoNoGo Trend identified briefly a new “Go” trend
- We would need to see the GoNoGo Oscillator rally back above zero and the GoNoGo Trend start to paint “Go” bars consistently and if that happens, a target could be prior highs above $80

Chemicals creating a stir
Chemical producers make up a significant portion of the Materials sector and Olin Corp manufactures and distributes many chemical products. Below is the weekly GoNoGo chart of $OLN.
- The emergence of this “Go” trend in late fall last year was out of a long term “NoGo”
- The GoNoGo Oscillator broke above zero on heavy volume and this lead the color change above
- $OLN has been on an incredible run since then, with barely any interruption of its bright blue “Go” bars
- The GoNoGo Oscillator is currently at extremes and overbought

The chart below shows GoNoGo Trend and GoNoGo Oscillator applied to the daily prices of $OLN
- The “Go” trend is in place with the GoNoGo Trend painting bright blue bars
- After failing at resistance Mid April (highlighted by a counter trend correction arrow), it was able to break higher last week
- The GoNoGo Oscillator is above zero but close to it and we will look to see if support is found at zero as price tries to consolidate above prior highs


